. 2019 Jan;25(1):152-164.
doi: 10.1038/s41591-018-0223-3. Epub 2018 Dec 3.

Identification of evolutionarily conserved gene networks mediating neurodegenerative dementia

Collaborators, Affiliations

Identification of evolutionarily conserved gene networks mediating neurodegenerative dementia

Vivek Swarup et al. Nat Med. 2019 Jan.

Abstract

Identifying the mechanisms through which genetic risk causes dementia is an imperative for new therapeutic development. Here, we apply a multistage, systems biology approach to elucidate the disease mechanisms in frontotemporal dementia. We identify two gene coexpression modules that are preserved in mice harboring mutations in MAPT, GRN and other dementia mutations on diverse genetic backgrounds. We bridge the species divide via integration with proteomic and transcriptomic data from the human brain to identify evolutionarily conserved, disease-relevant networks. We find that overexpression of miR-203, a hub of a putative regulatory microRNA (miRNA) module, recapitulates mRNA coexpression patterns associated with disease state and induces neuronal cell death, establishing this miRNA as a regulator of neurodegeneration. Using a database of drug-mediated gene expression changes, we identify small molecules that can normalize the disease-associated modules and validate this experimentally. Our results highlight the utility of an integrative, cross-species network approach to drug discovery.


Conflict of interest statement

Competing Financial Interests

D.H.G. has received research funding from Takeda Pharmaceutical Company Limited. K.N., H.T., A.O., K.H. and S.K. are employees of Takeda Pharmaceutical Company Limited.

Figures

Figure 1:
Figure 1:. Experimental Design and Characterization of TPR50 Tau Transgenic Mice in Divergent Genetic Backgrounds.
(a) Schematic of the experimental design highlighting that TPR50 mice were crossed with three genetically divergent mouse strains and that tissue from the cortex, hippocampus, brain stem and cerebellum from the resulting F1 crosses was isolated at three and six months for mRNA- and miRNA-seq and downstream weighted co-expression network analysis (WGCNA). (b) Kaplan-Meier survival curve showing significantly decreased survival of all transgenic mice compared to their wild type littermates, as well as decreased survival of the FVB/C57-Tg mice compared to DBA/C57-Tg and C57/C57-Tg mice (two-sided log rank test, p=0.0025, n=180; 15 males and 15 females/condition). (c) Representative images from three independent experiments of phospho-tau specific AT8 staining and hematoxylin counterstaining in coronal and sagittal brain sections of three- and six-month-old transgenic mice of all three strains (n=4 mice/group; sagittal scale bar = 4μm, coronal scale bar = 3μm). (d) Representative images from three independent experiments showing cortical sections of six-month-old wild type and transgenic mice of all three strains stained against Iba1 (red) and GFAP (green) and the nuclear counterstain DAPI (blue) (scale bar=50μm). (e-f) Quantification of GFAP (e) and Iba1 (f) positive cells from 6-month-old cortical slices (n=6 images/mouse, 3 mice per genotype; unpaired two-sided t-test, error bars= SEM). The center line represents the mean.
Figure 2:
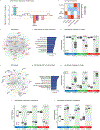
Figure 2:. mRNA Consensus Co-expression Network Analysis.
(a) Signed association (Pearson correlation) of the mRNA module eigengenes with transgenic condition. Modules with positive values indicate increased expression in transgenic mice; modules with negative values indicate decreased expression in transgenic mice. Red dotted lines indicate Bonferroni corrected p<0.05 for multiple comparisons (n=15 modules, n=36 mice/region) using p-values obtained from two-sided test for Pearson correlation. (b) Cell-type enrichment of modules (average n=200 genes) using mouse genes in mRNA modules (fisher’s two-sided exact test, ***FDR<0.005). (c) Co-expression PPI network plot of the NAS module. Top 30 hub genes are indicated by name. The edges between nodes represent both gene co-expression and PPI permitting us to focus on hub genes observed at both the RNA and protein level. (d) GO term enrichment of the NAS module using 794 NAS modules genes (permutation test Z-score). (e-i) Trajectory of the NAS module eigengene in the cortex (e) and cerebellum (i) (unpaired two-sided Wilcox rank test, n=6 mice/group). (f) Co-expression PPI network plot of the NAI module. Top 30 hub genes are indicated by gene name. (g) GO term enrichment of the NAI module using 1833 NAI module genes. (h-j) Trajectory of the NAI module in the cortex (h) and cerebellum (j) (Unpaired two-sided Wilcox rank test, n=6 mice/group). Boxplots in e, h, i and j, the upper and lower lines represent the 75th and 25th percentiles, respectively. The center line represents the median.
Figure 3:
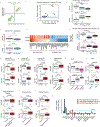
Figure 3:. Transcriptomic and Proteomic Analyses in Human FTD samples
(a) Scatterplot showing Pearson correlation of sub-sampled discovery (Control n=7, Tau-positive FTD n=5) and replication FTD (Control n=7, Tau-positive FTD n=5) dataset. P-values obtained from two-sided test for Pearson correlation are shown. (b) Module preservation in human FTD (cortex) using module definitions from strain independent transgenic mouse network analysis. (c-d) NAS and NAI module eigengene expression in human FTD and control samples in the cortex (c, Control n=14, Tau-positive FTD n=10, Tau-negative FTD n=6) and cerebellum (d, Control n=10, Tau-positive FTD n=7). Tau-positive FTD (FTD-tau Pos.) and tau-negative FTD (FTD-Tau Neg.) are shown (unpaired two-sided Wilcox rank test). (e) Log2 fold change of the top 20 NAS and NAI module genes at the mRNA and protein level. (f) NAS and NAI module eigengene (ME) in human FTD and control protein samples from the cortex. Progranulin-positive FTD (FTD GRN Pos.) and progranulin-negative FTD (FTD GRN Neg.) are shown (unpaired two-sided Wilcox rank test). (g-o) NAS and NAI module eigengene (ME) in various neurological diseases – (g) Human AD Temporal Cortex (Control n=52, AD n=52; Allen et al., 2016), (h) Human AD frontal cortex (Control n=308, AD n=157, Zhang et al., 2013), (i) Human AD frontal cortex proteomics (Control n=15, AD n=20; Seyfried et al., 2017), (j) Human Pathological Aging temporal cortex (Control n=70, Pathological Aging n=30; Allen et al., 2016), (k) Human ALS frontal cortex (Control n=9, C9orf ALS n=8, Sporadic ALS n=10; Prudencio et al., 2015), (l) Human PSP temporal cortex (Control n=73, PSP n=83; Allen et al., 2016), (m) Human Major depressive disorder (MDD) (Control n=67, MDD n=66; Chang et al., 2014), (n) Human Schizophrenia (Control n=167, Schizophrenia n=131; Fromer et al., 2016) and (o) Bipolar disorder (Control n=65, Bipolar disorder n=40; Fromer et al., 2016); unpaired two-sided Wilcox rank test. In all the boxplots, the upper and lower lines represent the 75th and 25th percentiles, respectively. The center line represents the median. (p) Mean scaled enrichment of GWAS hits (MAGMA calculated p-value < 0.05) from FTD GWAS (Ferrari et al., 2014), PSP GWAS (Hoglinger et al., 2011) and AD GWAS (Lambert et al., 2013) in various TPR50 modules (n=15 modules). NAI module enrichment for AD risk genes was still significant after omitting APOE from the analysis (Supplementary Table 4d).
Figure 4:
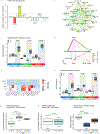
Figure 4:. miRNA Co-expression Network Analysis
(a) Signed association (Pearson correlation) of the miRNA module eigengenes with transgenic condition. Modules with positive values indicate increased expression in transgenic mice; modules with negative values indicate decreased expression in transgenic mice. Red dotted lines indicate Bonferroni corrected p<0.05 for multiple comparisons (n=16 modules) using p-values obtained from two-sided test for Pearson correlation. (b) miRNA co-expression network plot of the miM16 module showing hub miRNAs in the center. Large nodes indicate top five hub miRNAs. (c) Trajectory of the miM16 module in the cortex (unpaired two-sided Wilcox rank test, n=6 mice/group). (d) Multidimensional scaling plot illustrating correlations between module eigengenes of the mRNA and miRNA modules. Colors indicate bi-weighted mid-correlation (R) values. (e) Enrichment of selected miM16 module miRNA predicted targets in mRNA modules. All enrichment values (odds ratio) with FDR<0.05 and OR>2 are shown (fisher’s two-sided exact test, ***FDR<0.005). For a full list of enrichments refer to Supplementary Fig. 6g. Targetscan database was used for miRNA target prediction. (f) Trajectory of log2 expression of miR-203 in the cortex (unpaired two-sided Wilcox rank test, n=6 mice/group). (g,h) miR-203 expression in the cortex (g, Control n=14, Tau-positive FTD n=10, Tau-negative FTD n=6) and cerebellum (h, Control n=10, Tau-positive FTD n=7) of human FTD and control samples. Tau-positive FTD (FTD-Tau Pos.) and tau-negative FTD (FTD-tau Neg.) are shown are shown for cortex. (Unpaired two-sided Wilcox rank test). (i) Module eigengene of predicted targets of miR-203 expression in human FTD and control protein samples in the cortex. Control=8, FTD GRN-Pos=6, FTD GRN-Neg=10, Progranulin-positive FTD (FTD GRN Pos.) and progranulin-negative FTD (FTD GRN Neg.) are shown (unpaired two-sided Wilcox rank test). In all the boxplots, the upper and lower lines represent the 75th and 25th percentiles, respectively, while the center line represents the median.
Figure 5:
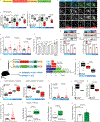
Figure 5:. Overexpression of miR-203 in vitro and in vivo
(a) Schematic of lentiviral vector used for in vitro studies. (b-c) Trajectory of the miR-203 target genes (b) and NAS module eigengene (c) in uninfected primary cortical cultures or cultures infected with either miR-203- or sc-miRNA-lentiviral construct (n=4/group, unpaired two-sided Wilcox rank test). (d) Representative images of TUNEL staining from three independent experiments in mouse primary cortical neurons overexpressing miR-203 or sc-miRNA (control) at DIV6, DIV8 and DIV10 days. Green: GFP (infection), Red: TUNEL and Blue: Hoechst. Scale bar=25μm. (e) Quantification of TUNEL staining. The percent of TUNEL-positive cells in miR-203 overexpressing cultures were normalized at each time point to the average percent of TUNEL-positive cells in sc-miRNA control (error bars = SEM, unpaired two-tailed t-test, n=60 cells for DIV6, n=50 for DIV8 and n=60 cells for DIV10). The center line represents the mean. (f) Normalized luminescence of luciferase reporter assay. Luciferase vectors containing 950 bps of the 3’UTR sequence of Bcl2l2, Dgkb, Mapk10, Vsnl1 and Npepps genes were co-transfected with 20nM miR-203 or control mimics in HEK293T cells and assayed after 24–48hrs (error bars = SEM, unpaired two-tailed t-test, n=12/group). The center line represents the mean. (g) Representative immunoblots from three independent experiments and quantification of BCL2L2 and VSNL1 protein levels from total cell lysates isolated from primary mouse cortical neurons overexpressing miR-203 or sc-miRNA (error bars = SEM, paired two-tailed t-test). The center line represents the mean. Uncropped blots are shown in Supplementary Fig. 9. (h) Schematic representation of experimental design and timeline to overexpress or inhibit miR-203 in C57BL/6 wild type or Tg4510 tau transgenic mouse frontal cortex using AAV2/9 system. (i) NAS module eigengene expression in GFP-positive cells overexpressing miR-203 or sc-miRNA at 3 or 6 weeks after AAV injection in C57BL/6 wild type mice (Unpaired two-tailed Wilcox rank test, n=6/group). (j) Expression of genes involved in positive regulation of apoptosis (GO term ID: 0043065) and negative regulation of apoptosis (GO term ID: 0043066) in GFP-positive cells overexpressing miR-203 or sc-miRNA at 3 and 6 weeks after AAV injection in C57BL/6 wild type mice (unpaired two-tailed Wilcox rank test, n=6/group). (k) Caspase-8 (CASP8) intensity of GFP-positive cells overexpressing miR-203 were normalized at each time point to the average Caspase-8 intensity of GFP-positive cells overexpressing sc-miRNA control (unpaired two-tailed Mann-Whitney test, n=464 cells for 3-weeks control, n=937 cells for 3-weeks miR-203, n=629 cells for 6-weeks control, n=1441 cells for 6-weeks miR-203; three independent biological replicates/condition). The center line represents the mean and error bars showing SEM (l-m) Module eigengene of miR-203 targets (l) or NAS module (m) in GFP-positive cells overexpressing miR-203 6 weeks after AAV injection (unpaired two-tailed Wilcox rank test, n=5 scrambled (sc)-miRNA infected mice and n=6 miR203 infected mice). (n) Caspase-8 (Casp8) intensity of GFP-positive cells overexpressing miR-203 in Tg4510 Tau transgenic mice were normalized at each time point to the average Caspase-8 intensity of GFP-positive cells overexpressing sc-miRNA control (unpaired two-tailed Mann-Whitney test, n=507 cells for sc-miRNA and 2793 cells for miR-203; three independent biological replicates/condition). The center line represents the mean and error bars showing SEM. (o-p) Module eigengene of miR-203 targets (o) or NAS module (p) in GFP-positive cells overexpressing sc-TuD control or miR-203 TuD 6 weeks after AAV injection in Tg4510 Tau transgenic mice (Unpaired two-tailed Wilcox rank test, n=5 scrambled (sc)-miRNA infected mice and n=6 miR203 infected mice). In all the boxplots, the upper and lower lines represent the 75th and 25th percentiles, respectively, while the center line represents the median. (q) C-fos intensity of GFP-positive cells expressing TuD-miR203 in Tg4510 Tau transgenic mice were normalized at each time point to the average c-fos intensity of GFP-positive cells expressing sc-TuD control (Unpaired two-tailed Student’s T-test, n=50 images (control) and n=60 images (miR203); n=5 scrambled (sc)-miRNA infected mice and n=6 miR203 infected mice). The center line represents the mean and error bars showing SEM.
Figure 6:
Figure 6:. Small Molecule Inhibition of miR-203 Induced Cell Death in vitro.
(a) Co-expression based network plot of scriptaid targets from the Connectivity Map database with genes in the NAS and NAI modules. Genes which are upregulated with scriptaid treatment are connected by red edges and those which are downregulated are connected by green edges. Nodes size represents centrality within the network. (b, d) Representative images from three independent experiments of TUNEL staining in mouse primary cortical neurons overexpressing miR-203 or sc-miRNA (control) at DIV7 treated with DMSO control and 1uM or 2.5uM scriptaid (b) or DMSO control and 0.5uM or 1uM SAHA (d) for 24hrs prior (green: GFP, red: TUNEL, blue: Hoechst, scale bar=25μm). (c, e) Quantification of TUNEL positive cells from three independent experiments treated with scriptaid (c) and SAHA (e) (unpaired two-tailed t-test, n=15/group for SAHA experiments and n=20/group for scriptaid experiments). Scriptaid treatment does not alter miR-203 overexpression levels (Supplementary Fig. 9, indicating that the decrease in cell death is not a result of changes in viral infection, miRNA processing or regulation of miR-203 by scriptaid. The center line represents the mean and error bars showing SEM. (f) Trajectory of the NAS module eigengene in cultures infected with either miR-203- or sc-miRNA-lentiviral construct treated with either DMSO, 0.5 or 1uM SAHA (unpaired two-tailed Wilcox rank test, n=6/group). (g) Trajectory of the NAS module eigengene in human iPSC derived neurons from control and A152T Tau patients treated either DMSO, 0.5, 1 or 2.5uM SAHA (unpaired two-tailed Wilcox rank test, n=6/group). In all the boxplots, the upper and lower lines represent the 75th and 25th percentiles, respectively, while the center line represents the median.
Figure SM1
Figure SM1. Gating strategy used for FACS sorting.
After setting the initial gate for FSC (Gate P1) and SSC (Gate P2) and both (Gate P3) based on previous experiments with adult mouse cortex, we further gated for DAPI -ve and DRAQ5 positive gates to get “live” cells (Gate P4). Gate P4 was then sorted for GFP positive fraction based on fluorescent intensity (P5)

References

    1. Hinz FI & Geschwind DH Molecular Genetics of Neurodegenerative Dementias. Cold Spring Harb Perspect Biol 9, a023705 (2017). - PMC - PubMed
    1. Iqbal K, Liu F & Gong C-X Tau and neurodegenerative disease: the story so far. Nature Reviews Neurology 12, 15–27 (2016). - PubMed
    1. Masters CL et al. Alzheimer’s disease. Nat Rev Dis Primers 1, 15056 (2015). - PubMed
    1. Kovacs GG Invited review: Neuropathology of tauopathies: principles and practice. Neuropathol Appl Neurobiol 41, 3–23 (2015). - PubMed
    1. Mullane K & Williams M Alzheimer’s therapeutics: continued clinical failures question the validity of the amyloid hypothesis-but what lies beyond? Biochem. Pharmacol 85, 289–305 (2013). - PubMed

Methods References

    1. Schroeder A et al. The RIN: an RNA integrity number for assigning integrity values to RNA measurements. BMC Mol. Biol 7, 3 (2006). - PMC - PubMed
    1. Wes PD et al. Tau overexpression impacts a neuroinflammation gene expression network perturbed in Alzheimer’s disease. PLoS ONE 9, e106050 (2014). - PMC - PubMed
    1. Srinivasan K et al. Untangling the brain’s neuroinflammatory and neurodegenerative transcriptional responses. Nat Comms 7, 11295 (2016). - PMC - PubMed
    1. Chishti MA et al. Early-onset amyloid deposition and cognitive deficits in transgenic mice expressing a double mutant form of amyloid precursor protein 695. Journal of Biological Chemistry 276, 21562–21570 (2001). - PubMed
    1. Matarin M et al. A Genome-wide Gene-Expression Analysis and Database in Transgenic Mice during Development of Amyloid or Tau Pathology. Cell Rep 10, 633–644 (2015). - PubMed

Publication types

MeSH terms

Grants and funding