Clinical Trial
. 2018 Dec 3;8(1):17527.
doi: 10.1038/s41598-018-35944-w.

Low plasma haptoglobin is a risk factor for life-threatening childhood severe malarial anemia and not an exclusive consequence of hemolysis

Affiliations
Clinical Trial

Low plasma haptoglobin is a risk factor for life-threatening childhood severe malarial anemia and not an exclusive consequence of hemolysis

Samuel Eneọjọ Abah et al. Sci Rep. .

Abstract

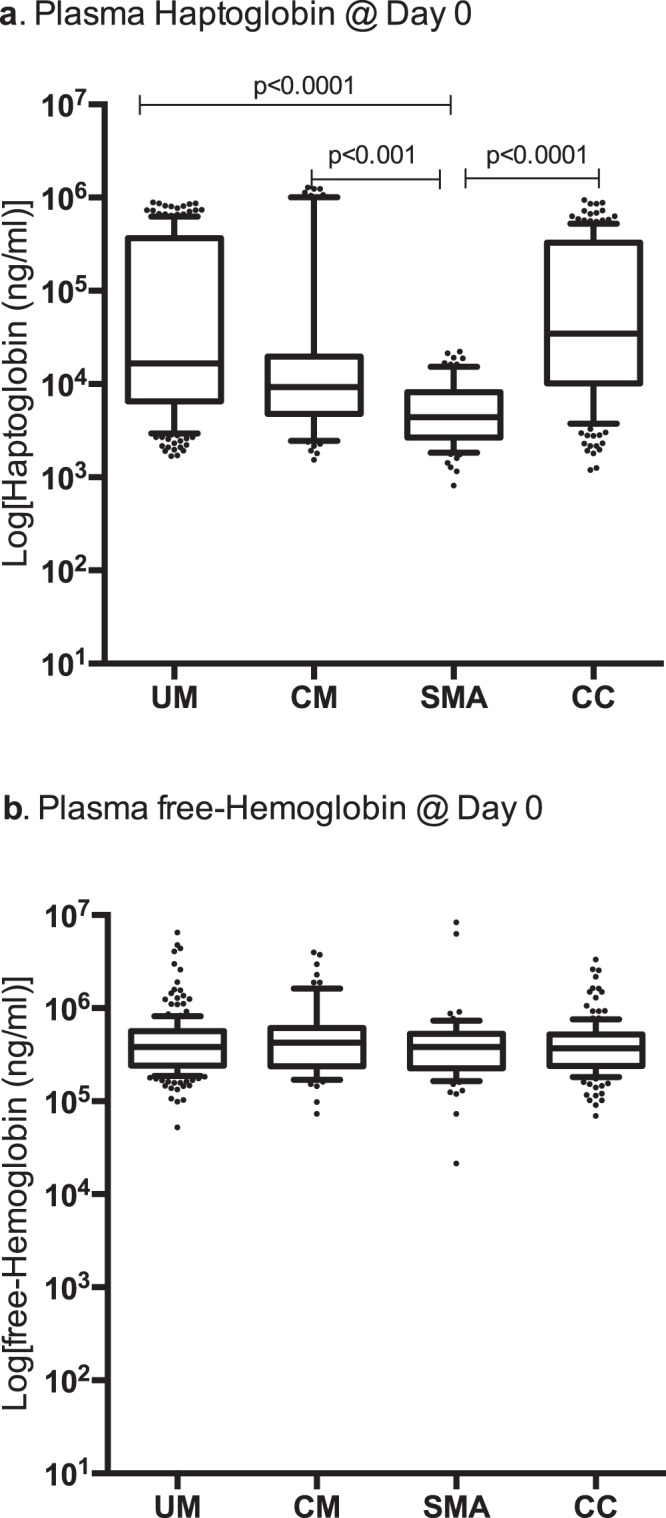
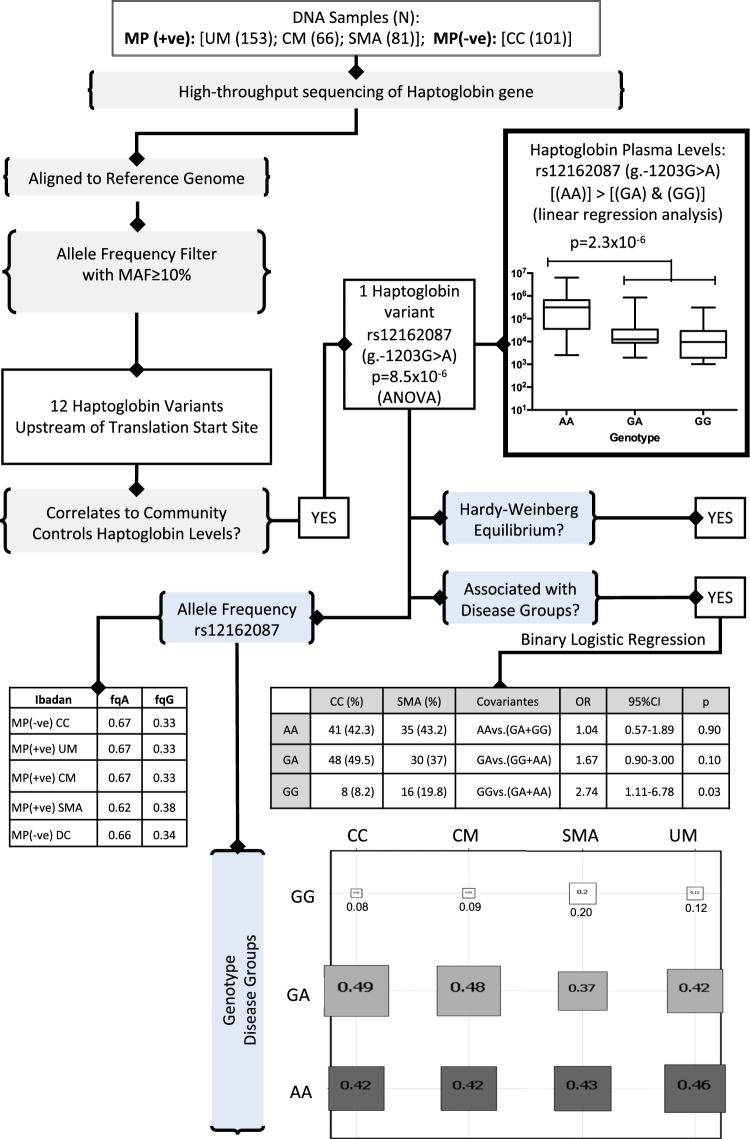
Severe Malarial Anemia (SMA), a life-threatening childhood Plasmodium falciparum malaria syndrome requiring urgent blood transfusion, exhibits inflammatory and hemolytic pathology. Differentiating between hypo-haptoglobinemia due to hemolysis or that of genetic origin is key to understand SMA pathogenesis. We hypothesized that while malaria-induced hypo-haptoglobinemia should reverse at recovery, that of genetic etiology should not. We carried-out a case-control study of children living under hyper-endemic holoendemic malaria burden in the sub-Saharan metropolis of Ibadan, Nigeria. We show that hypo-haptoglobinemia is a risk factor for childhood SMA and not solely due to intravascular hemolysis from underlying schizogony. In children presenting with SMA, hypo-haptoglobinemia remains through convalescence to recovery suggesting a genetic cause. We identified a haptoglobin gene variant, rs12162087 (g.-1203G > A, frequency = 0.67), to be associated with plasma haptoglobin levels (p = 8.5 × 10⁻⁶). The Homo-Var:(AA) is associated with high plasma haptoglobin while the reference Homo-Ref:(GG) is associated with hypo-haptoglobinemia (p = 2.3 × 10⁻⁶). The variant is associated with SMA, with the most support for a risk effect for Homo-Ref genotype. Our insights on regulatory haptoglobin genotypes and hypo-haptoglobinemia suggest that haptoglobin screening could be part of risk-assessment algorithms to prevent rapid disease progression towards SMA in regions with no-access to urgent blood transfusion where SMA accounts for high childhood mortality rates.


Conflict of interest statement

The authors declare no competing interests.

Figures

Figure 1
Figure 1
Principal Component Analysis (PCA) projection of multivariate clinical and laboratory plasma parameters of Discovery Cohort study groups at PD0. The first two principal components (PCA1 and PCA 2) were plotted in a two-dimensional scatter-plot after which the clinical group labels CC (yellow), UM (blue), CM (grey) and SMA (red) were color imposed thereafter. The projection shows the internal structure of the multivariate data while preserving its orthogonal variance. (UM) = Uncomplicated Malaria; (SMA) = Severe Malarial Anemia; (CM) = Cerebral Malaria; (CC) = healthy malaria-negative Community Controls; PD0 = at admission prior to drug treatment and/or blood transfusion.
Figure 2
Figure 2
Analysis of plasma haptoglobin and plasma free-hemoglobin of discovery cohort study groups at PD0. (a) Box plot of Log [plasma haptoglobin (ng/ml)] at admission (PD0) in the different study groups of the discovery cohort at PD0. SMA < CC (p < 0.0001); SMA < CM (p < 0.001); SMA < UM (p < 0.0001). (b) Box plot of Log [plasma free-hemoglobin (ng/ml)] at admission (PD0) in the different study groups of the discovery cohort at PD0. (p > 0.05 for all comparisons). The box plots show the IQR (box); the median (box line); and the 10–90 percentile (whiskers). Non-parametric Kruskal-Wallis with Dunn’s multiple comparison correction. (UM) = Uncomplicated Malaria; (SMA) = Severe Malarial Anemia; (CM) = Cerebral Malaria; (CC) = healthy malaria-negative Community Controls; PD0 = at admission prior to drug treatment and/or blood transfusion. IQR = Interquartile Q3-Q1 Range. For discovery cohort clinical groups details see Table 1.
Figure 3
Figure 3
Analysis of plasma HP, fHb and LDH of validation cohort study groups from admission (PD0) through convalescence (PD7-PD14) to recovery (PD28). (a) Log [plasma haptoglobin (ng/ml)] from admission (PD0) through convalescence (PD7-PD14) to recovery (PD28). Asterisks show: HP SMA@PD0 < HP CC (p < 0.001); HP SMA@PD7 < HP CC (p < 0.05); HP SMA@PD14 < Plasma HP CC (p < 0.05); HP SMA@PD28 < HP CC (p < 0.001). Ampersand (&) shows: HP SMA@PD0 < HP SMA@PD28 (p < 0.01) (b) Log [plasma free-hemoglobin (ng/ml)] from admission (PD0) through convalescence (PD7-PD14) to recovery (PD28). c) Log [plasma LDH (ng/ml)] from admission (PD0) through convalescence (PD7-PD14) to recovery (PD28). Plasma LDH in all malaria-positive groups at PD0 > CC (p < 0.001). Plots show mean (circles) and standard error of the mean (whiskers). Asterisk: *(p < 0.05); **(p < 0.01); ***(p < 0.001). Non-parametric Kruskal-Wallis with Dunn’s multiple comparison correction (between group comparisons). Paired non-parametric Wilcoxon tests were used to compare paired data within a disease group. For validation cohort clinical group details see Table 1. (UM) = Uncomplicated Malaria (blue line); (SMA) = Severe Malarial Anemia (red line); (CM) = Cerebral Malaria (black line); (CC) = healthy malaria-negative Community Controls (yellow dotted-line); HP = haptoglobin; fHB = free hemoglobin; LDH = lactate dehydrogenase; PD0 = at admission prior to drug treatment and/or blood transfusion; PD7 = Plasma sample collected at the 7th day after PD0; PD14 = Plasma sample collected at 14th day after PD0; PD28 = Plasma level collected on 28th day after PD0 (recovery).
Figure 4
Figure 4
Haptoglobin isoform frequencies and plasma HP of HTS Cohort study groups. (a) Frequency of haptoglobin isoforms HP1-1 (dark-grey square); HP2-1 (grey square) and HP2-2 (white square) for the clinical groups. Sizes of the square are drawn to scale and depicts the frequency of the isoform written with the square. HP1-1, HP2-1 and HP2-2 are HP phenotypes. *The HP1-1 isoform is associated with CM (p = 0.038) with an estimated OR of 2.1 (1.04–4.4). (b) Bar plot of Log [plasma HP (ng/ml)] per isoforms HP1-1 (black bar); HP2-1 (grey bar) and HP2-2 (white bar) for the clinical groups. Bar plot shows mean and standard error of the mean (whiskers). Non-parametric Kruskal-Wallis with Dunn’s multiple comparison correction; ns = not significant (p > 0.05). (UM) = Uncomplicated Malaria; (SMA) = Severe Malarial Anemia; (CM) = Cerebral Malaria; (CC) = healthy malaria-negative Community Controls. For HTS Cohort clinical group details see Table 1.
Figure 5
Figure 5
Flow chart showing the variant filtering strategies and association studies used in the Ibadan HTS-Cohort. High throughput sequencing of Haptoglobin gene has been performed on 401 samples. We used an allele frequency filtering to select the variants with a MAF ≥ 10%. ANOVA and linear regression analysis were then used to evaluate their association with the haptoglobin level in CC group. One variant rs12162087 was selected upon this association. GenePop software was used to determine the Hardy Weinberg equilibrium in control group. We performed a binary logistic regression to test the association of this variant and SMA. The allele and the genotype frequencies for rs12162087 are indicated for each disease group. (UM) = Uncomplicated Malaria; (SMA) = Severe Malarial Anemia; (CM) = Cerebral Malaria; (CC) = healthy malaria-negative Community Controls; (N) = number of subjects; MP(+ve) = malaria parasite positive; MP(−ve) = malaria parasite negative, MAF = Minor allele frequency. For HTS Cohort clinical group details see Table 1 and details for variants see Table 2.

References

    1. World Health Organization. World Malaria Report 2017. doi:CC BY-NC-SA 3.0 IGO (World Health Organization, 2017).
    1. World Health Organization. World Malaria Report 2016. World Malaria Report doi:CC BY-NC-SA 3.0 IGO (World Health Organization, 2016).
    1. Bamiselu, O. F. et al. Adherence to malaria diagnosis and treatment guidelines among healthcare workers in Ogun State, Nigeria. BMC Public Health, 10.1186/s12889-016-3495-x (2016). - PMC - PubMed
    1. Ajetunmobi Wasiu A, Orimadegun Adebola E, Brown Biobele J, Afolabi Nathaniel K, Olabiyi Folorunso A, Anetor John I, Omokhodion Samuel, Osinusi Kikelomo, Akinbami Felix O, Shokunbi Wuraola A, Sodeinde Olugbemiro, Fernandez-Reyes Delmiro. Haemoglobinuria among children with severe malaria attending tertiary care in Ibadan, Nigeria. Malaria Journal. 2012;11(1):336. doi: 10.1186/1475-2875-11-336. - DOI - PMC - PubMed
    1. Burte F, et al. Severe childhood malaria syndromes defined by plasma proteome profiles. PLoS One. 2012;7:e49778. doi: 10.1371/journal.pone.0049778. - DOI - PMC - PubMed

Publication types