. 2018 Nov 19:9:553.
doi: 10.3389/fgene.2018.00553. eCollection 2018.

Sequence Characterization of DSG3 Gene to Know Its Role in High-Altitude Hypoxia Adaptation in the Chinese Cashmere Goat

Affiliations

Sequence Characterization of DSG3 Gene to Know Its Role in High-Altitude Hypoxia Adaptation in the Chinese Cashmere Goat

Chandar Kumar et al. Front Genet. .

Abstract

The Tibetan cashmere goat is one of the main goat breeds used by people living in the plateau. It exhibits the distinct phenotypic characteristics observed in lowland goats, allowing them to adapt to the challenging conditions at high altitudes. It provides an ideal model for understanding the genetic mechanisms underlying high-altitude adaptation and hypoxia-related diseases. Our previous exome sequencing of five Chinese cashmere breeds revealed a candidate gene, DSG3 (Desmoglein 3), responsible for the high-altitude adaptation of the Tibetan goat. However, the whole DSG3 gene (44 kbp) consisting of 16 exons in the goat genome was not entirely covered by the exome sequencing. In this study, we resequenced all the 16 exons of the DSG3 gene in ten Chinese native goat populations. Twenty-seven SNP variants were found between the lowland and highland goat populations. The genetic distance (FST ) of significant SNPs between the lowland and highland populations ranged from 0.42 to 0.58. By using correlation coefficient analysis, linkage disequilibrium, and haplotype network construction, we found three non-synonymous SNPs (R597E, T595I, and G572S) in exon 5 and two synonymous SNPs in exons 8 and 16 in DSG3. These mutations significantly segregated high- and low-altitude goats in two clusters, indicating the contribution of DSG3 to the high-altitude hypoxia adaptation in the Tibetan goat.

Keywords: DSG3; SNPs; Tibetan goat; exons; high-altitude adaptation; hypoxia.


Figures

FIGURE 1
FIGURE 1
The pattern of allele frequency of SNP1 (A), SNP2 (C) and SNP3 (E) of DSG3 has continuously changed from sea level at 30 m (LN goat population) to the elevation at 4700 m (RT goat population). Blue, a frequency of the mutant allele, Green, a frequency of a reference allele in each goat population, respectively. The plot of the correlation analysis between major allele frequency of SNP1 (B), SNP2 (D) and SNP3 (F) and sampling locations of 10 cashmere goat populations, r represents the correlation coefficient (r = 0.8529, P < 0.05). Asterisks (∗∗) represents very significantly.
FIGURE 2
FIGURE 2
The pattern of allele frequency of SNP4 (A) and SNP5 (C) of DSG3 has continuously changed from sea level at 30 m (LN goat population) to the elevation at 4700 m (RT goat population). Blue, a frequency of the mutant allele, Green, a frequency of a reference allele in each goat population, respectively. The plot of the correlation analysis between major allele frequency of SNP4 (B), SNP5 (D) and sampling locations of 10 cashmere goat populations, r represents the correlation coefficient (r = 0.9061, P < 0.05). Asterisks (∗∗∗) represents extremely significantly.
FIGURE 3
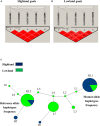
FIGURE 3
(A) Linkage disequilibrium of non-synonymous variants (SNP1, SNP2, and SNP3) and synonymous substitutions (SNP4 and SNP5) in highland goat populations; RT and BG. (B) Linkage disequilibrium of non-synonymous variants (SNP1, SNP2, and SNP3) and synonymous substitutions (SNP4 and SNP5) in lowland goat populations; LN, CZ, HN, GF, HS, IM, NJ, and DL. Strengths of the LD between two SNPs were indicated by the color scheme (a bright red diamond indicates a strong correlation) by the pairwise D° values given as the percentage in each diamond (a bright red diamond indicates D° = 1.00). (C) Haplotype networks of non-synonymous variants (SNP1, SNP2, and SNP3, T480N) and synonymous substitutions (SNP4 and SNP5) among lowland and highland goat populations. Each node represents a haplotype, with the size of the circle proportional to frequency. The length of a branch is proportional to the number of nucleotide differences. Circles are color code according to the population. Blue: highland (RT and BG), Green: lowland (LN, CZ, HN, GF, HS, IM, NJ, and DL), abbreviation: HL, high and low altitude; H, high altitude; L, low altitude.
FIGURE 4
FIGURE 4
(A) Protein sequence alignment among different mammalian aligned by cluster omega (Sievers et al., 2011) predicated non-synonymous mutation in Tibetan goat, a conserver site or polymorphism. The dashes indicate deletions. (B) Sanger sequence of blue and black region showed nucleotide position changed in lowland goat, blue indicated nucleotide C, while black indicated nucleotide G. (C) Sanger sequence of red and blue region indicated nucleotide position changed in Tibetan goat, red indicated nucleotide T, while Blue indicated nucleotide C.

References

    1. Adzhubei I. A., Schmidt S., Peshkin L., Ramensky V. E., Gerasimova A., Bork P., et al. (2010). A method and server for predicting damaging missense mutations. Nat. Methods 7 248–249. 10.1038/nmeth0410-248 - DOI - PMC - PubMed
    1. Ai H., Yang B., Li J., Xie X., Chen H., Ren J. (2014). Population history and genomic signatures for high-altitude adaptation in Tibetan pigs. BMC Genomics 15:834. 10.1186/1471-2164-15-834 - DOI - PMC - PubMed
    1. Akey J. M., Zhang G., Zhang K., Jin L., Shriver M. D. (2002). Interrogating a high-density SNP map for signatures of natural selection. Genome Res. 12 1805–1814. 10.1101/gr.631202 - DOI - PMC - PubMed
    1. Bandelt H. J., Forster P., Rohl A. (1999). Median-joining networks for inferring intraspecific phylogenies. Mol. Biol. Evol. 16 37–48. 10.1093/oxfordjournals.molbev.a026036 - DOI - PubMed
    1. Barrett J. C., Fry B., Maller J., Daly M. J. (2005). Haploview: analysis and visualization of LD and haplotype maps. Bioinformatics 21 263–265. 10.1093/bioinformatics/bth457 - DOI - PubMed