. 2018 Sep 14;7(1):55-71.
doi: 10.1016/j.jcmgh.2018.08.009. eCollection 2019.

Disruption of FOXP3-EZH2 Interaction Represents a Pathobiological Mechanism in Intestinal Inflammation

Affiliations

Disruption of FOXP3-EZH2 Interaction Represents a Pathobiological Mechanism in Intestinal Inflammation

Adebowale O Bamidele et al. Cell Mol Gastroenterol Hepatol. .

Abstract

Background & aims: Forkhead box protein 3 (FOXP3)+ regulatory T cell (Treg) dysfunction is associated with autoimmune diseases; however, the mechanisms responsible for inflammatory bowel disease pathophysiology are poorly understood. Here, we tested the hypothesis that a physical interaction between transcription factor FOXP3 and the epigenetic enzyme enhancer of zeste homolog 2 (EZH2) is essential for gene co-repressive function.

Methods: Human FOXP3 mutations clinically relevant to intestinal inflammation were generated by site-directed mutagenesis. T lymphocytes were isolated from mice, human blood, and lamina propria of Crohn's disease (CD) patients and non-CD controls. We performed proximity ligation or a co-immunoprecipitation assay in FOXP3-mutant+, interleukin 6 (IL6)-treated or CD-CD4+ T cells to assess FOXP3-EZH2 protein interaction. We studied IL2 promoter activity and chromatin state of the interferon γ locus via luciferase reporter and chromatin-immunoprecipitation assays, respectively, in cells expressing FOXP3 mutants.

Results: EZH2 binding was abrogated by inflammatory bowel disease-associated FOXP3 cysteine 232 (C232) mutation. The C232 mutant showed impaired repression of IL2 and diminished EZH2-mediated trimethylation of histone 3 at lysine 27 on interferon γ, indicative of compromised Treg physiologic function. Generalizing this mechanism, IL6 impaired FOXP3-EZH2 interaction. IL6-induced effects were reversed by Janus kinase 1/2 inhibition. In lamina propria-derived CD4+T cells from CD patients, we observed decreased FOXP3-EZH2 interaction.

Conclusions: FOXP3-C232 mutation disrupts EZH2 recruitment and gene co-repressive function. The proinflammatory cytokine IL6 abrogates FOXP3-EZH2 interaction. Studies in lesion-derived CD4+ T cells have shown that reduced FOXP3-EZH2 interaction is a molecular feature of CD patients. Destabilized FOXP3-EZH2 protein interaction via diverse mechanisms and consequent Treg abnormality may drive gastrointestinal inflammation.

Keywords: C232, cysteine 232; CD, Crohn’s disease; ChIP, chromatin-immunoprecipitation; Crohn’s Disease; EED, embryonic ectoderm development; EZH2, enhancer of zeste homolog 2; Epigenetics; FCS, fetal calf serum; FOXP3, forkhead domain-containing X-chromosome–encoded protein; H3K27me3, trimethylated histone H3 at lysine 27; IBD, inflammatory bowel disease; IL, interleukin; IPEX, immune dysregulation, polyendocrinopathy, enteropathy, X-linked; JAK, Janus kinase; LZ, leucine zipper; PBMC, peripheral blood mononuclear cell; PBS, phosphate-buffered saline; PLA, proximity ligation assay; PMA, phorbol 12-myristate 13-acetate; PRC2, polycomb repressive complex 2; Proinflammatory Cytokine; Regulatory T Cells; STAT, signal transducer and activator of transcription; SUZ12, suppressor of zeste; Th, T helper; Treg, regulatory T cell; WT, wild-type; co-IP, co-immunoprecipitation.


Figures

Figure 1
Figure 1
FOXP3 interacts with EZH2 in murine induced Tregs (iTreg) and freshly isolated PBMC-derived human Tregs. (A) Sketch depicts PLA to detect and quantify protein–protein interactions [A] and [B] <30 nm in close proximity or protein modifications by combining ligation of detection probes with rolling-circle amplification. (B) Mouse naive CD4+ T cells isolated from spleen differentiated into Tregs (induced) or Th17 cells followed by PLA. Representative confocal PLA images of CD4+ T-cell subsets from 3 independent experiments show endogenous FOXP3–EZH2 protein interaction (red). (C) Quantification of PLA+ cells from panel B. n = number of cells imaged. ***P < .001. Red horizontal bar shows means ± SEM from 3 independent experiments (1-way analysis of variance + Bonferroni test). (D) Whole-cell lysates from activated CD4+ T cells or iTregs in panel B were subjected to immunoprecipitation with anti-FOXP3 and immunoblotted for FOXP3 and EZH2; input shows EZH2 protein expression in whole-cell lysates. Data are representative of 3 independent experiments. (E) Representative PLA images of PBMC-derived human Tregs (CD4+CD25++) from 3 healthy donors showing endogenous FOXP3–EZH2 interaction (magenta) before and after T-cell–receptor activation with antibodies against CD3 and CD28; CD4+CD25- cells were used as negative controls. Scale bar: 5 μm. Dotted white lines denote the plasma membrane as seen on differential interference contrast images. Data are representative of 3 independent experiments. (F) Quantification of nuclear PLA signals (number of dots per cell) in images from E. n = number of cells imaged. ***P < .001; NS, non-significant P value. Red horizontal bars indicate means ± SEM (1-way analysis of variance + Bonferroni test) from 3 independent experiments. DAPI, 4′,6-diamidino-2-phenylindole.
Figure 2
Figure 2
FOXP3 constitutively interacts with the PRC2 complex. HEK293T cells transfected with plasmids encoding either EZH2 (myc-tagged EZH2), FOXP3 (His-tagged FOXP3), or both for 48 hours were subjected to PLA or co-immunoprecipitation using the indicated primary antibodies. (A) Representative PLA images of cells from 3 independent experiments; first 3 rows are negative control experiments and green signals indicate a FOXP3–EZH2 interaction. Scale bar: 20 μm. (B) Quantitation of nuclear PLA signals in images from panel A; n = number of cells imaged. ***P < .001. Red horizontal bars indicate means ± SEM (1-way analysis of variance + Bonferroni test) from 3 independent experiments. (C) Whole-cell lysates from HEK293T cells transfected with plasmids encoding His–FOXP3 and myc–DDK–tagged EZH2 were subjected to immunoprecipitation with IgG or anti-FOXP3 antibody, immunoblotted for His–FOXP3 and myc–EZH2 with FOXP3 and myc antibodies. Input shows protein expression in whole-cell lysates. Data are representative of 3 independent experiments. (D) Cells from panel C were subjected to PLA using His antibody (negative control) or both His and myc antibodies. Red signals indicate FOXP3–EZH2 interaction; data are representative of 3 independent experiments. Scale bar: 20 μm. (E) Quantitation from 3 independent experiments of nuclear PLA signals in images from Figure 1D. ∗∗∗P < .001. Red horizontal bars indicate means ± SEM (1-way analysis of variance + Bonferroni test). n = number of cells imaged. (F and G) Cell lysates from cell lines transfected with the indicated plasmids (FOXP3 and EZH2 in HEK293T cells or FOXP3 alone in Jurkat T cells) were subjected to immunoprecipitation with IgG or anti-FOXP3 antibody; immunoblotted for His–FOXP3, myc–EZH2, and the other PRC2 subunits SUZ12 and EED with the indicated antibodies. Data are representative of 3 independent experiments. DAPI, 4′,6-diamidino-2-phenylindole.
Figure 3
Figure 3
FOXP3 cysteine 232 to glycine (FOXP3–C232G) mutation implicated in loss of Treg-suppressor function and early onset IBD disrupts EZH2 interaction and its gene co-repressor function. (A) Schematic depicts structural domains within 50 kilodalton human FOXP3 (1–431 amino acids), detailing genetic mutations associated with IBD and IPEX syndrome. Structural domains include the following repressor domain (RD), zinc finger (ZnF), LZ, and forkhead (FKH)-DNA binding. Red and black arrows indicate amino acids mutated in IBD and IPEX patients. C232G, cysteine 232 to glycine; L242P, leucine 242 to proline; K250Δ, lysine 250 deletion. (B) Jurkat cells transfected with IL2 firefly and renilla luciferase plasmids plus either empty vector or His–FOXP3 plasmids were treated with 0.4% dimethyl sulfoxide (DMSO)–vehicle control or indicated concentrations of EZH2 inhibitor GSK126. Thirty-six hours later, cells were treated with 0.4% DMSO–vehicle control or PMA/ionomycin for 12 hours to activate the IL2 promoter as measured by firefly luciferase expression normalized to the renilla internal control. Bottom panel: Whole-cell lysates from transfected and GSK126-treated cells were immunoblotted for H3K27me3; the same membrane was stripped and reblotted for H3 as control. Red horizontal bar denotes the mean IL2 firefly/renilla ratio ± SD from 3 replicates. ****P < .0001 (1-way analysis of variance + Bonferroni test). Result is representative of 3 independent experiments. (C) Jurkat cells expressing vector or FOXP3 (WT or mutants) plus luciferase plasmids were treated with DMSO or PMA/ionomycin as in panel B. Red horizontal bar denotes the mean IL2 firefly/renilla ratio ± SD from 3 replicates. ***P < .001 (1-way analysis of variance + Bonferroni test). (D and E) Whole-cell lysates from HEK293T cells co-expressing myc-tagged EZH2 and His–FOXP3 WT or mutants were subjected to FOXP3 immunoprecipitation, immunoblotted for His–FOXP3 and myc–EZH2 using the indicated antibodies. Red arrows and gray arrows emphasize C232 mutants within FOXP3. Data shown are representative of 3 independent experiments. (F) Jurkat cells expressing empty vector or His–FOXP3 (WT or C232 mutants) and indicated luciferase plasmids were treated with 0.4% DMSO or PMA/ionomycin. Red horizontal bar denotes the mean IL2 firefly/renilla ratio ± SD from 3 replicates; ***P < .001 (1-way analysis of variance + Bonferroni test). Result is representative of 3 independent experiments. (G) Chromatin from Jurkat cells expressing FOXP3–WT or –C232Δ were incubated with IgG control or anti-H3K27me3 antibody, polymerase chain reaction (PCR) for the IFNγ promoter was performed to assess the presence of H3K27me3 repressive mark. Data shown are representative of 3 independent experiments. (H) Jurkat cells overexpressing empty His-vector plasmid (control), His–FOXP3 WT or His–FOXP3 mutants (C232G and C232Δ) were treated with 0.2% DMSO (top row) or PMA/ionomycin (bottom row) for 12 hours. Cells were permeabilized and then stained with fluorescently conjugated IL2 and His antibodies against intracellular IL2 and His-tagged FOXP3. Dot plot in quadrant 2 (Q2) depicts the frequency, in percentage, of IL2 and His co-expressing cells as measured by flow cytometry. Data shown are representative of 3 independent experiments.
Figure 4
Figure 4
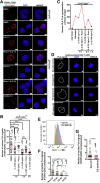
IBD-associated IL6-induced membrane-to-nucleus signaling pathway similarly disrupts FOXP3–EZH2 interaction in a manner reversible by JAK1/2 inhibition. (A) Confocal microscopic PLA images shows endogenous FOXP3–EZH2 interaction (red signals) in the nucleus of CD4+CD25++ cells (Tregs) before (0.2%–0.4% dimethyl sulfoxide [DMSO]), after IL6 (50 or 100 ng/mL, 2×) or after IL6 and JAK1/2 inhibitor ruxolitinib pretreatment (10 μmol/L). CD4+CD25- cells were used as negative controls. Scale bar: 5 μm. Result is representative of 3 independent experiments using freshly isolated PBMC-derived Tregs from 3 different donors. (B) Quantitation of nuclear PLA signals in images from panel A (rows 2–7). n = number of cells imaged. ***P < .001, ∗P < .05. Red horizontal bars indicate means ± SEM (1-way analysis of variance + Bonferroni test) from 3 independent experiments. (C) Quantitation of red fluorescent intensities displayed by representative cells shown in panel A. Data are representative of 3 independent experiments. (D) Representative confocal microscopic PLA images of intestinal CD4+ T cells from 3 CD patients showing reduced FOXP3–EZH2 complexes (white signals) in comparison with non-CD control cells. Dotted white lines denote the plasma membrane as seen on differential interference contrast images. Scale bar: 2–5 μm. Simple endoscopic scores for CD patients were as follows: patient 1, 18; patient 2 (on 30 mg of prednisone), 10; and patient 3 (on 8 mg of budesonide 1 time daily), 8. (E) Lamina propria CD4+ T cells from panel D were stained with fluorescently conjugated FOXP3 antibody and subjected to flow cytometric analysis. Histogram overlay compares FOXP3 expression in isolated CD4+ T cells (control vs CD patients 2 and 3). (F) Quantitation of nuclear PLA signals/CD4+ T cells from individual CD patients (patients 1, 2, or 3) vs non-CD CD4+ T cells. n = number of cells imaged. Red horizontal bars denote means ± SEM. ****P < .001; NS, 1-way analysis of variance + Bonferroni test. (G) Quantitation of nuclear PLA signals/CD4+ T cells from all 3 CD patients vs non-CD control as shown in panel F. n = number of cells imaged. ****P < .0001. Red horizontal bars indicate means ± SEM (Student t test). (H) PBMC-derived human Tregs were treated with DMSO, IL6 (50 ng/mL), or IL6 (50 ng/mL) plus 10 μmol/L ruxolitinib (ruxo.) for 2 hours in serum-free media as in panel A, and then permeabilized and stained for FOXP3 or EZH2 with fluorochrome-conjugated antibody or primary antibody, respectively. Dot plots show the frequency, in percentage, of cells expressing FOXP3 (top row: quadrant 7 [Q7]) or EZH2 (bottom row: quadrant 3 [Q3]) as measured by flow cytometric analysis. For negative controls, IgG isotype or fluorescently conjugated secondary antibody were used to stain cells. (I) Histograms depict FOXP3 or EZH2 expression in cells from panel H. Data are representative of 3 independent experiments. DAPI, 4′,6-diamidino-2-phenylindole; FI, fluorescent intensity; SSC, side scatter.
Figure 4
Figure 4
IBD-associated IL6-induced membrane-to-nucleus signaling pathway similarly disrupts FOXP3–EZH2 interaction in a manner reversible by JAK1/2 inhibition. (A) Confocal microscopic PLA images shows endogenous FOXP3–EZH2 interaction (red signals) in the nucleus of CD4+CD25++ cells (Tregs) before (0.2%–0.4% dimethyl sulfoxide [DMSO]), after IL6 (50 or 100 ng/mL, 2×) or after IL6 and JAK1/2 inhibitor ruxolitinib pretreatment (10 μmol/L). CD4+CD25- cells were used as negative controls. Scale bar: 5 μm. Result is representative of 3 independent experiments using freshly isolated PBMC-derived Tregs from 3 different donors. (B) Quantitation of nuclear PLA signals in images from panel A (rows 2–7). n = number of cells imaged. ***P < .001, ∗P < .05. Red horizontal bars indicate means ± SEM (1-way analysis of variance + Bonferroni test) from 3 independent experiments. (C) Quantitation of red fluorescent intensities displayed by representative cells shown in panel A. Data are representative of 3 independent experiments. (D) Representative confocal microscopic PLA images of intestinal CD4+ T cells from 3 CD patients showing reduced FOXP3–EZH2 complexes (white signals) in comparison with non-CD control cells. Dotted white lines denote the plasma membrane as seen on differential interference contrast images. Scale bar: 2–5 μm. Simple endoscopic scores for CD patients were as follows: patient 1, 18; patient 2 (on 30 mg of prednisone), 10; and patient 3 (on 8 mg of budesonide 1 time daily), 8. (E) Lamina propria CD4+ T cells from panel D were stained with fluorescently conjugated FOXP3 antibody and subjected to flow cytometric analysis. Histogram overlay compares FOXP3 expression in isolated CD4+ T cells (control vs CD patients 2 and 3). (F) Quantitation of nuclear PLA signals/CD4+ T cells from individual CD patients (patients 1, 2, or 3) vs non-CD CD4+ T cells. n = number of cells imaged. Red horizontal bars denote means ± SEM. ****P < .001; NS, 1-way analysis of variance + Bonferroni test. (G) Quantitation of nuclear PLA signals/CD4+ T cells from all 3 CD patients vs non-CD control as shown in panel F. n = number of cells imaged. ****P < .0001. Red horizontal bars indicate means ± SEM (Student t test). (H) PBMC-derived human Tregs were treated with DMSO, IL6 (50 ng/mL), or IL6 (50 ng/mL) plus 10 μmol/L ruxolitinib (ruxo.) for 2 hours in serum-free media as in panel A, and then permeabilized and stained for FOXP3 or EZH2 with fluorochrome-conjugated antibody or primary antibody, respectively. Dot plots show the frequency, in percentage, of cells expressing FOXP3 (top row: quadrant 7 [Q7]) or EZH2 (bottom row: quadrant 3 [Q3]) as measured by flow cytometric analysis. For negative controls, IgG isotype or fluorescently conjugated secondary antibody were used to stain cells. (I) Histograms depict FOXP3 or EZH2 expression in cells from panel H. Data are representative of 3 independent experiments. DAPI, 4′,6-diamidino-2-phenylindole; FI, fluorescent intensity; SSC, side scatter.
Figure 5
Figure 5
IL6-induced disruption of FOXP3–EZH2 protein interaction correlates with increased STAT3 activation and FOXP3 tyrosine phosphorylation. (A) HEK293T cells ectopically expressing plasmids encoding His–FOXP3 and myc–EZH2 were treated with IL6 (50 ng/mL) for the indicated duration under reduced-serum conditions. Whole-cell lysates were subjected to immunoprecipitation with IgG or FOXP3 antibody and immunoblotted for His–FOXP3. The same membrane was stripped and reblotted for myc–EZH2. For input, lysates were immunoblotted for His–FOXP3, myc–EZH2, STAT3, and p-STAT3 (Y705) with their corresponding antibodies. (B) Reverse co-immunoprecipitation of experiment in panel A using myc antibody for EZH2. Data are representative of 3 independent experiments. (C) Representative confocal PLA images of human CD4+CD25++ cells (Tregs) shows tyrosine phosphorylated FOXP3 (red) in response to IL6 (50 ng/mL) alone or in combination with ruxolitinib (Ruxo.) (10 μmol/L) for the indicated time points. To detect FOXP3 tyrosine phosphorylation, cells were stained with pan p-Tyr antibody and specific FOXP3 antibody as indicated. Data are representative of 3 independent experiments. Scale bar: 2 µm. (D) Quantitation of nuclear PLA signals in images from panel C. n = number of cells imaged. ***P < .001; NS, non-significant P value. Red horizontal bars indicate means ± SEM (1-way analysis of variance + Bonferroni test) from 3 independent experiments using cells from PBMC donors. (E and F) PBMC-derived human Tregs were treated with IL6 or both IL6 and JAK1/2 inhibitor ruxolitinib for the indicated time points. PLA and confocal microscopic imaging were performed to detect and visualize phosphorylated (p) residues (p-Y705 and p-S727) on STAT3 (red signals) by staining cells with the indicated antibodies. Representative images from 3 independent experiments are shown from 3 different donors. White dotted lines mark the cytoplasm of cells while 4′,6-diamidino-2-phenylindole (DAPI) stains the nuclei blue. Red PLA signals indicate phosphorylated tyrosine residue (Y) 705 on STAT3 in cells stained with both STAT3 and p-STAT3-Y705 antibodies or phosphorylated serine residue (S) 727 on STAT3 in cells stained with both STAT3 and p-STAT3-S727 antibodies. Scale bar: 5 μm. (G and H) Quantitation of nuclear PLA signals from images in panels E and F, respectively. n = number of cells imaged. Red horizontal bars denote means ± SEM. **P < .01 and ***P < .001 (1-way analysis of variance + Bonferroni test) from 3 independent experiments across 3 different donors.
Figure 5
Figure 5
IL6-induced disruption of FOXP3–EZH2 protein interaction correlates with increased STAT3 activation and FOXP3 tyrosine phosphorylation. (A) HEK293T cells ectopically expressing plasmids encoding His–FOXP3 and myc–EZH2 were treated with IL6 (50 ng/mL) for the indicated duration under reduced-serum conditions. Whole-cell lysates were subjected to immunoprecipitation with IgG or FOXP3 antibody and immunoblotted for His–FOXP3. The same membrane was stripped and reblotted for myc–EZH2. For input, lysates were immunoblotted for His–FOXP3, myc–EZH2, STAT3, and p-STAT3 (Y705) with their corresponding antibodies. (B) Reverse co-immunoprecipitation of experiment in panel A using myc antibody for EZH2. Data are representative of 3 independent experiments. (C) Representative confocal PLA images of human CD4+CD25++ cells (Tregs) shows tyrosine phosphorylated FOXP3 (red) in response to IL6 (50 ng/mL) alone or in combination with ruxolitinib (Ruxo.) (10 μmol/L) for the indicated time points. To detect FOXP3 tyrosine phosphorylation, cells were stained with pan p-Tyr antibody and specific FOXP3 antibody as indicated. Data are representative of 3 independent experiments. Scale bar: 2 µm. (D) Quantitation of nuclear PLA signals in images from panel C. n = number of cells imaged. ***P < .001; NS, non-significant P value. Red horizontal bars indicate means ± SEM (1-way analysis of variance + Bonferroni test) from 3 independent experiments using cells from PBMC donors. (E and F) PBMC-derived human Tregs were treated with IL6 or both IL6 and JAK1/2 inhibitor ruxolitinib for the indicated time points. PLA and confocal microscopic imaging were performed to detect and visualize phosphorylated (p) residues (p-Y705 and p-S727) on STAT3 (red signals) by staining cells with the indicated antibodies. Representative images from 3 independent experiments are shown from 3 different donors. White dotted lines mark the cytoplasm of cells while 4′,6-diamidino-2-phenylindole (DAPI) stains the nuclei blue. Red PLA signals indicate phosphorylated tyrosine residue (Y) 705 on STAT3 in cells stained with both STAT3 and p-STAT3-Y705 antibodies or phosphorylated serine residue (S) 727 on STAT3 in cells stained with both STAT3 and p-STAT3-S727 antibodies. Scale bar: 5 μm. (G and H) Quantitation of nuclear PLA signals from images in panels E and F, respectively. n = number of cells imaged. Red horizontal bars denote means ± SEM. **P < .01 and ***P < .001 (1-way analysis of variance + Bonferroni test) from 3 independent experiments across 3 different donors.

References

    1. Cho J.H., Feldman M. Heterogeneity of autoimmune diseases: pathophysiologic insights from genetics and implications for new therapies. Nat Med. 2015;21:730–738. - PMC - PubMed
    1. Cho J.H. The genetics and immunopathogenesis of inflammatory bowel disease. Nat Rev Immunol. 2008;8:458–466. - PubMed
    1. McGovern D.P., Kugathasan S., Cho J.H. Genetics of inflammatory bowel diseases. Gastroenterology. 2015;149:1163–1176.e2. - PMC - PubMed
    1. Hunter C.A., Jones S.A. IL-6 as a keystone cytokine in health and disease. Nat Immunol. 2015;16:448–457. - PubMed
    1. Isaacs K.L., Sartor R.B., Haskill S. Cytokine messenger RNA profiles in inflammatory bowel disease mucosa detected by polymerase chain reaction amplification. Gastroenterology. 1992;103:1587–1595. - PubMed

Publication types

MeSH terms