

Pulmonary Vein Ganglia Are Remodeled in the Diabetic Heart
- PMID: 30511897
- PMCID: PMC6405566
- DOI: 10.1161/JAHA.118.008919
Pulmonary Vein Ganglia Are Remodeled in the Diabetic Heart
Abstract
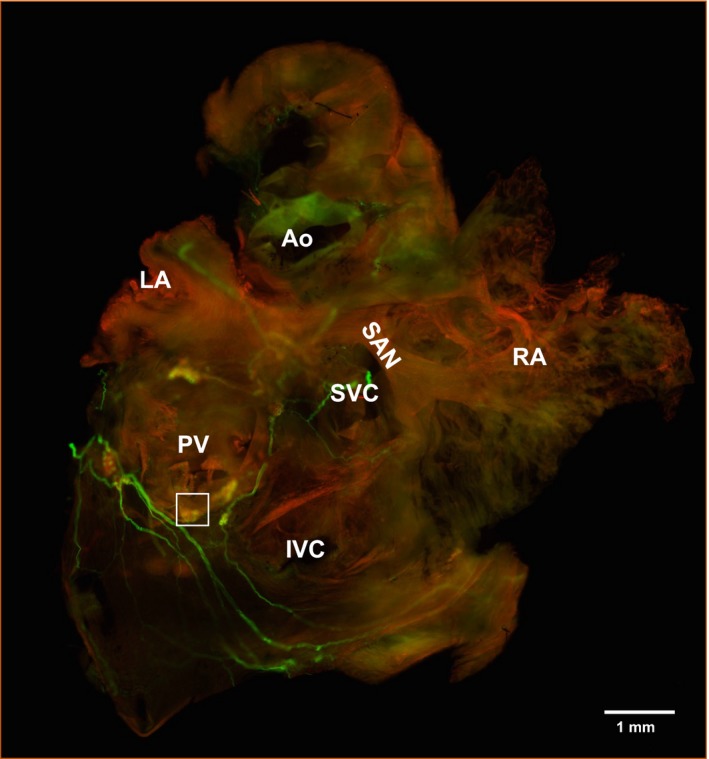
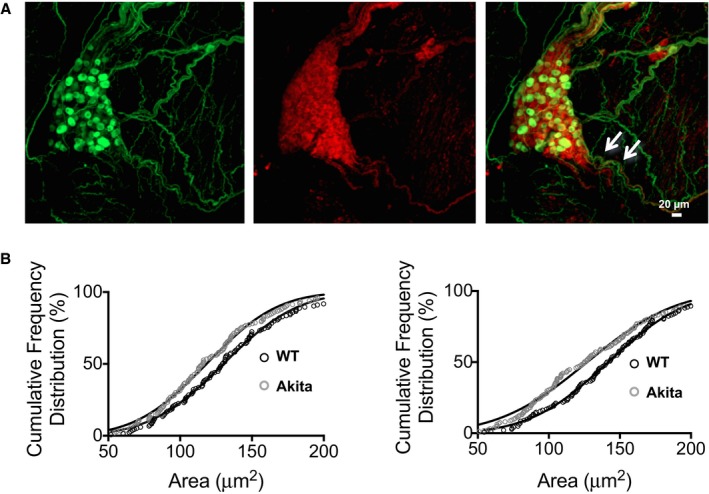
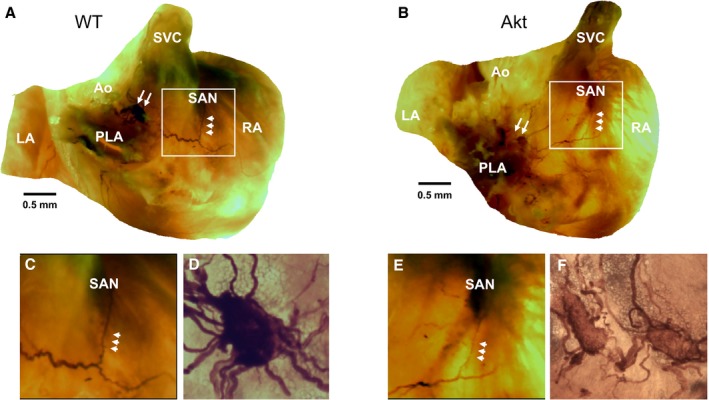
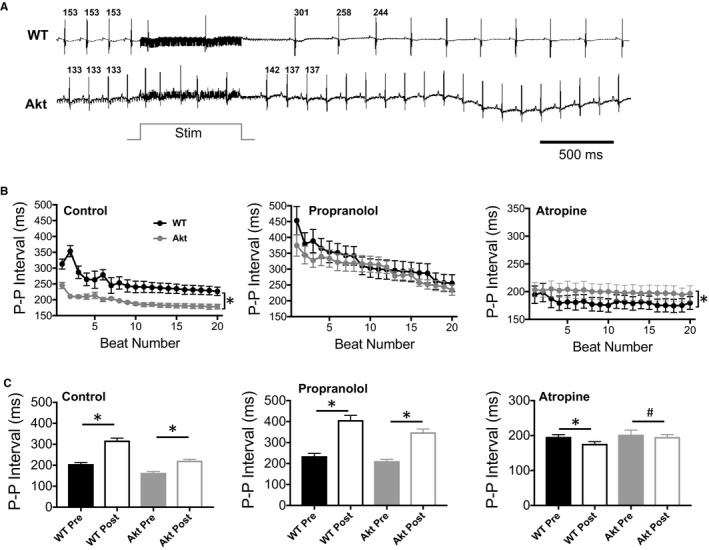
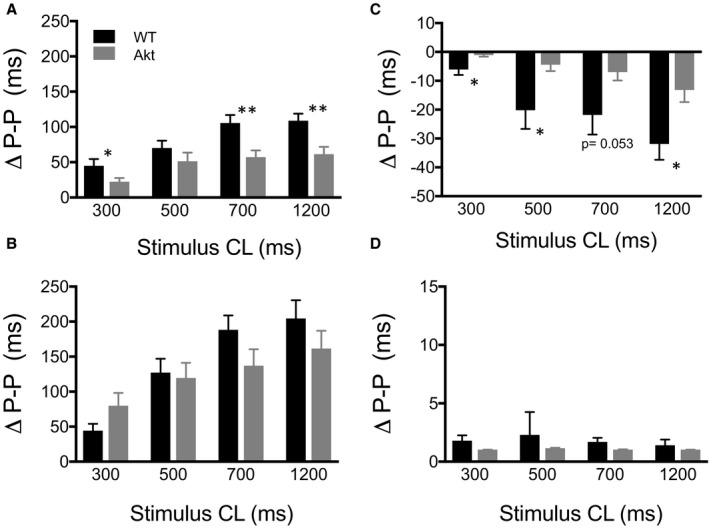
Background Cardiac autonomic neuropathy is thought to cause adverse cardiovascular effects in diabetes mellitus. Pulmonary vein ganglia ( PVG ), which have been implicated in normal and abnormal heart rhythm regulation, have not been fully investigated in type 1 diabetes mellitus (T1D). We examined the functional and anatomical effects of T1D on PVG and studied the details of T1D-induced remodeling on the PVG structure and function. Methods and Results We used a mouse model of T1D (Akita mouse), immunofluorescence, isolated Langendorff-perfused hearts, and mathematical simulations to explore the effects of T1D on PVG . Whole-mount atrial immunofluorescence of choline acetyltransferase and tyrosine hydroxylase labeling showed that sympathetic and parasympathetic somas of the PVG neurons were significantly hypotrophied in T1D hearts versus wild type. Stimulation of PVG in isolated Langendorff-perfused hearts caused more pronounced P-P interval prolongation in wild type compared with Akita hearts. Propranolol resulted in a comparable P-P prolongation in both phenotypes, and atropine led to more pronounced P-P interval shortening in wild type compared with Akita hearts. Numerical modeling using network simulations revealed that a decrease in the sympathetic and parasympathetic activities of PVG in T1D could explain the experimental results. Conclusions T1D leads to PVG remodeling with hypotrophy of sympathetic and parasympathetic cell bodies and a concomitant decrease in the PVG sympathetic and parasympathetic activities.
Keywords: autonomic nervous system; diabetes mellitus; pulmonary vein.
Figures

Similar articles
-
Increased arrhythmia susceptibility in type 2 diabetic mice related to dysregulation of ventricular sympathetic innervation.Am J Physiol Heart Circ Physiol. 2019 Dec 1;317(6):H1328-H1341. doi: 10.1152/ajpheart.00249.2019. Epub 2019 Oct 18. Am J Physiol Heart Circ Physiol. 2019. PMID: 31625779 Free PMC article.
-
Nerves projecting from the intrinsic cardiac ganglia of the pulmonary veins modulate sinoatrial node pacemaker function.Cardiovasc Res. 2013 Aug 1;99(3):566-75. doi: 10.1093/cvr/cvt081. Epub 2013 Apr 3. Cardiovasc Res. 2013. PMID: 23559611 Free PMC article.
-
Role of SREBP-1 in the development of parasympathetic dysfunction in the hearts of type 1 diabetic Akita mice.Circ Res. 2009 Jul 31;105(3):287-94. doi: 10.1161/CIRCRESAHA.109.193995. Epub 2009 May 7. Circ Res. 2009. PMID: 19423844 Free PMC article.
-
[Autonomic heart rhythm regulation and its alteration in myocardial infarction and diabetes mellitus].Medicina (Kaunas). 2010;46(3):219-30. Medicina (Kaunas). 2010. PMID: 20516763 Review. Lithuanian.
-
Glucose Homeostasis and Cardiovascular Alterations in Diabetes.Compr Physiol. 2015 Sep 20;5(4):1815-39. doi: 10.1002/cphy.c150001. Compr Physiol. 2015. PMID: 26426468 Review.
Cited by
-
Increased arrhythmia susceptibility in type 2 diabetic mice related to dysregulation of ventricular sympathetic innervation.Am J Physiol Heart Circ Physiol. 2019 Dec 1;317(6):H1328-H1341. doi: 10.1152/ajpheart.00249.2019. Epub 2019 Oct 18. Am J Physiol Heart Circ Physiol. 2019. PMID: 31625779 Free PMC article.
-
Cardiac digital twins: a tool to investigate the function and treatment of the diabetic heart.Cardiovasc Diabetol. 2025 Jul 18;24(1):293. doi: 10.1186/s12933-025-02839-w. Cardiovasc Diabetol. 2025. PMID: 40682127 Free PMC article. Review.
-
The Intrinsic Cardiac Nervous System: From Pathophysiology to Therapeutic Implications.Biology (Basel). 2024 Feb 7;13(2):105. doi: 10.3390/biology13020105. Biology (Basel). 2024. PMID: 38392323 Free PMC article. Review.
-
Neonatal Scn1b-null mice have sinoatrial node dysfunction, altered atrial structure, and atrial fibrillation.JCI Insight. 2022 May 23;7(10):e152050. doi: 10.1172/jci.insight.152050. JCI Insight. 2022. PMID: 35603785 Free PMC article.
References
-
- Skyler JS, Bakris GL, Bonifacio E, Darsow T, Eckel RH, Groop L, Groop PH, Handelsman Y, Insel RA, Mathieu C, McElvaine AT, Palmer JP, Pugliese A, Schatz DA, Sosenko JM, Wilding JP, Ratner RE. Differentiation of diabetes by pathophysiology, natural history, and prognosis. Diabetes. 2017;66:241–255. - PMC - PubMed
-
- Kempler P, Tesfaye S, Chaturvedi N, Stevens LK, Webb DJ, Eaton S, Kerenyi Z, Tamas G, Ward JD, Fuller JH; Group EICS . Autonomic neuropathy is associated with increased cardiovascular risk factors: the EURODIAB IDDM Complications Study. Diabet Med. 2002; 19:900–909. - PubMed
-
- Chessa M, Butera G, Lanza GA, Bossone E, Delogu A, De Rosa G, Marietti G, Rosti L, Carminati M. Role of heart rate variability in the early diagnosis of diabetic autonomic neuropathy in children. Herz. 2002;27:785–790. - PubMed
-
- Vinik AI, Ziegler D. Diabetic cardiovascular autonomic neuropathy. Circulation. 2007;115:387–397. - PubMed
Publication types
MeSH terms
Grants and funding
LinkOut - more resources
Full Text Sources
Medical
Miscellaneous
