. 2019 Feb 1;129(2):694-711.
doi: 10.1172/JCI120606. Epub 2019 Jan 14.

Peroxisome-derived lipids regulate adipose thermogenesis by mediating cold-induced mitochondrial fission

Affiliations

Peroxisome-derived lipids regulate adipose thermogenesis by mediating cold-induced mitochondrial fission

Hongsuk Park et al. J Clin Invest. .

Abstract

Peroxisomes perform essential functions in lipid metabolism, including fatty acid oxidation and plasmalogen synthesis. Here, we describe a role for peroxisomal lipid metabolism in mitochondrial dynamics in brown and beige adipocytes. Adipose tissue peroxisomal biogenesis was induced in response to cold exposure through activation of the thermogenic coregulator PRDM16. Adipose-specific knockout of the peroxisomal biogenesis factor Pex16 (Pex16-AKO) in mice impaired cold tolerance, decreased energy expenditure, and increased diet-induced obesity. Pex16 deficiency blocked cold-induced mitochondrial fission, decreased mitochondrial copy number, and caused mitochondrial dysfunction. Adipose-specific knockout of the peroxisomal β-oxidation enzyme acyl-CoA oxidase 1 (Acox1-AKO) was not sufficient to affect adiposity, thermogenesis, or mitochondrial copy number, but knockdown of the plasmalogen synthetic enzyme glyceronephosphate O-acyltransferase (GNPAT) recapitulated the effects of Pex16 inactivation on mitochondrial morphology and function. Plasmalogens are present in mitochondria and decreased with Pex16 inactivation. Dietary supplementation with plasmalogens increased mitochondrial copy number, improved mitochondrial function, and rescued thermogenesis in Pex16-AKO mice. These findings support a surprising interaction between peroxisomes and mitochondria regulating mitochondrial dynamics and thermogenesis.

Keywords: Adipose tissue; Cell Biology; Metabolism; Mitochondria.


Conflict of interest statement

Conflict of interest: The authors have declared that no conflict of interest exists.

Figures

Figure 1
Figure 1. PRDM16 regulates cold-induced peroxisomal biogenesis in adipose tissue.
(A) Gene expression analysis in BAT, iWAT, and gWAT of WT mice kept at normal room temperature (RT) (22°C) or subjected to cold (4°C) exposure; n = 3–4. (B) Fluorescence microscopy analysis of COS-7 cells transfected with a GFP reporter under the control of a –2 kb Pex16 promoter alone or together with HA-PRDM16. Original magnification, ×20. (C) Luciferase reporter assay in COS-7 cells; n = 3. (D) BAT SVF cells expressing retrovirally encoded FLAG-PRDM16 were subjected to ChIP assay using an anti-FLAG antibody followed by qPCR using primers to amplify various regions of the Pex16 promoter; n = 6. *P < 0.05; **P < 0.01; ***P < 0.001. (E) Gene expression analysis in iWAT of control and adipose-specific PRDM16-KO (PRDM16-AKO) mice; n = 3. Data are expressed as mean ± SEM and were analyzed by Student’s t test. P < 0.05 versus control RT; #P < 0.05 versus control cold.
Figure 2
Figure 2. Generation of mice with adipose-specific knockout of Pex16.
(A) Gene targeting strategy for Pex16 conditional knockout mice. (B) Analysis of Cre-mediated recombination by PCR. (C) Gene expression analysis; n = 3–6. (D) qPCR analysis demonstrating that Pex16 knockout does not affect gene expression of other peroxisomal genes in BAT; n = 5. (E) Immunofluorescence analysis using anti-PMP70–Atto 488 antibody in BAT of control and Pex16-AKO mice. Original magnification, ×60. (F) Western blot analysis in iWAT. Data in C and D are expressed as mean ± SEM and were analyzed by Student’s t test; ***P < 0.001.
Figure 3
Figure 3. Pex16-AKO mice have increased diet-induced obesity and impaired thermogenesis.
(A) Body weight of mice fed normal chow diet; n = 7–9. (B) Body weight of mice fed an HFD and maintained at 22°C; n = 9–11. (C) Body weight of mice fed an HFD and maintained at 30°C; n = 8. (D) MRI analysis of body composition in mice kept at room temperature after 20 weeks of high-fat feeding; n = 10. (E) Weight of gWAT from HFD-fed mice; n = 3. (F) H&E staining of gWAT from chow- and HFD-fed control and Pex16-AKO mice. The images are representative of 3 mice per genotype. (G) OCR (VO2) before and after intraperitoneal NE injection; n = 3–4. (H) H&E staining of BAT mice kept at room temperature or subjected to cold exposure. The images are representative of 3 mice per genotype. (I) Representative images (n = 3) of BAT from cold-treated mice. Original magnification, F and H, ×10. (J) Quantification of triglycerides (TG) in BAT; n = 3–4. (K) Rectal temperature of mice subjected to a 6-hour cold challenge; n = 7–9. (L) Kaplan-Meier survival curves of mice individually housed in InfraMot (TSE Systems) activity monitors stored at 4°C; n = 7–8. Data are expressed as mean ± SEM. Student’s t test was used for analysis of the data in B, D, E, and J. Two-way ANOVA with Bonferroni’s post hoc test was used for analysis of the data in G and K. To assess statistical significance in L, Mantel-Cox (log-rank) test was used. *P < 0.05; ***P < 0.001.
Figure 4
Figure 4. Pex16 inactivation impairs mitochondrial division and function in brown and beige adipocytes.
(A) TEM analysis of BAT from control and Pex16-AKO mice kept at room temperature or subjected to cold exposure. Peroxisomes (black dots) were detected by staining using DAB. Note the difference in mitochondrial morphology between the genotypes at 4°C. Scale bars: 500 nm. P, peroxisome; M, mitochondria; LD, lipid droplet. (B) Aspect ratio (ratio of major axis length to minor axis length) measured in BAT mitochondria. The data are based on 15 mitochondria per condition. (C) Number of mitochondria per cell based on TEM images of BAT taken at ×1000–×2000 magnification. Data are the average of 8 cells per condition. (D and E) mtDNA copy number normalized to nuclear DNA measured by qPCR in BAT and iWAT; for BAT, n = 6 per genotype at 22°C and 3 per genotype at 4°C; for iWAT, n = 4 per genotype under each condition. (F) Gene expression analysis in BAT of cold-treated mice; n = 4–5. Data are expressed as mean ± SEM and were analyzed by 1-way ANOVA followed by Fisher’s least significant difference (LSD) test (BE) or by Student’s t test (F); *P < 0.05; **P < 0.01; ***P < 0.001.
Figure 5
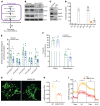
Figure 5. Cell-autonomous effects of Pex16 inactivation on mitochondrial dynamics and function.
(A and B) BAT SVF cells were subjected to brown adipogenesis for 4 days and then treated with scrambled (SC) or Pex16 shRNA and analyzed after an additional 5 days using immunoblotting and mtDNA content measurement by qPCR. n = 3 in B. KD, knockdown. (C) BAT SVF cells stably expressing stably expressing Mito-roGFP were differentiated into adipocytes and then treated with scrambled or Pex16 shRNA in the presence or absence of Mdivi-1 and analyzed 5 days later for mitochondrial morphology using confocal microscopy. Images are representative of 3 separate experiments. Original magnification, ×60. (D) Quantification of mitochondrial morphology of the cells in C. (E) Effect of Pex16 knockdown on OCR measured in BAT SVF cells using a Seahorse XF24 Extracellular Flux Analyzer; n = 5. AA+R, mixture of antimycin A and rotenone. (F and G) Measurement of mitochondrial respiration using an OROBOROS Oxygraph system in permeabilized BAT and iWAT from control and Pex16-AKO mice following sequential additions of octanoyl-l-carnitine (OC); pyruvate (Pyr); glutamate and malate (G+M); adenosine diphosphate and succinate (ADP+S); and FCCP; n = 4–5. Data are expressed as mean ± SEM and were analyzed by Student’s t test; *P < 0.05; **P < 0.01.
Figure 6
Figure 6. Generation and characterization of BAT-specific Pex16-knockout mice.
(A) Analysis of Cre-mediated recombination by PCR. (B) Western blot analysis in BAT, iWAT, and gWAT. (C) Gene expression analysis by qPCR in BAT; n = 4–6. (D) OCR (VO2) measured in control and Pex16-BKO mice using indirect calorimetry before and after intraperitoneal NE injection; n = 4. (E) Rectal temperature of control and Pex16-BKO mice subjected to a 6-hour cold challenge; n = 5–6. (F) qPCR analysis in iWAT of mice subjected to an overnight cold exposure; n = 4–6. Data are expressed as mean ± SEM and were analyzed by Student’s t test (C and F) or 2-way ANOVA with Bonferroni’s post hoc test (D and E). *P < 0.05.
Figure 7
Figure 7. Pex16-AKO mice have impaired FAO, but adipose-specific inhibition of peroxisomal FAO is not sufficient to promote diet-induced obesity or impair thermogenesis.
(A) mRNA levels of FAO genes in BAT of control and Pex16-AKO mice; n = 3–13. (B and C) β-Oxidation of lignoceric acid (C24:0) and palmitic acid (C16:0) in BAT; n = 6–7. (D) Gene targeting strategy using CRISPR/Cas9 to insert loxP sites into the Acox1 locus. The floxed mice were crossed with an adiponectin-Cre mouse to generate Acox1-AKO mice. gRNA, guide RNA; ssODN, single-stranded oligodeoxyribonucleotide. (E) qPCR analysis of FAO and peroxisomal biogenesis genes; n = 3. (F) Western blot analysis of Acox1 knockout in BAT and iWAT. (G) Control and Acox1-KO iWAT SVF cells were incubated with D3-C22:0, whose catabolism to D3-C16:0 was measured mass spectrometrically. FAO was expressed as ratio of D3-C16:0 to D3-C22:0; n = 4. (H) Body weight of control and Acox1-AKO mice fed an HFD and maintained at normal room temperature; n = 13–18. (I) Cold tolerance was determined by measuring rectal temperature at the indicated times after cold exposure; n = 4–5. (J) mtDNA content normalized to nuclear DNA in BAT of control and Acox1-AKO mice subjected to cold exposure; n = 3. Data are expressed as mean ± SEM. Student’s t test was used for analysis of the data in AC, E, G, and J were analyzed by Student’s t test. Two-way ANOVA with Bonferroni’s post hoc test was used for analysis of the data in I. *P < 0.05; **P < 0.01; ***P < 0.001.
Figure 8
Figure 8. Peroxisome-derived lipids are present in mitochondria, and inhibition of their synthesis reduces mtDNA content and impairs mitochondrial function.
(A) Ether lipid synthetic pathway. The initial steps for synthesis of ether lipids, including plasmalogens, take place in peroxisomes, generating 1-O-alkyl-glycerol-3-phosphate (AGP), a precursor for ether-linked analogs of PC and phosphatidylethanolamine. DHAP, dihydroxyacetone phosphate. (B and C) Western blot analysis suggesting that ether lipid synthetic enzymes are degraded in BAT (B) and iWAT (C) of Pex16-AKO mice (D) Targeted lipidomics analysis of mitochondrial phospholipids in BAT of WT C57 mice. PS, phosphatidylserine; PG, phosphatidylglycerol; aPC, alkyl ether PC; pPC, plasmalogen PC; PE, phosphatidylethanolamine; pPE, plasmalogen PE; n = 5. (E) Levels of various plasmalogen PE species in the mitochondrial fraction of BAT; n = 9–10. (F) Total diacyl and plasmalogen PE content in BAT mitochondria. (G) BAT SVF cells stably expressing Mito-roGFP were differentiated into adipocytes and then treated with scrambled or GNPAT shRNA and analyzed 5 days later for mitochondrial morphology using confocal microscopy. Images are representative of 3 separate experiments. Original magnification, ×60. (H) Differentiated BAT SVF cells were treated with scrambled or GNPAT shRNA. Five days later, mtDNA copy number normalized to nuclear DNA was measured by qPCR; n = 5. (I) Effect of shRNA-mediated knockdown of GNPAT on OCR was measured in BAT SVF cells using a Seahorse XF24 Extracellular Flux Analyzer; n = 8. Data are expressed as mean ± SEM and were analyzed by Student’s t test. *P < 0.05.
Figure 9
Figure 9. Dietary supplementation of plasmalogens rescues mitochondrial morphology and function and improves cold tolerance in Pex16-AKO mice.
(A) Mass spectrometric analysis of PE plasmalogens in the mitochondrial fractions from control and Pex16-AKO mice treated with or without AG for 8 weeks; n = 5. (B) TEM analysis of mitochondrial morphology in BAT of control and Pex16-AKO treated with or without AG, followed by cold exposure. Scale bar: 500 nm. (C) Aspect ratio measured in BAT mitochondria from control and Pex16-AKO mice. The data are based on 26 mitochondria per condition. (D) Number of mitochondria per cell based on TEM images of BAT taken at ×1000–×2000 magnification. The data are average of 6–8 cells per condition. (E) mtDNA measured by PCR in BAT of control and Pex16-AKO mice treated with or without AG, followed by cold exposure; n = 6–7. (F) VO2 was measured using indirect calorimetry before and after intraperitoneal NE injection; n = 8–9. (G). Cold tolerance was determined by measuring rectal temperature prior to and after 6 hours of cold exposure; n = 6–8. (H and I) Fatty acid and pyruvate oxidation assays in BAT; n = 3–4. Data are expressed as mean ± SEM and were analyzed by 1-way ANOVA, followed by Fisher’s LSD test (A, CE, and GI), or 2-way ANOVA with Bonferroni’s post hoc test (F); *P < 0.05; **P < 0.01; ***P < 0.001.

References

    1. Ahlabo I, Barnard T. Observations on peroxisomes in brown adipose tissue of the rat. J Histochem Cytochem. 1971;19(11):670–675. doi: 10.1177/19.11.670. - DOI - PubMed
    1. Lodhi IJ, Semenkovich CF. Peroxisomes: a nexus for lipid metabolism and cellular signaling. Cell Metab. 2014;19(3):380–392. doi: 10.1016/j.cmet.2014.01.002. - DOI - PMC - PubMed
    1. Sugiura A, Mattie S, Prudent J, McBride HM. Newly born peroxisomes are a hybrid of mitochondrial and ER-derived pre-peroxisomes. Nature. 2017;542(7640):251–254. doi: 10.1038/nature21375. - DOI - PubMed
    1. Agrawal G, Subramani S. De novo peroxisome biogenesis: evolving concepts and conundrums. Biochim Biophys Acta. 2016;1863(5):892–901. - PMC - PubMed
    1. Braverman NE, et al. Peroxisome biogenesis disorders in the Zellweger spectrum: an overview of current diagnosis, clinical manifestations, and treatment guidelines. Mol Genet Metab. 2016;117(3):313–321. doi: 10.1016/j.ymgme.2015.12.009. - DOI - PMC - PubMed

Publication types

MeSH terms