. 2019 Feb 12;58(6):763-775.
doi: 10.1021/acs.biochem.8b00852. Epub 2019 Jan 14.

Amyloid-like Behavior of Site-Specifically Citrullinated Myelin Oligodendrocyte Protein (MOG) Peptide Fragments inside EBV-Infected B-Cells Influences Their Cytotoxicity and Autoimmunogenicity

Affiliations

Amyloid-like Behavior of Site-Specifically Citrullinated Myelin Oligodendrocyte Protein (MOG) Peptide Fragments inside EBV-Infected B-Cells Influences Their Cytotoxicity and Autoimmunogenicity

Can Araman et al. Biochemistry. .

Abstract

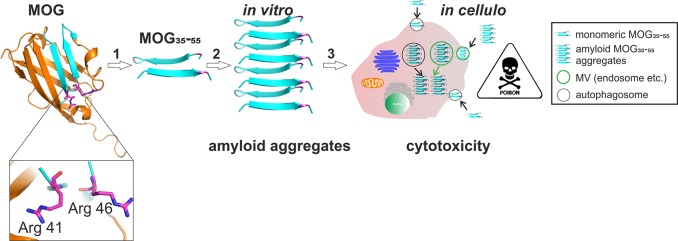
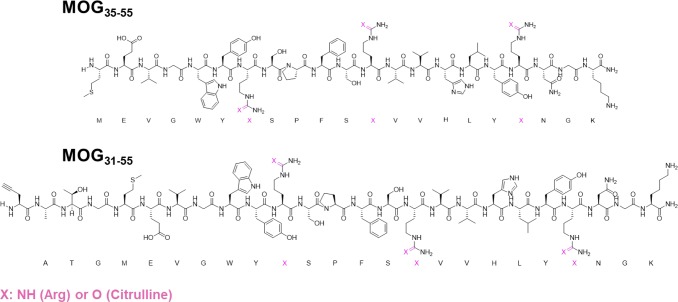
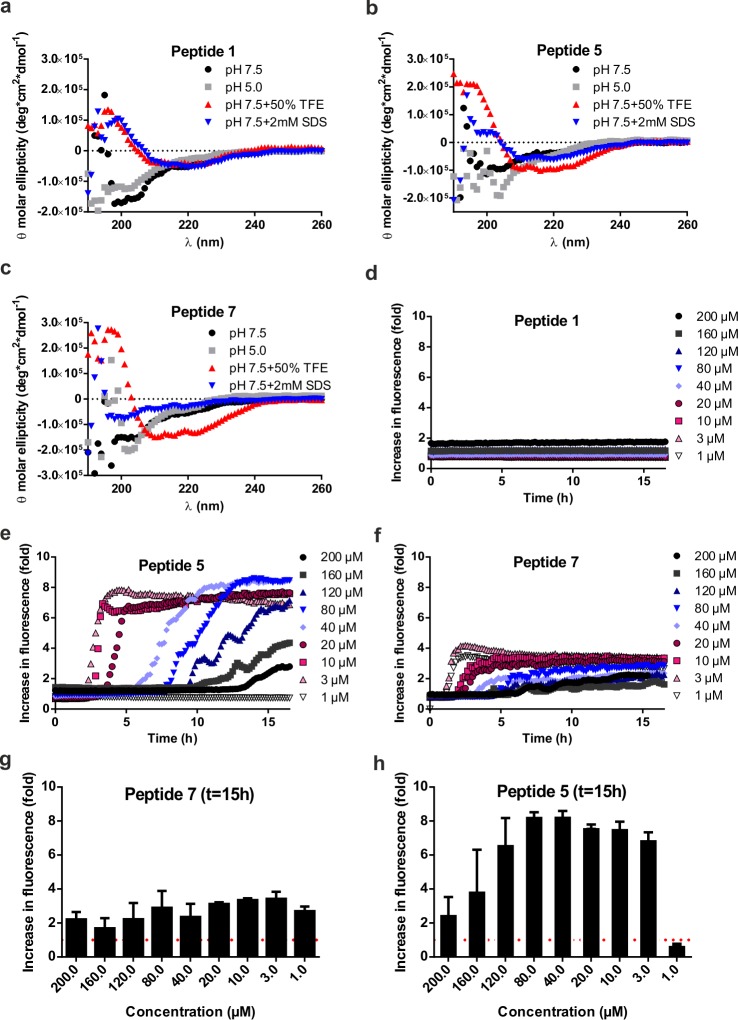
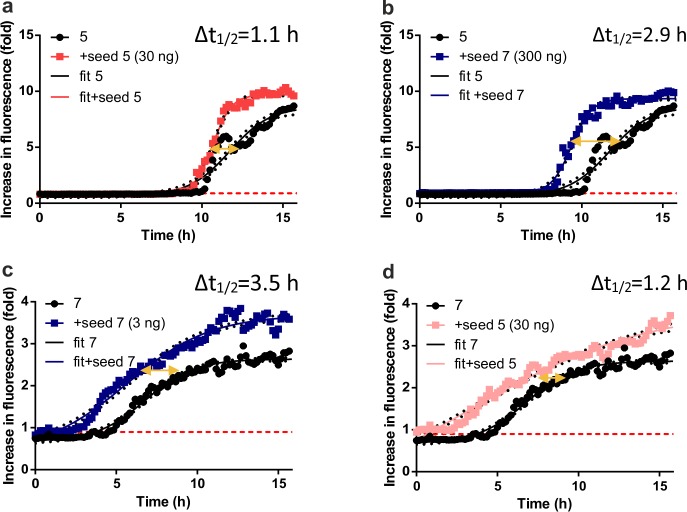
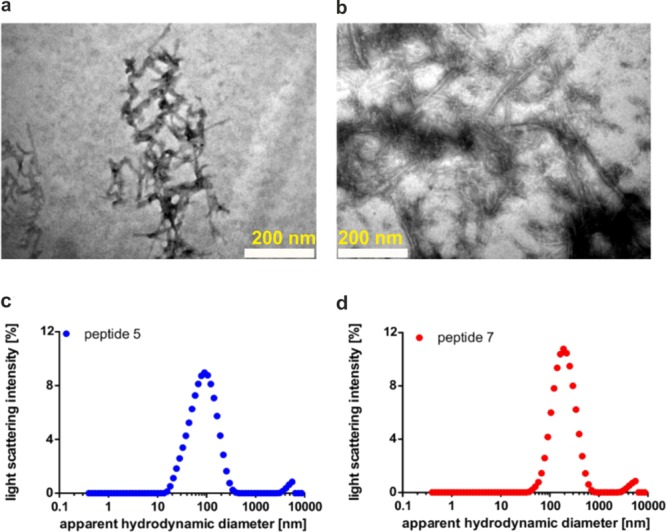
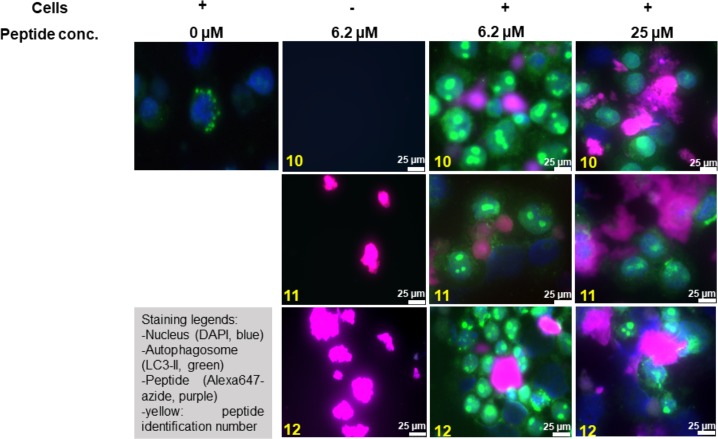
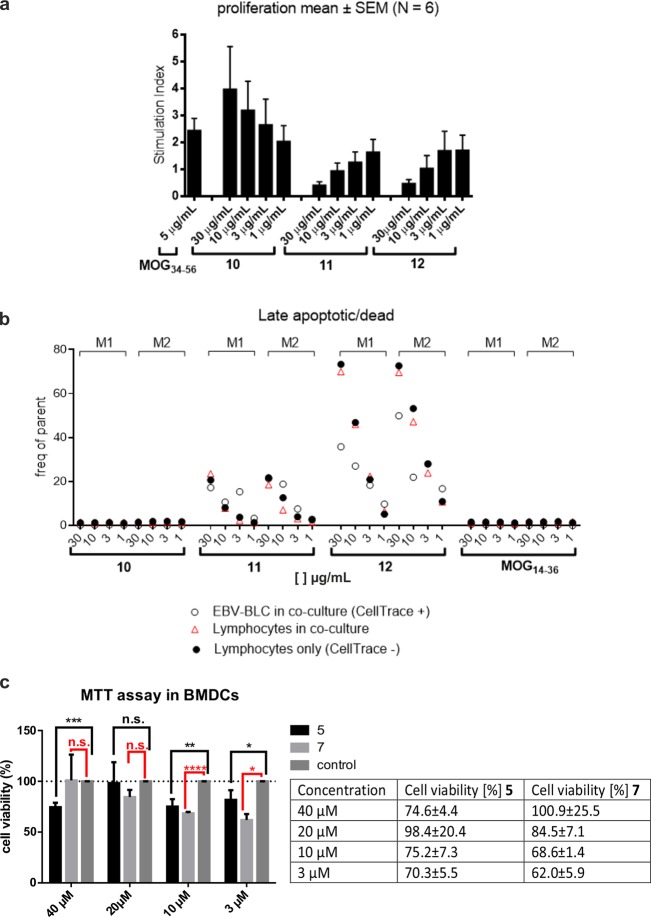
Multiple sclerosis (MS) is an autoimmune disorder manifested via chronic inflammation, demyelination, and neurodegeneration inside the central nervous system. The progressive phase of MS is characterized by neurodegeneration, but unlike classical neurodegenerative diseases, amyloid-like aggregation of self-proteins has not been documented. There is evidence that citrullination protects an immunodominant peptide of human myelin oligodendrocyte glycoprotein (MOG34-56) against destructive processing in Epstein-Barr virus-infected B-lymphocytes (EBV-BLCs) in marmosets and causes exacerbation of ongoing MS-like encephalopathies in mice. Here we collected evidence that citrullination of MOG can also lead to amyloid-like behavior shifting the disease pathogenesis toward neurodegeneration. We observed that an immunodominant MOG peptide, MOG35-55, displays amyloid-like behavior upon site-specific citrullination at positions 41, 46, and/or 52. These amyloid aggregates are shown to be toxic to the EBV-BLCs and to dendritic cells at concentrations favored for antigen presentation, suggesting a role of amyloid-like aggregation in the pathogenesis of progressive MS.


Conflict of interest statement

The authors declare no competing financial interest.

Figures

Figure 1
Figure 1
Strategy and proposed mechanism for amyloid aggregation-driven cytotoxicity of MOG. (1) Crystal structure of rMOG (Protein Data Bank entry 1PKO) with critical arginine residues 41 and 46 (highlighted as Arg 41 and 46, respectively). The image was generated with PyMOL. For our strategy, rMOG is degraded into immunorelevant epitope 35–55 with either none or double Arg → Cit mutations at position 41, 46, or 52. (2) MOG35–55 is subjected to misfolding at acidic pH as can be found in microvesicles (MVs) intracellularly and forms amyloid-like aggregates in vitro. (3) In cellulo mechanism of cytotoxicity. Monomeric MOG35–55 is taken up by the cells via MVs and undergoes amyloid-like aggregation in the acidic environment of MVs, and upon release, amyloid aggregates cause cytotoxicity in certain cell types such as phagocytes.
Scheme 1
Scheme 1. Schematic Representation of MOG-Derived Peptides MOG35–55 and MOG31–55 with Their Amino Acid Sequences and Positions for Arg → Cit Mutations (colored pink)
Figure 2
Figure 2
(a–c) Biophysical characterization and (d–h) ThT aggregation assay for peptides 1, 5, and 7. (a) CD spectrum of 1 at pH 5.0 and 7.5 and with additives (TFE and SDS) at 50 μM. (b) CD spectrum of 5 at pH 5.0 and 7.5 and with additives (TFE and SDS) at 50 μM. (c) CD spectrum of 7 at pH 5.0 and 7.5 and with additives (TFE and SDS) at 50 μM. All spectra were recorded from 190 to 260 nm and reflect an average of at least five independent measurements: (black circles) sample in 20 mM Tris buffer (pH 7.5), (gray squares) sample in 20 mM sodium acetate (NaOAc) buffer, (red triangles) sample treated with 50% (v/v) TFE, and (blue triangles) sample treated with micellar concentrations of SDS (2–4 mM). (d–f) ThT fluorescence spectra of peptides 1, 5, and 7, respectively. All data were recorded at an excitation wavelength of 444 ± 9 nm and an emission wavelength of 485 ± 9 nm. All samples were used at a pH of 5.0 with varying concentrations: (black circles) 200 μM, (gray squares) 160 μM, (dark blue triangles) 120 μM, (light blue triangles) 80 μM, (purple diamonds) 40 μM, (red circles) 20 μM, (red squares) 10 μM, (pink triangles) 3 μM, and (white triangles) 1 μM. The fluorescence change is normalized to 20 mM NaOAc (pH 5) treated with an equal amount of ThT as in the samples. (g and h) ThT fluorescence spectral data (d–f) of peptides 7 and 5 at time point t = 15 h (representing the end point of aggregation kinetics). All aggregation assays were performed at least three times and with experimental triplicates.
Figure 3
Figure 3
Seeded aggregation of peptides 5 and 7. Peptides 1, 5, and 7 were subjected to aggregation in the presence of seeds from either peptide 5 (depicted as “seed 5”) or 7 (depicted as “seed 7”) with different amounts (3, 30, and 300 ng in 200 μL, depicted in corresponding diagrams in brackets). For aggregation-prone peptides 5 (a and b) and 7 (c and d), aggregation curves were fitted according to eq E1 in the Supporting Information (depicted as “fit”) to determine the change in t1/2 as a measure of aggregation kinetics. All data were recorded at an excitation wavelength of 444 ± 9 nm and an emission wavelength of 485 ± 9 nm. All samples were used at a pH of 5.0 and a concentration of 40 μM.
Figure 4
Figure 4
Morphology of amyloid fibrils of 5 and 7. (a) Image of seeds generated from peptide 5 (scale bar, 200 nm). (b) TEM image of seeds generated from peptide 7 (scale bar, 200 nm). (c) Determination of the apparent hydrodynamic diameter (Rhyd) of seeds generated from peptide 5 with dynamic light scattering (DLS). (d) Determination of Rhyd values of seeds generated from peptide 7 with DLS.
Figure 5
Figure 5
Monitoring the uptake and aggregation of bioorthogonal, site-specific citrullinated MOG peptides via confocal microscopy. Human EBV-infected BLCs were incubated for 48 h with either no peptide (0 μM) or 6.2 or 25 μM peptide 10, peptide 11, or peptide 12 (highlighted in yellow). Cells were fixed with 4% PFA and processed for immunofluorescence with the following primary antibodies. The nucleus was stained with DAPI (blue), and LC3 was used as an autophagosome marker (green). The bioorthogonal peptides were stained using CuAAC chemistry with azide Alexa-647 (Thermo Fisher). The scale bar is 25 μm (white bar).
Figure 6
Figure 6
Cytotoxicity of MOG derived peptides (a and b) 10–12 and (c) 5 and 7 in EBV-BLC co-cultures with lymph node cells from EAE marmosets and in mBMDCs. (a) Marmoset EBV-induced BLCs were lethally irradiated and incubated for 1 h with titrating concentrations of peptide 10, 11, or 12 or an irrelevant peptide. Subsequently, lymph node or spleen cells from marmosets immunized with MOG34–56 were added. The responses of T-cells to the peptides were assayed by proliferation and are expressed as the stimulation index per culture condition. The experiment was conducted six times (marmosets) and with three biological replicates. Data are presented as means ± the standard error of the mean. (b) To test which cell type is targeted by the peptides, EBV-BLCs (from two marmosets, M1 and M2) were incubated with CellTrace dye before incubation with peptide (white circles) and a mixture with the spleen/lymph node cells (red triangles). Lymphocytes that are not subjected to co-culturing were used as controls (black circles). Cultured cells were harvested and stained for Annexin V as a marker of late apoptotic/dead cells. The final analysis was done utilizing FACS. (c) Cytotoxicity assays with citrullinated MOG peptides in BMDCs. *p < 0.05, **p < 0.005, ***p < 0.0005, and ****p < 0.00005. n.s., not significant. The experiment was conducted twice and with three biological replicates. Group mean values were analyzed by one-way analysis of variance with the Bonferroni post hoc significant difference test using GraphPad Prism 6.0. Data are represented as means ± the standard deviation.

References

    1. Compston A.; Coles A. (2008) Multiple sclerosis. Lancet 372 (9648), 1502–17. 10.1016/S0140-6736(08)61620-7. - DOI - PubMed
    1. Lublin F. D.; Reingold S. C.; Cohen J. A.; Cutter G. R.; Sørensen P. S.; Thompson A. J.; Wolinsky J. S.; Balcer L. J.; Banwell B.; Barkhof F.; Bebo B.; Calabresi P. A.; Clanet M.; Comi G.; Fox R. J.; Freedman M. S.; Goodman A. D.; Inglese M.; Kappos L.; Kieseier B. C.; Lincoln J. A.; Lubetzki C.; Miller A. E.; Montalban X.; O’Connor P. W.; Petkau J.; Pozzilli C.; Rudick R. A.; Sormani M. P.; Stüve O.; Waubant E.; Polman C. H. (2014) Defining the clinical course of multiple sclerosis. Neurology 83 (3), 278–286. 10.1212/WNL.0000000000000560. - DOI - PMC - PubMed
    1. Ciotti J. R.; Cross A. H. (2018) Disease-Modifying Treatment in Progressive Multiple Sclerosis. Curr. Treat Option. Ne. 20 (5), 12. 10.1007/s11940-018-0496-3. - DOI - PubMed
    1. Olsson T.; Barcellos L. F.; Alfredsson L. (2017) Interactions between genetic, lifestyle and environmental risk factors for multiple sclerosis. Nat. Rev. Neurol. 13, 25. 10.1038/nrneurol.2016.187. - DOI - PubMed
    1. Sumaya C. V.; Myers L.; Ellison G. W. (1976) Epstein-Barr virus antibodies in multiple sclerosis. Trans. Am. Neurol. Assoc. 101, 300. - PubMed

Publication types

MeSH terms