. 2018 Dec 3;47(5):608-628.e6.
doi: 10.1016/j.devcel.2018.11.009.

From Pioneer to Repressor: Bimodal foxd3 Activity Dynamically Remodels Neural Crest Regulatory Landscape In Vivo

Affiliations

From Pioneer to Repressor: Bimodal foxd3 Activity Dynamically Remodels Neural Crest Regulatory Landscape In Vivo

Martyna Lukoseviciute et al. Dev Cell. .

Abstract

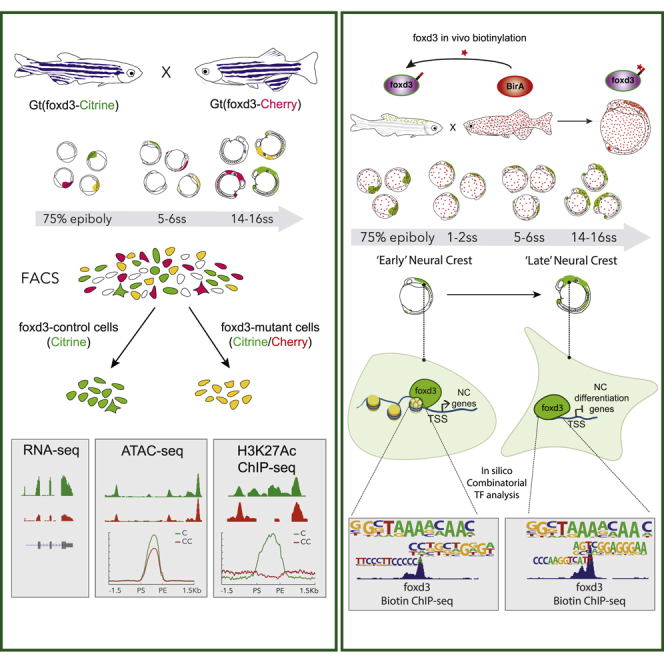
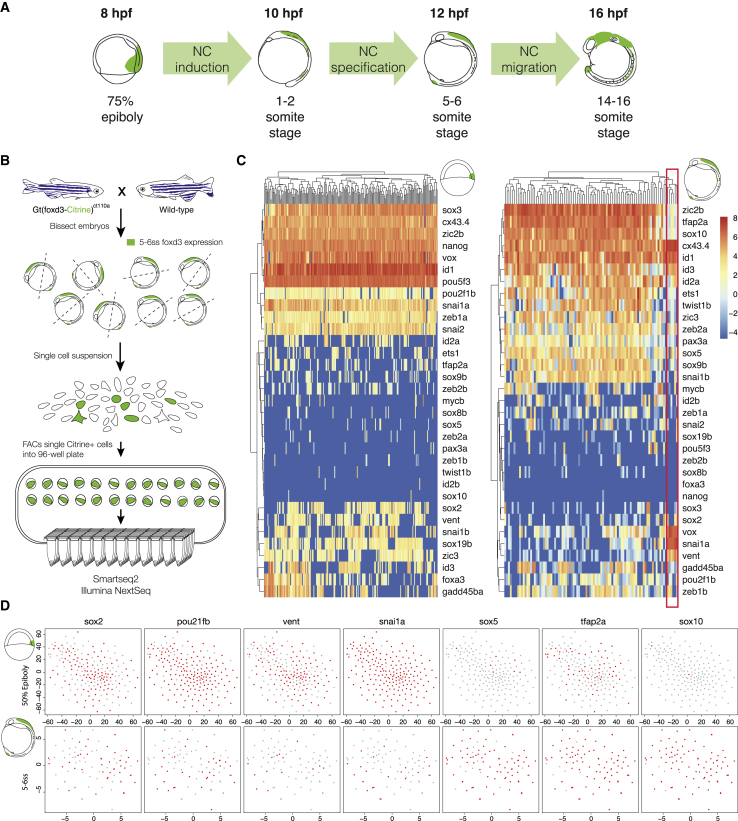
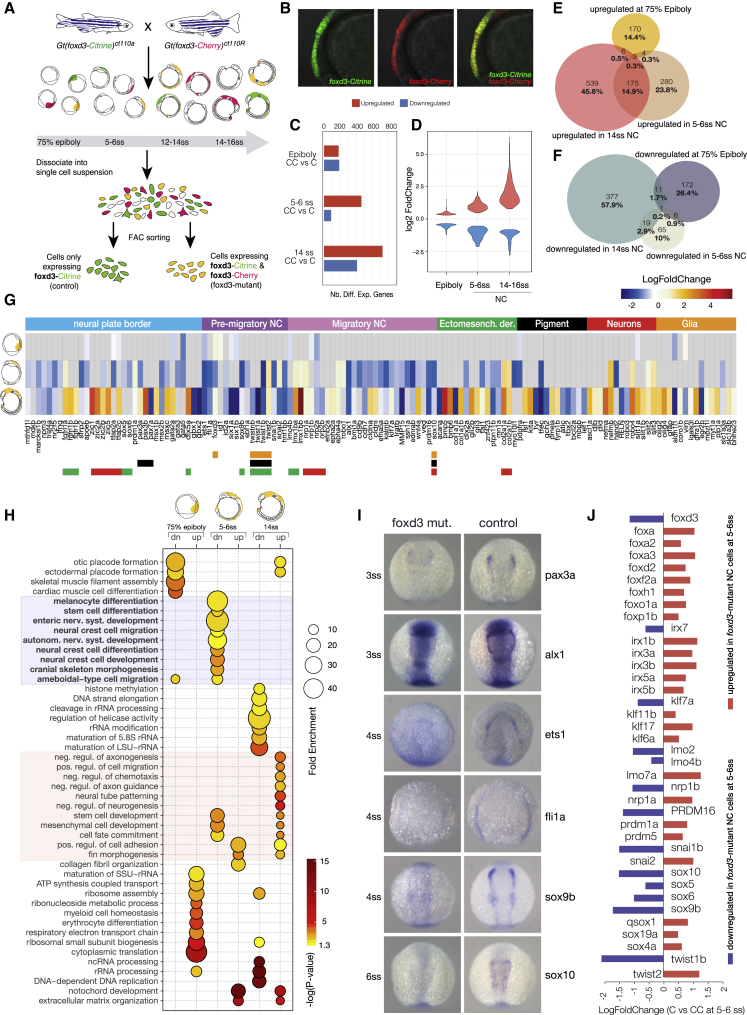
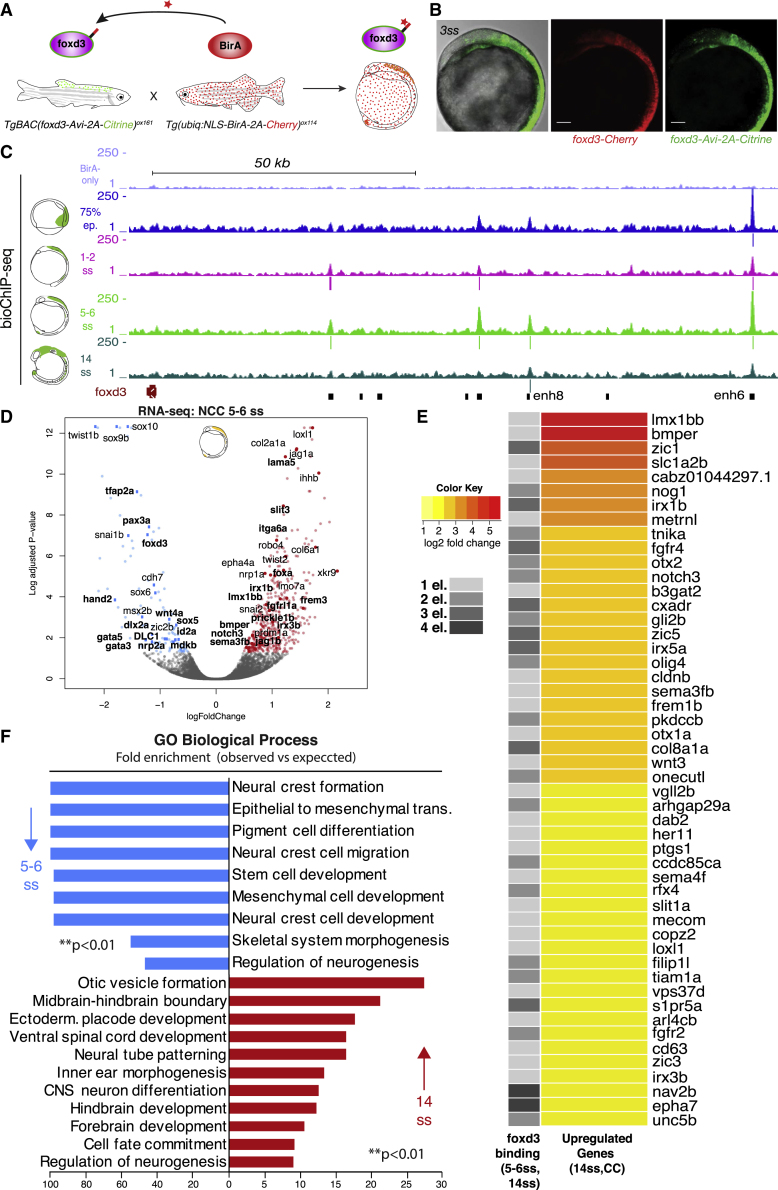
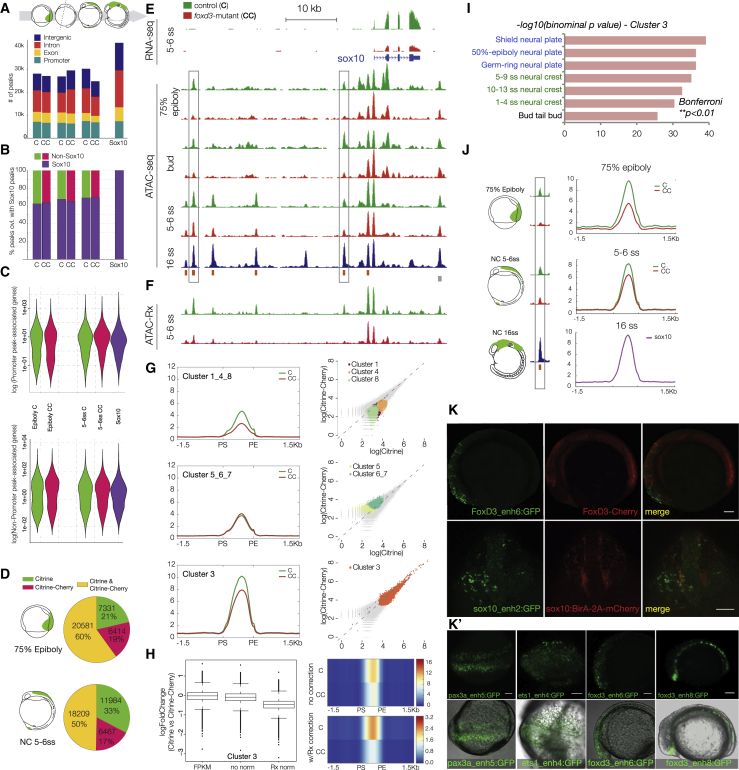
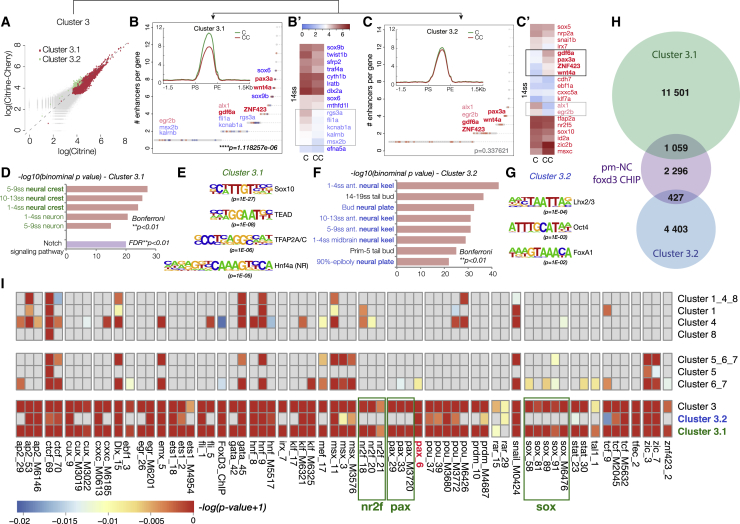
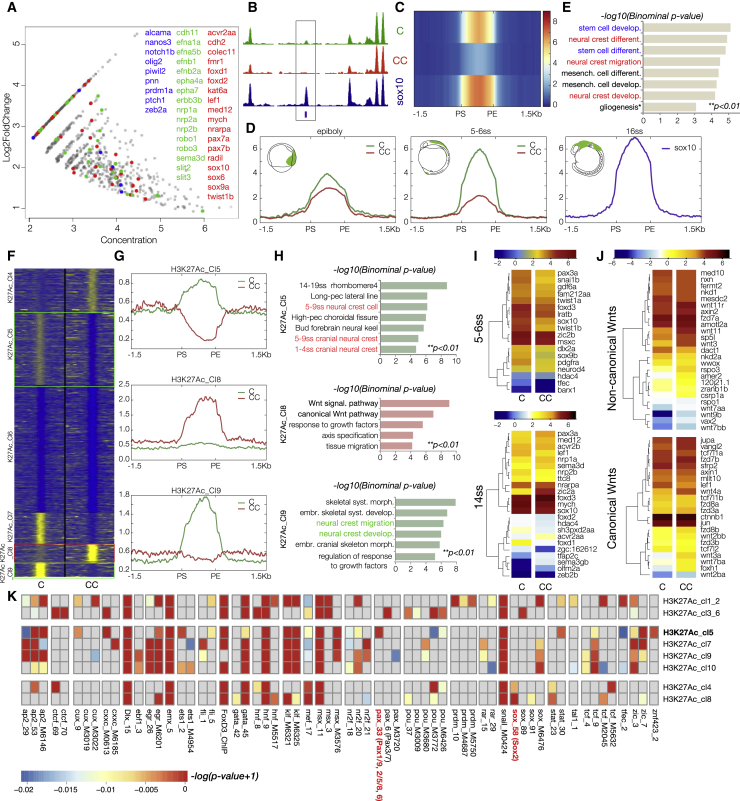
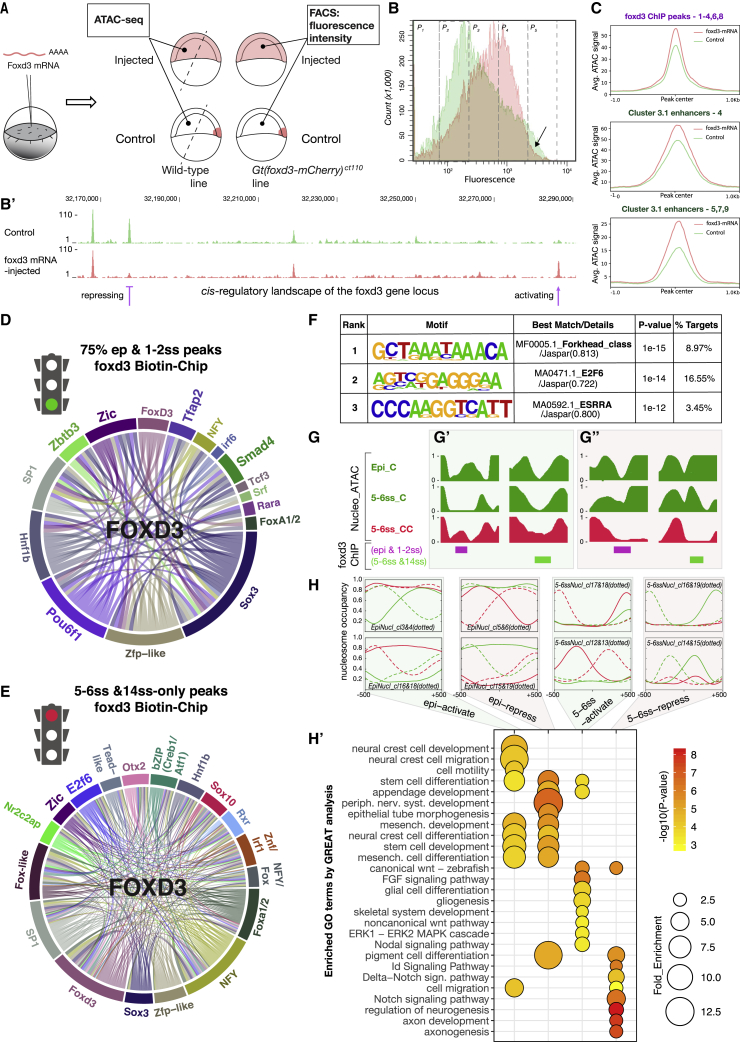
The neural crest (NC) is a transient embryonic stem cell-like population characterized by its multipotency and broad developmental potential. Here, we perform NC-specific transcriptional and epigenomic profiling of foxd3-mutant cells in vivo to define the gene regulatory circuits controlling NC specification. Together with global binding analysis obtained by foxd3 biotin-ChIP and single cell profiles of foxd3-expressing premigratory NC, our analysis shows that, during early steps of NC formation, foxd3 acts globally as a pioneer factor to prime the onset of genes regulating NC specification and migration by re-arranging the chromatin landscape, opening cis-regulatory elements and reshuffling nucleosomes. Strikingly, foxd3 then gradually switches from an activator to its well-described role as a transcriptional repressor and potentially uses differential partners for each role. Taken together, these results demonstrate that foxd3 acts bimodally in the neural crest as a switch from "permissive" to "repressive" nucleosome and chromatin organization to maintain multipotency and define cell fates.

Keywords: chromatin dynamics; enhancer; foxd3; gene regulatory network; neural crest; pioneer factor; repressor; stem cells.


Figures

None
Graphical abstract
Figure 1
Figure 1
Transcriptome Characterization of foxd3-Expressing NC (A) Zebrafish embryo stages examined in this study (hpf – hours post fertilization). 75% epiboly—a gastrulation stage during which embryonic shield and hypoblast are formed. 1–2 and 5–6 somite stages—induced and specified premigratory neural crest (NC), respectively. 14–16ss – migratory NC. Foxd3 expression is labeled in green. (B) Experimental pipeline for obtaining foxd3-expressing cells and performing single-cell RNA-seq (scRNA-seq). The genetrap zebrafish line, Gt(foxd3-citrine)ct110, expressing foxd3-Citrine fusion is outcrossed to wild-type resulting in fluorescent signal in endogenous foxd3+ cells, enabling their isolation by FACS. 5–6ss Citrine-positive NC cells are collected into individual wells of the 96-well plate and processed for smartseq2-based scRNA-seq. Total of 94 cells was sorted with two empty, External RNA Controls Consortium (ERCC)-only wells left as controls. (C) Heatmaps illustrating the hierarchical clustering of foxd3+ single cells at 75% epiboly (200 cells) and 5–6ss (93 cells) and showing transcriptional levels (depicted in Log2 RPKM) of selected NC and stem cell genes. NC cells that express negligent levels of bona fide NC specifiers (zic2b, tfap2a, sox10, twist1b, ets1, or pax3a) but high levels of lratb, cxcr4b, and ved, as well as other markers of stemness (snai1a, vent, vox, and cx43.4), possibly representing pluripotent non-specified NC progenitors maintained in premigratory NC (boxed and labeled in red). (D) tSNE plots for selected stem cell (sox2, pou2f1, vent) and NC genes (snai1a, sox5, tfap2a, sox10) indicate individual epiblast, and NC cells do not reveal cell subpopulations. Clustering of 5–6ss NC cells identifies a small group of cells that appear to be pluripotent non-specified NC progenitors. See Figure S1 for scRNA-seq quality control (QC) and more details.
Figure 2
Figure 2
Transcriptional Profiling of foxd3 Mutant NC (A) Experimental strategy for obtaining foxd3-mutant (yellow) and foxd3-control (green) NC cells. Mutant (Citrine/Cherry; CC) and control (Citrine only; C) NC cells were isolated by FACS from crosses of heterozygote fluorescent foxd3 transgenic fish, foxd3-mCherry and foxd3-Citrine at three stages—75% epiboly, 5–6ss, and 14ss. (B) Lateral view of a foxd3-mutant embryo expressing both Citrine and mCherry instead of foxd3 in premigratory NC. (C and D) (C) Bar plot comparing numbers of differentially expressed genes in foxd3-mutant and control NC and (D) violin plots comparing fold-change differences. (E and F) Venn diagrams comparing upregulated (E) and downregulated (F) genes in foxd3-mutant cells. (G) Heatmap showing fold change in expression of known NC genes between foxd3-mutant and control cells at 75% epiboly, 5–6ss, and 14ss. Genes are grouped to reflect NC-GRN structure. (H) Bubble plot summarizing enrichment and ps (Benjamini-Hochberg corrected) for the most significant biological process GO terms associated to differentially expressed genes. (I) In situ hybridization of 3–6ss zebrafish embryos (dorsal view) showing decrease or loss in expression of NC specifier genes in foxd3-mutants. (J) Bar plot representing fold change in expression of NC factors showing that paralogs are differentially regulated by foxd3.
Figure 3
Figure 3
Biotin-ChIP Analysis Supports a Direct Bi-modal foxd3 Regulatory Action on NC Gene Expression (A) Experimental strategy for biotagging foxd3 protein in vivo. Zebrafish transgenics expressing Avi-tagged foxd3 and ubiquitous NLS-BirA are crossed to obtain embryos expressing biotinylated foxd3 for use in biotin ChIP-seq. (B) Lateral view of the embryo issued from crosses of TgBAC(foxd3-Avi-2A-Citrine)ox161 and Gt(foxd3-mCherry)ct110R shows overlap of Citrine and Cherry reporters. Scale bars correspond to 100 μm. (C) Genome browser screenshot showing mapped foxd3-biotin-ChIP-seq at 75% epiboly (in blue), 1–2ss (in pink), 5–6ss (in light green) and 14ss (in dark green) developmental zebrafish stages within the foxd3 regulatory locus. BirA-only ChIP-seq control at 5–6ss is shown in purple (top track). Positions of called peaks are indicated as vertical lines underneath each biotin-foxd3 ChIP track. The bottom track black boxes display identified cis-regulatory elements of the foxd3 gene. (D) Volcano plot highlighting that most NC specifiers are downregulated in foxd3-mutant NC at 5–6ss. On the left side (downregulated genes), genes directly bound by foxd3 at 1–2ss are marked in bold. On the right side (upregulated genes), genes that are still upregulated at 14ss and are directly bound by foxd3 at 5–6ss and 14ss are marked in bold. (E) Heatmap displaying top 50 most upregulated genes, based on log2-fold change of differential gene expression, out of total 223 genes, at 14ss in foxd3 mutant (CC) NC that were found to be occupied by foxd3 at 1, 2, 3, or 4 associated cis-regulatory elements at 5–6ss and 14ss. (F) Bar plot showing GO terms significantly enriched (∗∗p < 0.01) to downregulated genes at 5–6ss in blue and upregulated genes at 14ss in red in foxd3-mutant embryos that were bound by foxd3 at 1–2ss and at 5–6ss/14ss, respectively.
Figure 4
Figure 4
Epigenomic Profiling of Chromatin Accessibility in foxd3 Mutant NC across Developmental Time (A and B) (A) Stacked bar plots depicting genomic annotation of ATAC-seq peaks across stages analyzed (75% epiboly; bud stage; 5–6ss and 14–16ss) and (B) quantification of open elements at earlier stages as a proportion of accessible elements detected in migrating/differentiating NC. (C) Violin plots correlating putative promoter and cis-regulatory elements with gene expression levels. Bimodal distribution of gene expression is associated with putative enhancers at all stages, but with promoters only at epiboly. (D) Pie charts comparing Citrine-only, Cherry-only, and Citrine/Cherry peak number proportions of ATAC-peaks. (E) Genome browser screenshot showing RNA-seq and ATAC-seq profiles in foxd3 mutant (red) and foxd3-control cells (green) within sox10 locus. (F) Tracks showing normalized ATAC-Rx profiles obtained using reference exogenous Drosophila epigenome. (G) Mean density maps of merged profiles and corresponding scatterplots of raw counts for k-means clusters featuring elements with differential accessibility and signal levels in foxd3-mutant and controls at 5–6ss. (H) Boxplots and heatmap (raw read counts) showing fold change in accessibility and comparing ATAC signal levels between control (C) and mutants (CC) k-cluster 3 elements with and without Rx normalization. (I) Bar chart depicting functional annotation of k-cluster 3 shows enrichment in zebrafish gene expression ontology terms linked to NC and neural plate development (Bonferroni; ∗∗p < 0.01). For further analysis of k-cluster, see Figure S4. (J) Merged profiles for 3,565 elements open at 75% epiboly showed more prominent accessibility defect than at 5–6ss (C ≫ CC, > 50%), suggesting biological compensation over time. (K and K′) Cis-regulatory elements from k-cluster 3 show NC-specific reporter activity. (K) Lateral and frontal view of embryos injected with foxd3-enh6 and sox10-enh2 GFP reporter constructs into the genetic background of foxd3-Cherry and sox10:BirA-2A-Cherry, respectively. Scale bars correspond to 100 μm. (K′) Fluorescent and bright-field overlay images of pax3a and ets1 (dorsal view) and foxd3 (lateral view) enhancers. Scale bars correspond to 100 μm.
Figure 5
Figure 5
Characterization of Hotspot Enhancers (A) Scatterplot showing subclustering of k-cluster 3, one containing elements of lower accessibility in foxd3 mutants (k-cluster 3.1; 12,366 el.; RCl3.1 = 0.77) (B) and the other elements with no change in chromatin accessibility (k-cluster 3.2; 4,754 el.; RCl3.2 = 0.97) (C). (B and C) Plots representing genes assigned to k-cluster 3.1 (B) and k-cluster 3.2 (C) ranked by the number of associated elements. (B′ and C′) Heatmaps showing later expression (14ss) of NC genes depleted in 5–6ss mutant NC. Genes controlled solely by 3.1 elements (in blue) are shown in (B′) and those harboring both 3.1 and 3.2 elements (in red) are depicted in (C′). Genes that remain downregulated at 14ss are labeled in light color print, and those overexpressed are shown in bold. (D and F) Functional annotation by GREAT associates k-cluster 3.1 with neural crest specification or neuronal differentiation (D) and k-cluster 3.2 with neural plate/tube development (F) (Bonferroni; ∗∗p < 0.01). (E and G) Top transcription factor binding site (TFBS) motifs enriched in 3.1 (E) and 3.2 (G) elements. (H) Venn diagrams showing a number of elements from k-clusters 3.1 (in green) and 3.2 (in blue) that are directly bound by foxd3 at premigratory NC (pm-NC) stages (in purple: 75% epiboly, 1–2ss, and 5–6ss ChIP-seq peaks). (I) Comprehensive TF binding motif map representing significantly enriched TFBS for TF expressed at 5–6ss across different k-clusters.
Figure 6
Figure 6
Differential ATAC-Seq Analysis and Clustering of Enhancers Based on H3K27Ac Profiles (A) Annotated MA plot depicting late opening enhancers significant by DiffBind analysis (p < 0.05, FDR<0.1) of the ATAC-seq signal at 5–6ss with annotated associated genes (stem cell genes, blue; cell adhesion/migration cues, green; NC specification and differentiation, red). (B) Genome browser screenshot exemplifying the type of element isolated by DiffBind (boxed). (C and D) (C) Heatmap (raw read counts) of all elements and (D) collapsed merged profiles indicating that identified elements are closed at epiboly and only start to open at 5–6ss. (E) Functional annotation of DiffBind-identified enhancers shows association with later roles in NC (∗∗p < 0.01). (F–H) (F) Heatmap depicting k-means linear enrichment clustering of H3K27Ac signal across non-promoter ATAC-seq peaks in foxd3-mutant (CC, Citrine/Cherry) and control (C, Citrine) at 5–6ss, (G) associated mean merged profiles for selected clusters, and (H) corresponding ontology enrichment bar plots indicating functional role of selected clusters. (I) Heatmaps showing expression of NC specification genes (log FPKM) associated with K27Ac_Cl5 at 5–6ss and NC migration/differentiation genes associated with K27Ac_Cl9 at 14ss in foxd3-mutant (CC) and control cells (C). (J) Heatmap depicting expression at 14ss of canonical and non-canonical Wnt pathway molecules (in log FPKM) associated with K27Ac_Cl8 that displays an increase in enhancer K27 acetylation in mutants. (K) TF binding motif map representing significantly enriched TFBS for TF expressed at 5–6ss across different K27Ac-clusters. See Figure S5 for other K27Ac clusters and corresponding ontology enrichment bar plots.
Figure 7
Figure 7
Putative Mechanisms of the Bimodal foxd3-Mediated NC Gene Regulation (A) Experimental strategy for foxd3 overexpression in vivo. Gt(foxd3-mCherry)ct110 heterozygous embryos were used for FACS and wild-type embryos for ATAC-seq experiments at 50% epiboly stages. For ATAC-seq, embryos were dissected (dashed lines) to only collect “foxd3-naive” cells that do not normally express foxd3. Native and ectopic foxd3 expression is illustrated in dark pink and lighter pink, respectively. (B) FACS graph portraying a number of foxd3-mCherry expressing cells and underlying fluorescence intensities from control (green) and foxd3 mRNA injected (pink) embryos. P1–P5 – compartments of different fluorescence levels from the lowest to the highest. Black arrow indicates a loss of highest intensity fluorescence in foxd3 mRNA injected embryos versus control. (B′) Genome browser screenshot depicting region ∼60 kb upstream from the foxd3 transcription start site (TSS). Green and pink ATAC-seq tracks represent genome accessibility from control and foxd3 overexpressing embryonic cells. Purple arrows indicate either relative loss or acquisition of chromatin accessibility upon foxd3 overexpression. (C) Mean density maps of merged profiles for k-means clusters featuring elements with differential accessibility between the foxd3 mRNA injected (in pink) and control (in green) 50% epiboly-staged embryos using either foxd3 binding maps or k-cluster 3.1 elements as a reference. (D) Circle plot showing statistically significant TF motif co-occurrences on the “early NC” foxd3-bound activating elements. (E) Circle plot showing different statistically significant TF motif co-occurrences on the “late NC” foxd3-bound elements, underlying repressive activity. (F) De novo TF binding motifs enriched within foxd3-bound elements associated with NC genes negatively regulated by foxd3 at 14ss. (G) Nucleosomal occupancy profiles expressed as relative NucleoATAC normalized cross-correlation signals. Profiles show changes in nucleosome positioning within the regulatory elements in control (C; green) and foxd3-mutant (CC; red) cells. Direct foxd3 binding at either early (epiboly, 1–2ss in magenta) or late stage (5–6ss, 14ss in green) results in either nucleosome clearing (G′; permissive role) or nucleosome compaction (G″; repressive role). Both processes are altered and nucleosomal patterns inverted in foxd3-mutant NC (G′ and G″). (H) Mean density maps of merged profiles of nucleosomal clusters obtained by k-means analysis showing differential nucleosomal patterns between foxd3-mutants (CC; red) and controls (C; green). Both nucleosome-loose clusters of elements with activating patterns (epi-activate and 5–6ss-activate) and nucleosome-compact clusters with repressive patterns (epi-repress and 5–6ss-repress) are identified. (H′) Bubble chart depicting functional annotation of different nucleosomal clusters by GREAT (Bonferroni; p < 0.01). Only elements directly bound by foxd3 are analyzed.

References

    1. Adam R.C., Yang H., Rockowitz S., Larsen S.B., Nikolova M., Oristian D.S., Polak L., Kadaja M., Asare A., Zheng D. Pioneer factors govern super-enhancer dynamics in stem cell plasticity and lineage choice. Nature. 2015;521:366–370. - PMC - PubMed
    1. Adkins N.L., Hagerman T.A., Georgel P. Gaga protein: a multi-faceted transcription factor. Biochem. Cell Biol. 2006;84:559–567. - PubMed
    1. Adli M., Bernstein B.E. Whole-genome chromatin profiling from limited numbers of cells using nano-ChIP-seq. Nat. Protoc. 2011;6:1656–1668. - PMC - PubMed
    1. Attwooll C., Oddi S., Cartwright P., Prosperini E., Agger K., Steensgaard P., Wagener C., Sardet C., Moroni M.C., Helin K. A novel repressive E2F6 complex containing the polycomb group protein, EPC1, that interacts with EZH2 in a proliferation-specific manner. J. Biol. Chem. 2005;280:1199–1208. - PubMed
    1. Baggiolini A., Varum S., Mateos J.M., Bettosini D., John N., Bonalli M., Ziegler U., Dimou L., Clevers H., Furrer R. Premigratory and migratory neural crest cells are multipotent in vivo. Cell Stem Cell. 2015;16:314–322. - PubMed

Publication types

MeSH terms

Substances