. 2018 Nov 30;23(12):3165.
doi: 10.3390/molecules23123165.

Photo-Induced Depletion of Binding Sites in DNA-PAINT Microscopy

Affiliations

Photo-Induced Depletion of Binding Sites in DNA-PAINT Microscopy

Philipp Blumhardt et al. Molecules. .

Abstract

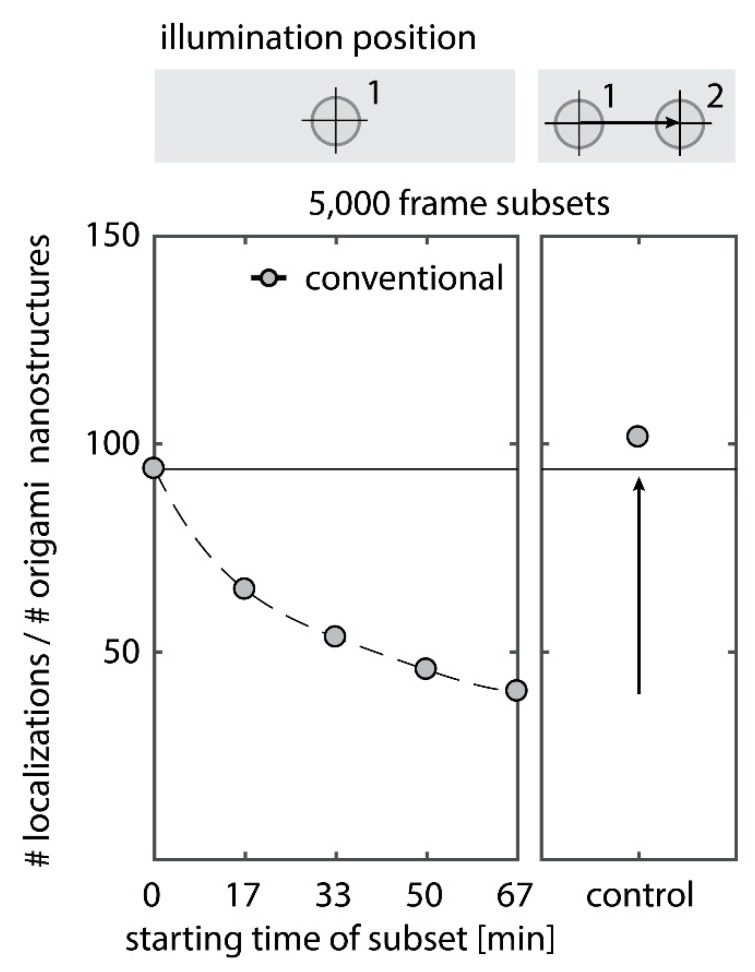
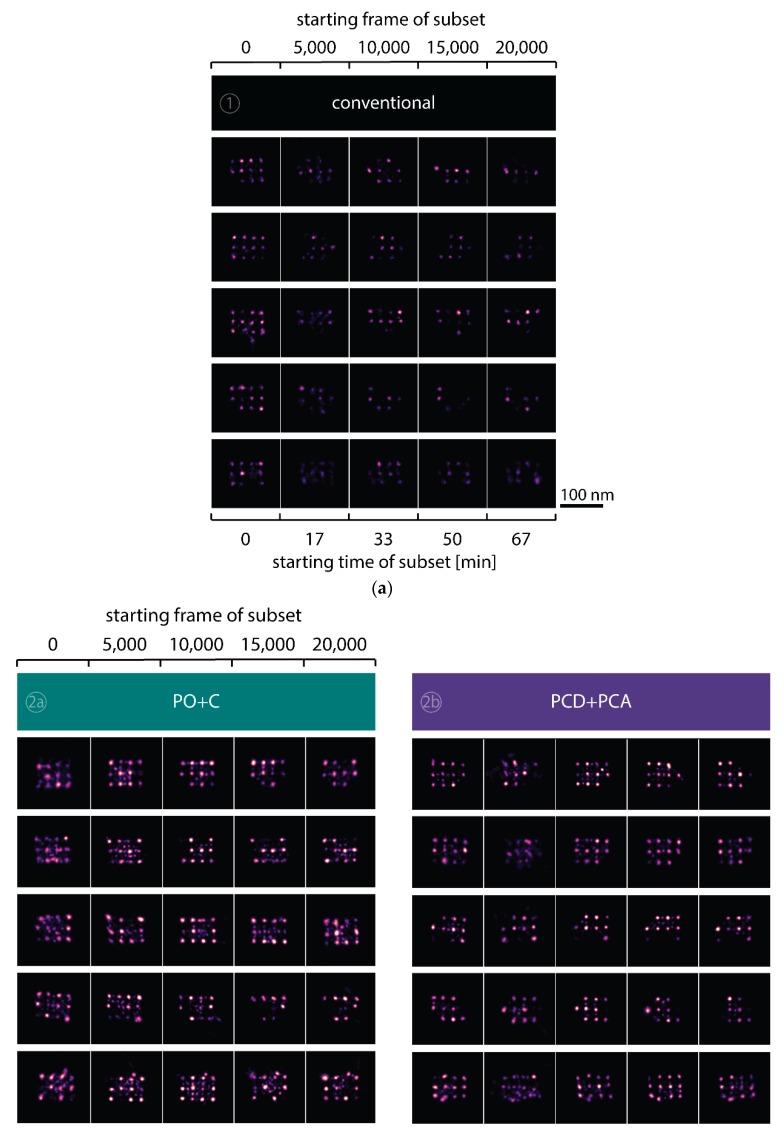
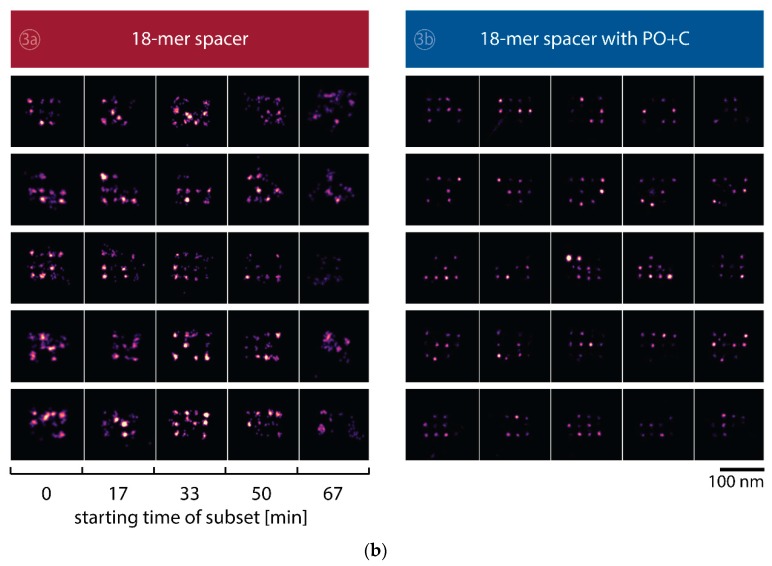
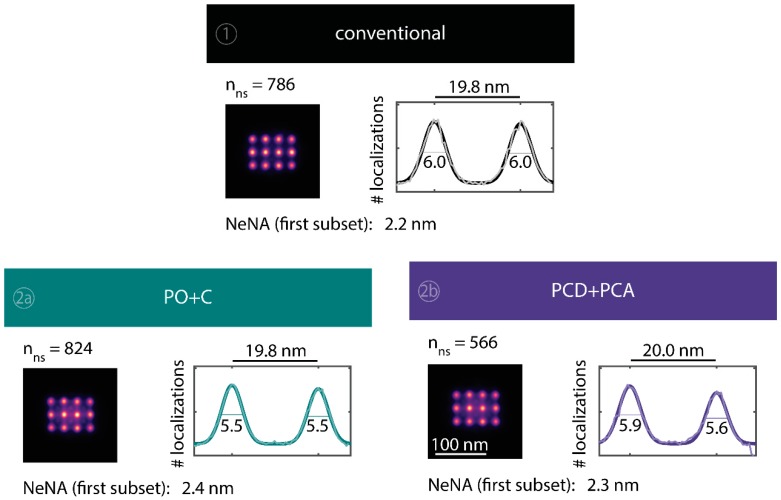
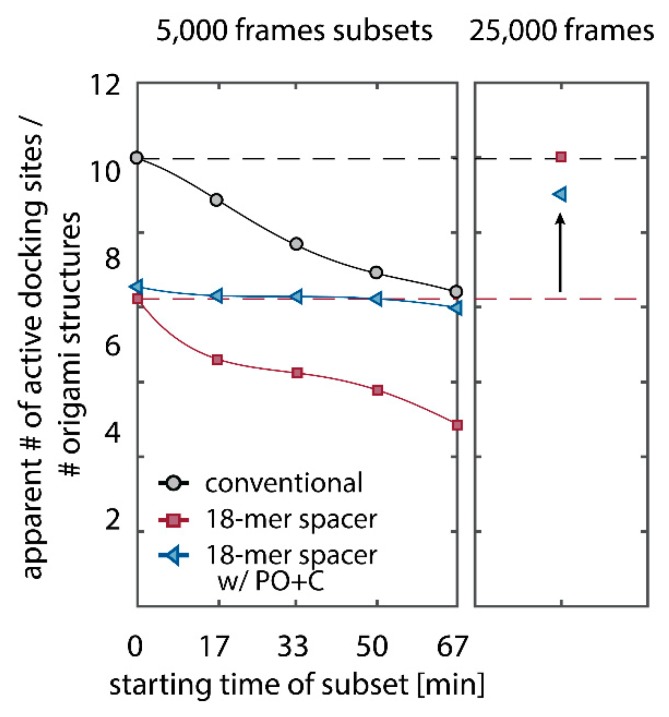
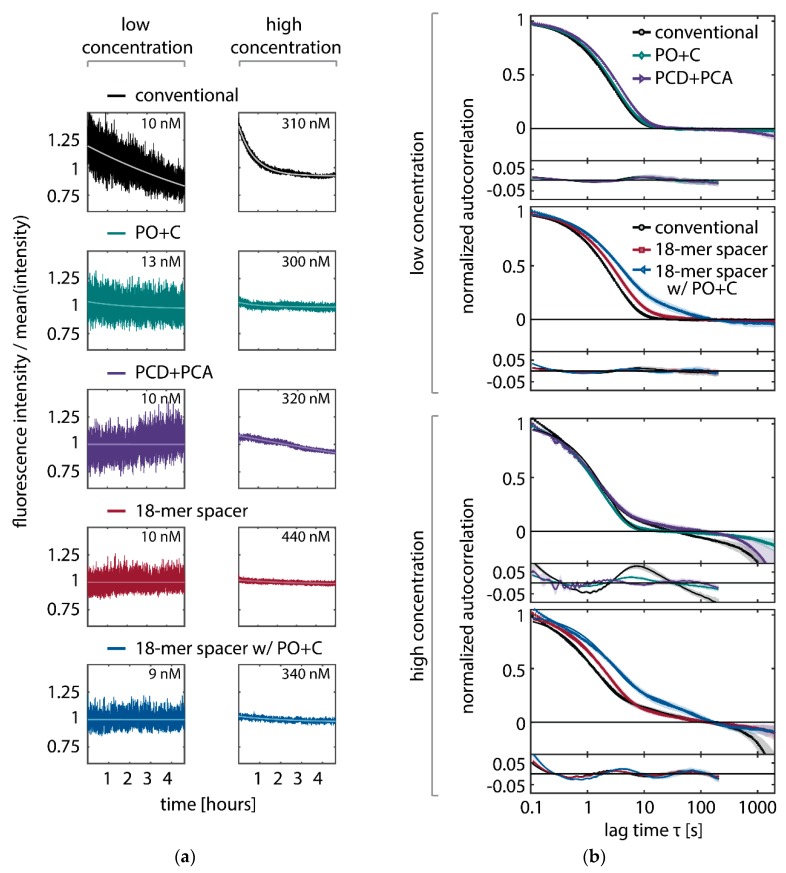
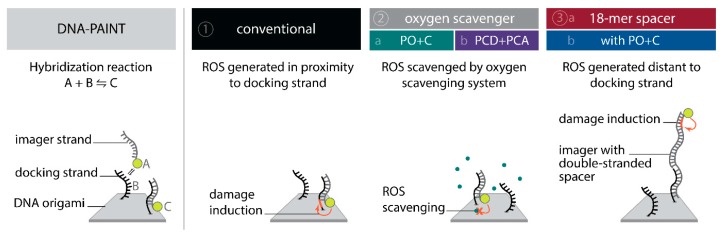
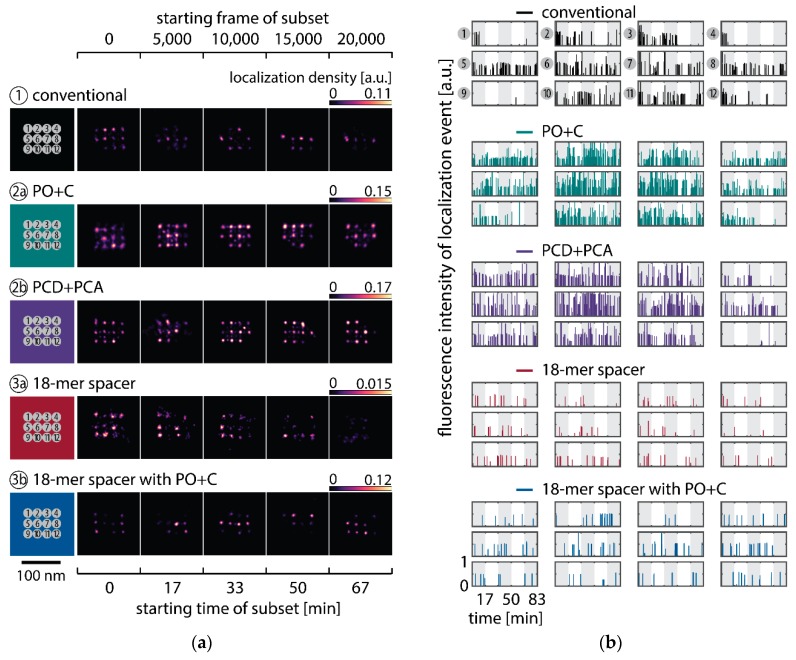
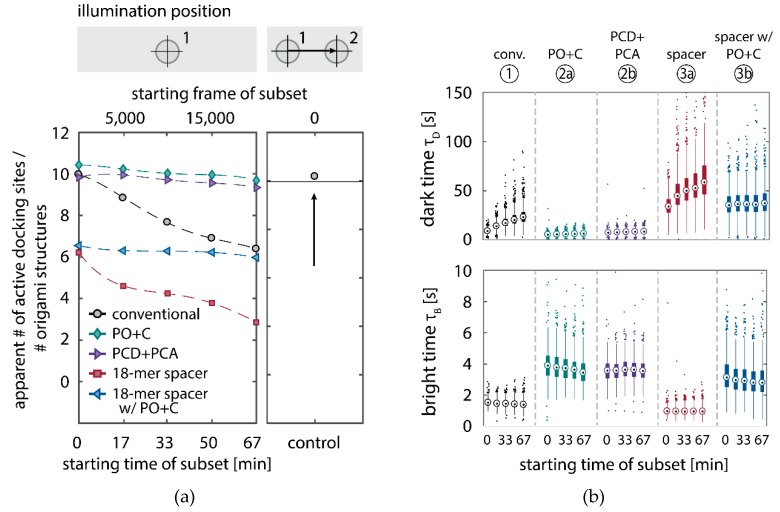
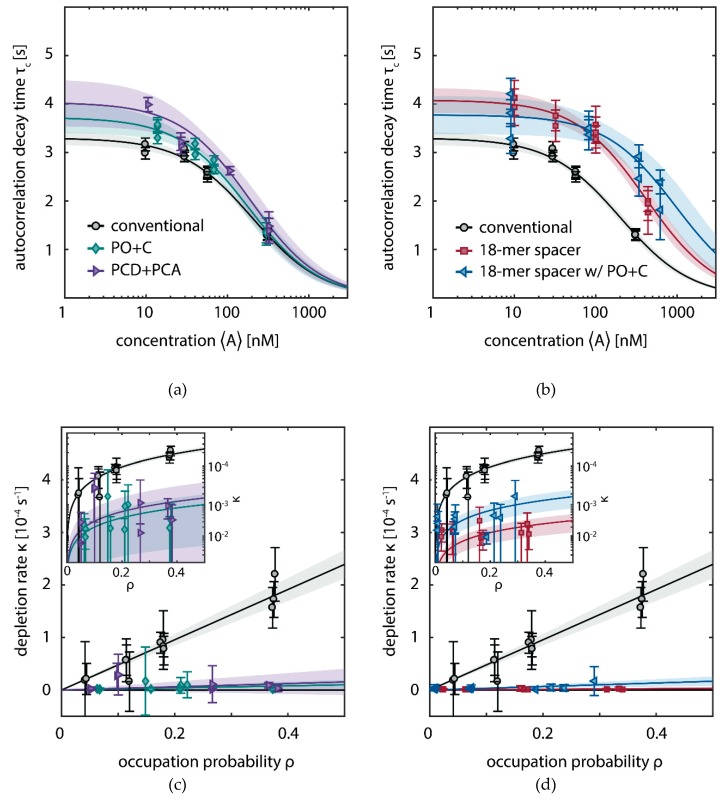
The limited photon budget of fluorescent dyes is the main limitation for localization precision in localization-based super-resolution microscopy. Points accumulation for imaging in nanoscale topography (PAINT)-based techniques use the reversible binding of fluorophores and can sample a single binding site multiple times, thus elegantly circumventing the photon budget limitation. With DNA-based PAINT (DNA-PAINT), resolutions down to a few nanometers have been reached on DNA-origami nanostructures. However, for long acquisition times, we find a photo-induced depletion of binding sites in DNA-PAINT microscopy that ultimately limits the quality of the rendered images. Here we systematically investigate the loss of binding sites in DNA-PAINT imaging and support the observations with measurements of DNA hybridization kinetics via surface-integrated fluorescence correlation spectroscopy (SI-FCS). We do not only show that the depletion of binding sites is clearly photo-induced, but also provide evidence that it is mainly caused by dye-induced generation of reactive oxygen species (ROS). We evaluate two possible strategies to reduce the depletion of binding sites: By addition of oxygen scavenging reagents, and by the positioning of the fluorescent dye at a larger distance from the binding site.

Keywords: DNA-PAINT; photo-induced DNA damage; reactive oxygen species; super-resolution microscopy; surface-integrated fluorescence correlation spectroscopy (SI-FCS).


Conflict of interest statement

The authors declare no conflict of interest.

Figures

Figure A1
Figure A1
With increasing measurement time, the total number of localizations per DNA origami nanostructure decreases. One large time series of 25,000 frames (83 min) was drift corrected and subsequently divided into five subsets of 5000 frames (17 min each). Acquiring an additional 5000-frame-subset on the same sample in a previously not irradiated area recovers the initial number of localizations, indicating that bulk bleaching of fluorophores in solution is negligible compared to the locally observed decrease in the number of localizations.
Figure A2
Figure A2
Confocal FCS measurement of the imager concentration and diffusion coefficient. (a) Representative autocorrelation curves for the conventional imager with their respective fits to a simple 3D diffusion model (Equation (7)) and residuals. The three displayed curves have the target concentrations 10 nM (black), 30 nM (blue) and 300 nM (brown) and the measured concentrations 9.8 nM, 29.7 nM and 310 nM, respectively. (b) Normalized autocorrelation curves at the target concentration 10 nM for the conventional condition (identical to (a)) and the 18-mer spacer, leading to a decrease in the diffusion time. (c) Diffusion coefficient D for the conventional and 18-mer spacer condition at different concentrations. The average diffusion coefficients (dashed lines) are determined as (mean±std.): (201±5) µm2/s (in good agreement with previously reported results [15,72]) and (120±20) µm2/s for the conventional and the 18-mer spacer, respectively. Based on the determined diffusion coefficients, we conclude that bleached imager within the TIRF excitation volume is predominantly recovered from solution by diffusion along the direction of the evanescent excitation. The diffusion time can be estimated as tD~dev2/D, with dev being the evanescent field of the TIRF illumination. Assuming the penetration depth as dev~75 nm [74], we obtain tD~50 µs, three orders of magnitude faster than the PAINT exposure time (200 ms) or the minimal SI-FCS correlation time (100 ms). In the high irradiance regime (I0=0.2 kW/cm2), the rate of photo-bleaching within the TIRF illumination can be assumed four orders of magnitude slower than the recovery by diffusion, based on the bright times found for the conventional condition, which is shortened by photo-bleaching to τB~2 s (Figure 3b). Raw data of confocal FCS measurements is available as Supplementary Material.
Figure A3
Figure A3
Selected DNA-PAINT super-resolved images of DNA nanostructures showing the depletion of binding sites in the five different conditions. (a) Images for the conventional imager (1). Five rows display different nanostructures that showed a high number of initially available docking sites. Images along the five columns represent the localizations within a subset of 5000 frames from a 25,000 frame long measurement. Scale bar: 100 nm. (b) Images taken with addition of the oxygen scavenging buffer PO+C (2a), PCD+PCA (2b), extension with an 18-mer spacer (3a) and the combination of 18-mer spacer and PO+C (3b).
Figure A3
Figure A3
Selected DNA-PAINT super-resolved images of DNA nanostructures showing the depletion of binding sites in the five different conditions. (a) Images for the conventional imager (1). Five rows display different nanostructures that showed a high number of initially available docking sites. Images along the five columns represent the localizations within a subset of 5000 frames from a 25,000 frame long measurement. Scale bar: 100 nm. (b) Images taken with addition of the oxygen scavenging buffer PO+C (2a), PCD+PCA (2b), extension with an 18-mer spacer (3a) and the combination of 18-mer spacer and PO+C (3b).
Figure A4
Figure A4
Averaged super-resolved DNA-PAINT images of DNA origami nanostructures for the whole time series of 83 min. The total numbers of identified DNA origami nanostructures nns employed for averaging are stated above the average images. Line profiles of total number of localizations through the two lower left points from each averaged image were fitted with a double Gaussian function (f(x)=a1exp[(xb1)22σ12]+a2exp[(xb2)22σ22]+c). The number stated for each peak is the FWHM (in nm) and can be interpreted as a measure of the achievable resolution; the peak-to-peak distance is shown above the plot. Additionally, the value of the nearest neighbor analysis (NeNA) [11,75] is shown for the first subset.
Figure A4
Figure A4
Averaged super-resolved DNA-PAINT images of DNA origami nanostructures for the whole time series of 83 min. The total numbers of identified DNA origami nanostructures nns employed for averaging are stated above the average images. Line profiles of total number of localizations through the two lower left points from each averaged image were fitted with a double Gaussian function (f(x)=a1exp[(xb1)22σ12]+a2exp[(xb2)22σ22]+c). The number stated for each peak is the FWHM (in nm) and can be interpreted as a measure of the achievable resolution; the peak-to-peak distance is shown above the plot. Additionally, the value of the nearest neighbor analysis (NeNA) [11,75] is shown for the first subset.
Figure A5
Figure A5
The observed lower number of active docking sites for the 18-mer spacer (conditions 3a and 3b) is caused by the lower association rate of the extended imager. Identifying active docking sites on the whole time series of 25,000 frames, recovers the number of initially active docking sites expected from the conventional imaging condition (condition 1).
Figure A6
Figure A6
The number of available docking sites per origami structures influences the dark and bright times. (a) Intensity trace (representative section) of localizations assigned to the DNA origami presented in Figure 2 (PO+C) showing the effect of simultaneous binding. The step-wise increase corresponds to binding of imager strands, while the step-wise decrease indicates unbinding of an imager strand or photo-bleaching of individual fluorophores. (b) Comparison of experimentally obtained kinetics with simulations of origami nanostructures exposing a varying number of docking sites. On the one hand, a depletion of docking sites causes an increase in dark time τD, as individual hybridization events are as probable, but the number of possible binding partners is reduced. On the other hand, the localization algorithm counts temporally overlapping binding events within one diffraction-limited spot as one longer binding event. The probability for simultaneous binding increases with the number of binding sites in one diffraction limited spot. For the simulation, we made the following assumptions, based on the results from SI-FCS measurements (see Table 1): association rate ka= 1.5 ×106 (mol·s)1, kd=0.3 s1, c=10 nM and the number of binding sites decreasing step-wise with every subset from initially 12 to finally four binding sites. The simulated intensities from individual binding sites added up to obtain intensity traces for origami nanostructures.
Figure A7
Figure A7
Influence of the depletion of binding sites on the autocorrelation function: (a) Decays of the integrated fluorescence intensity within a representative region of interest (dark shade) and fit of the mono-exponential detrending function (Equation (1), light shade). For all five conditions (conventional, addition of oxygen scavenging system (PO+C and PCD+PCA), 18-mer spacer and 18-mer spacer with PO+C) an example at low and high concentration is shown. The concentrations of individual samples were measured by confocal FCS. (b) Representative normalized autocorrelation functions and residuals with conditions as in (a) (solid lines). Shaded areas represent the standard deviation from 64 regions of interest.
Figure 1
Figure 1
Schematic of DNA-PAINT with the binding of imager strands (A) to docking strands (B) forming the hybridized duplex (C) (left panel). Overview of the conditions to explore the photo-induced depletion of binding sites in DNA-PAINT microscopy and kinetic measurement with SI-FCS (right panel): (1) conventional 9 nt overlapping imager, (2) identical imager as in (1) but in presence of a oxygen scavenging system (2a: PO+C or 2b: PCD+PCA), (3a) a modified imager with identical binding sequence and buffer conditions as in (1) but extended by an double-stranded spacer, increasing the distance of dye and docking strand and (3b) the combination of 18-mer spacer and PO+C. ROS scavenging and an increased distance of the fluorescent dye to the docking strand are ought to decrease the rate of depletion of docking sites.
Figure 2
Figure 2
Long DNA-PAINT acquisition of DNA origami nanostructures with 12 exposed docking strands arranged in a 3 × 4 grid with 20 nm spacing. Five conditions are displayed: conventional imager (1, black), conventional imager with oxygen scavenging system added (2a: PO+C, turquoise; 2b: PCD+PCA, purple), imager with 18-mer spacer between docking sequence and fluorescent dye (3a, red) and the 18-mer spacer with PO+C (3b, blue). (a) Time series of representative super-resolved DNA-PAINT images, reconstructed from five subsequent 5,000 frame long subsets of a 25,000 frame long acquisition (in total 83 min). Additional examples are listed in the Appendix A (Figure A3). Scale Bar: 100 nm. (b) Time traces of localizations within circular areas picked as individual bindings sites. The alternating shade of the background indicates the five subsets. DNA-PAINT raw data is available as Supplementary Material.
Figure 3
Figure 3
Quantitative analysis of the depletion of docking strands in DNA-PAINT super-resolution microscopy. The five conditions displayed are identical to Figure 2. (a) Left panel: active docking sites are counted individually on DNA origami nanostructures, based on the back-translation of the position of docking sites picked on automatically averaged nanostructures (Figure A4) and divided by the total number of identified origami structures. The dashed line is a guide to the eye. Right panel: a control of 5000 frames, equivalent to the first subset, was measured in a previously not irradiated area on the same sample and compared to the initial number of active docking sites (solid horizontal line) for the conventional condition (right panel). The total numbers of identified DNA origami nanostructures for the five conditions are: (1) 786, (2a) 824, (2b) 566, (3a) 690, (3b) 580 and 690 for the control of condition (1). (b) Box plots of the bright times τB and dark times τD for the subsets shown in (a). Circles indicate the median; bottom and top edges of the box (bold vertical lines) indicate the 25th and 75th percentiles, respectively. The whiskers extend to the data points not considered outliers (thin vertical lines); outliers are plotted individually as dots.
Figure 4
Figure 4
Depletion of docking sites investigated by SI-FCS at low irradiance (0.018 kW/cm2). (a) Titration series of the imager concentration A with 9 nt overlap for conventional imager strands (black), addition of oxygen scavenging system PO+C (turquoise) and PCD+PCA (purple). Data points and error bars represent mean and standard deviation from 64 regions of interest (5.1 × 5.1 µm), respectively. Solid lines show the fit to Equation (2). The 95% functional error bounds are displayed as shaded areas. (b) As (a) but comparing the conventional imager to the 18-mer spacer (red) and 18-mer spacer with PO+C (blue). (c) The effective depletion rate κ (Equation (1)) of docking strands depends linearly on the occupation probability ρ, which is calculated from the concentration and the kinetic rate constants according to Equation (6). Solid lines show the fit to Equation (4). Data points and errors are displayed as described in (a). The inset shows the depletion rate κ on a logarithmic scale. (d) Samples as in (b) displayed as in (c). SI-FCS raw data is available as Supplementary Material.

References

    1. Huang B., Bates M., Zhuang X. Super-Resolution Fluorescence Microscopy. Annu. Rev. Biochem. 2009;78:993–1016. doi: 10.1146/annurev.biochem.77.061906.092014. - DOI - PMC - PubMed
    1. Baddeley D., Bewersdorf J. Biological Insight from Super-Resolution Microscopy: What We Can Learn from Localization-Based Images. Annu. Rev. Biochem. 2018;87:965–989. doi: 10.1146/annurev-biochem-060815-014801. - DOI - PubMed
    1. Pertsinidis A., Zhang Y., Chu S. Subnanometre single-molecule localization, registration and distance measurements. Nature. 2010 doi: 10.1038/nature09163. - DOI - PubMed
    1. Betzig E., Patterson G.H., Sougrat R., Lindwasser O.W., Olenych S., Bonifacino J.S., Davidson M.W., Lippincott-Schwartz J., Hess H.F. Imaging Intracellular Fluorescent Proteins at Nanometer Resolution. Science. 2006;313:1642–1645. doi: 10.1126/science.1127344. - DOI - PubMed
    1. Hess S.T., Girirajan T.P.K., Mason M.D. Ultra-High Resolution Imaging by Fluorescence Photoactivation Localization Microscopy. Biophys. J. 2006;91:4258–4272. doi: 10.1529/biophysj.106.091116. - DOI - PMC - PubMed

LinkOut - more resources