

Trends in health resource disparities in primary health care institutions in Liaoning Province in Northeast China
- PMID: 30514300
- PMCID: PMC6280446
- DOI: 10.1186/s12939-018-0896-8
Trends in health resource disparities in primary health care institutions in Liaoning Province in Northeast China
Abstract
Background: The allocation of health resources in primary health care institutions (PHCI) is crucial to health reform. China has recently implemented many reform measures emphasizing the provision of primary health care services, with equity as one of the major goals. The aim of this study was to analyze the quantity, quality, and distribution of health resources in Liaoning Province from 2005 to 2017.
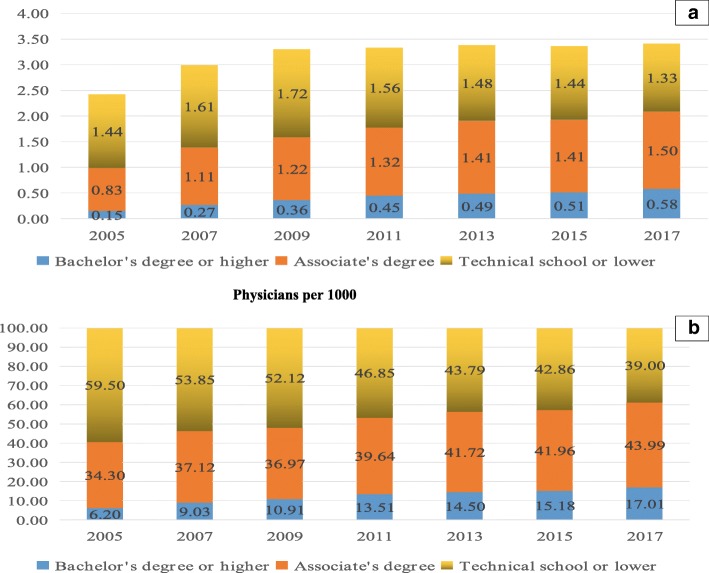
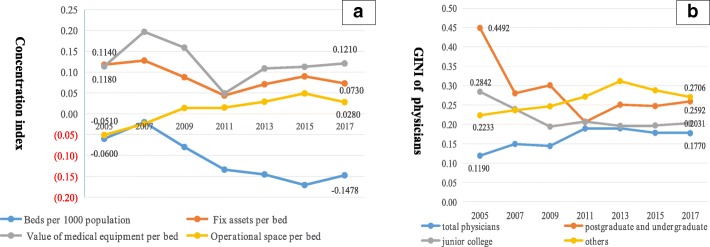
Methods: Data were drawn from the annual financial report from 2005 to 2017 and information from the Liaoning Province Department of Statistics. Numbers of beds and physicians were used as indicators of health resources. Capital assets per bed, value of medical equipment per bed, operational space per bed, and number of physicians with different educational levels were used as indicators of quality of health resources. Concentration indices (CI) and Gini coefficients were calculated.
Results: There was a steady rise in health resources in PHCI. From 2005 to 2017, the quality of health resources improved. The CI of beds showed an overall downward trend, indicating an improvement in the disparity among PHCI. There was a similar trend in the CI of fixed assets per bed. The Gini coefficients of physicians overall and physicians with different educational levels were almost always < 0.3, showing preferred equity status. There was a decreasing trend in the Gini coefficients of PHCI physicians with bachelor's degrees or higher and physicians with associate's degrees. The proportion of health resource of PHCI in health system increased from 2005 to 2009, before decreasing from 2009 to 2017 and the percentage of physicians overall and physicians with bachelor's degrees or higher in PHCI declined after 2011.
Conclusions: There was an improvement in the quantity and quality of health resources in PHCI from 2005 to 2017. The distribution of health resource allocation in PHCI also improved. The findings revealed that the measures for the improvement of PHCI physicians' educational level has been successful and the measures taken by the government in health reform to strengthen the primary health care system have not been successful.
Keywords: Disparity; Health resources; Primary health care institutions; Quality; Quantity.
Conflict of interest statement
Ethics approval and consent to participate
Informal consent was obtained for all study participants and government permission received prior to data collection.
Consent for publication
Individual level data is not published in this manuscript.
Competing interests
The authors declare that they have no competing interests.
Publisher’s Note
Springer Nature remains neutral with regard to jurisdictional claims in published maps and institutional affiliations.
Figures


References
-
- Cheng J, Yuan Y, Lu W, Yang L. Primary health care in China: is China's health reform for the whole nation? Prim Health Care Res Dev. 2017;18(04):398–403. - PubMed
-
- Li H, Liu K, Gu J, Zhang Y, Qiao Y, Sun X. The development and impact of primary health care in China from 1949 to 2015: a focused review. Int J Health Plann Mgmt. 2017;32(3):339–350. - PubMed
-
- AIDS . Guidance on ethics and equitable access to HIV treatment and care. Geneva,Switzerland: World Health Organization; 2004.
-
- Shi Y, Na AN, Qian GU, Ming LI. The equity analysis of resource allocation of community health services in Shanghai. Chin Health Resour. 2010;06(13):285–286.
Publication types
MeSH terms
LinkOut - more resources
Full Text Sources
Medical
