. 2018 Dec 4;19(1):15.
doi: 10.1186/s12867-018-0116-5.

Matrix association region/scaffold attachment region (MAR/SAR) sequence: its vital role in mediating chromosome breakages in nasopharyngeal epithelial cells via oxidative stress-induced apoptosis

Affiliations

Matrix association region/scaffold attachment region (MAR/SAR) sequence: its vital role in mediating chromosome breakages in nasopharyngeal epithelial cells via oxidative stress-induced apoptosis

Sang-Nee Tan et al. BMC Mol Biol. .

Abstract

Background: Oxidative stress is known to be involved in most of the aetiological factors of nasopharyngeal carcinoma (NPC). Cells that are under oxidative stress may undergo apoptosis. We have previously demonstrated that oxidative stress-induced apoptosis could be a potential mechanism mediating chromosome breakages in nasopharyngeal epithelial cells. Additionally, caspase-activated DNase (CAD) may be the vital player in mediating the chromosomal breakages during oxidative stress-induced apoptosis. Chromosomal breakage occurs during apoptosis and chromosome rearrangement. Chromosomal breakages tend to cluster in certain regions, such as matrix association region/scaffold attachment region (MAR/SAR). We hypothesised that oxidative stress-induced apoptosis may result in chromosome breaks preferentially at the MAR/SAR sites. The AF9 gene at 9p22 was targeted in this study because 9p22 is a deletion site commonly found in NPC.

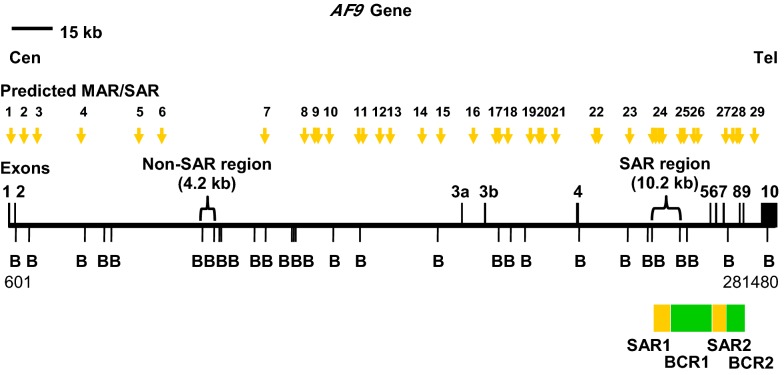
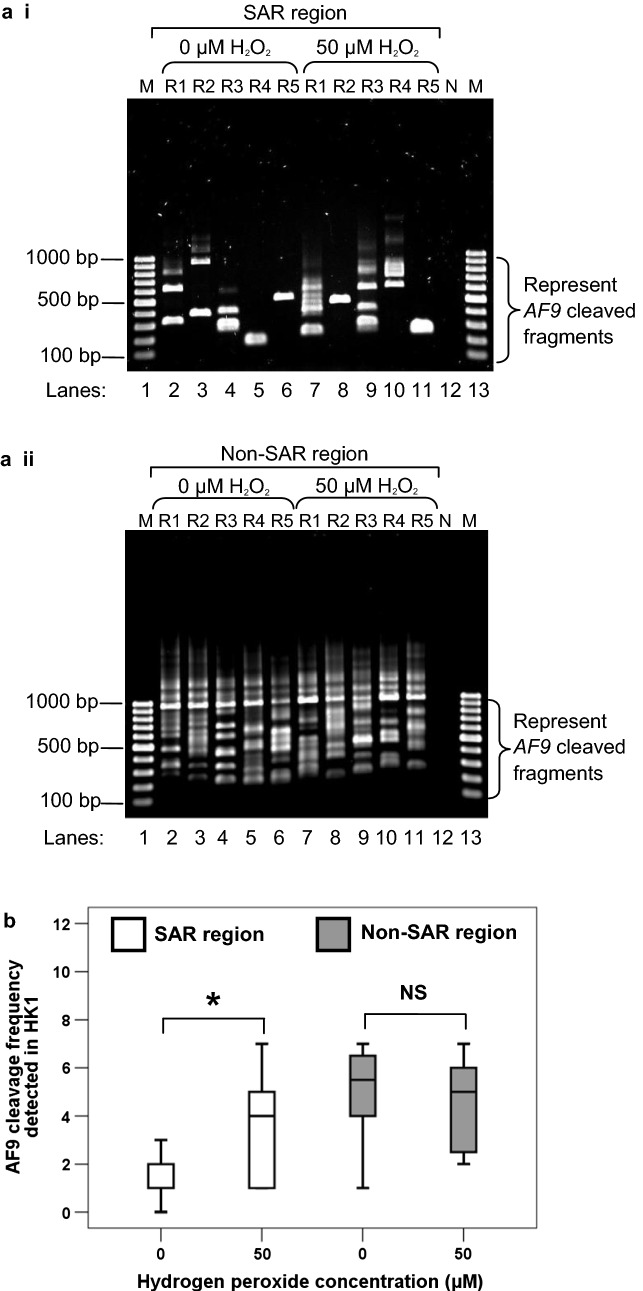
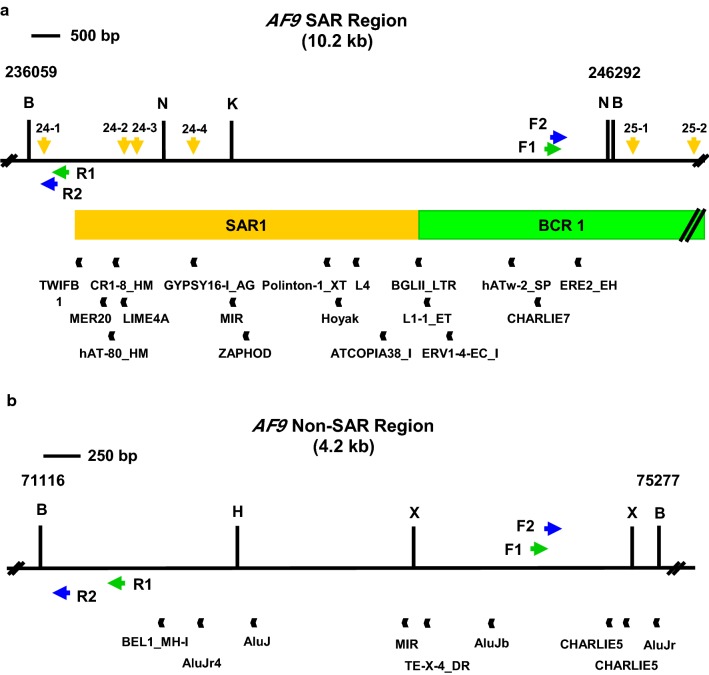
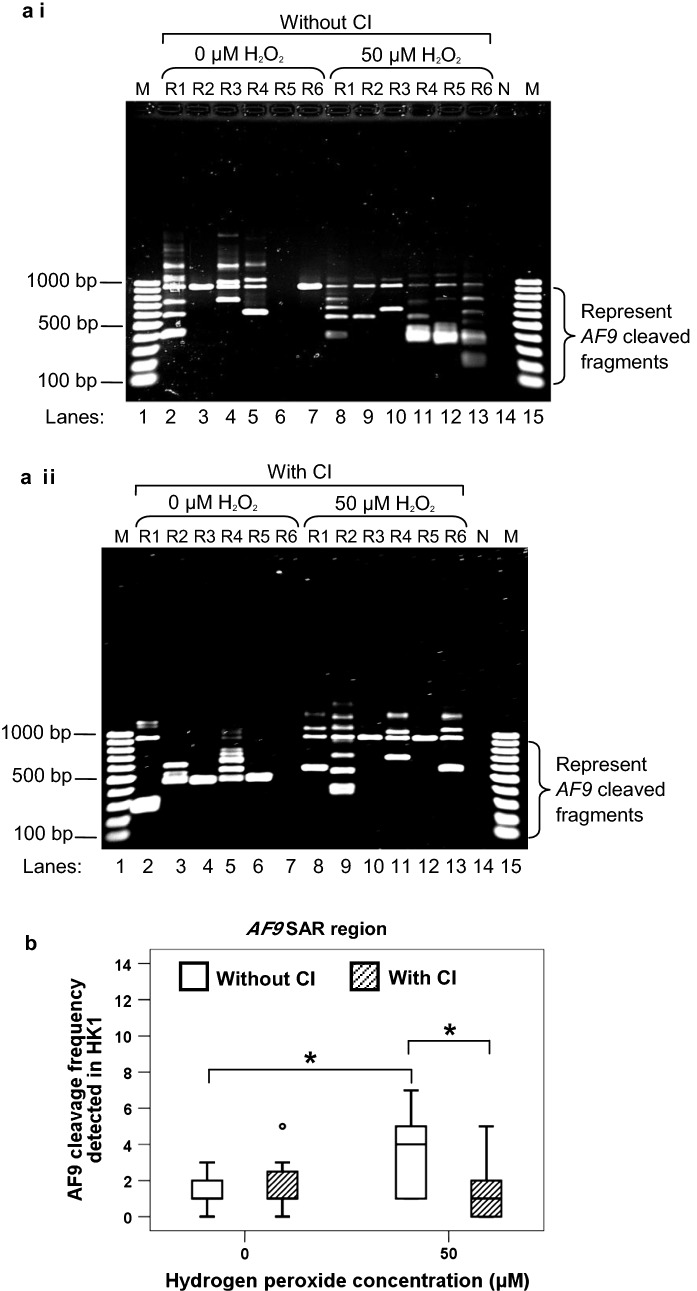
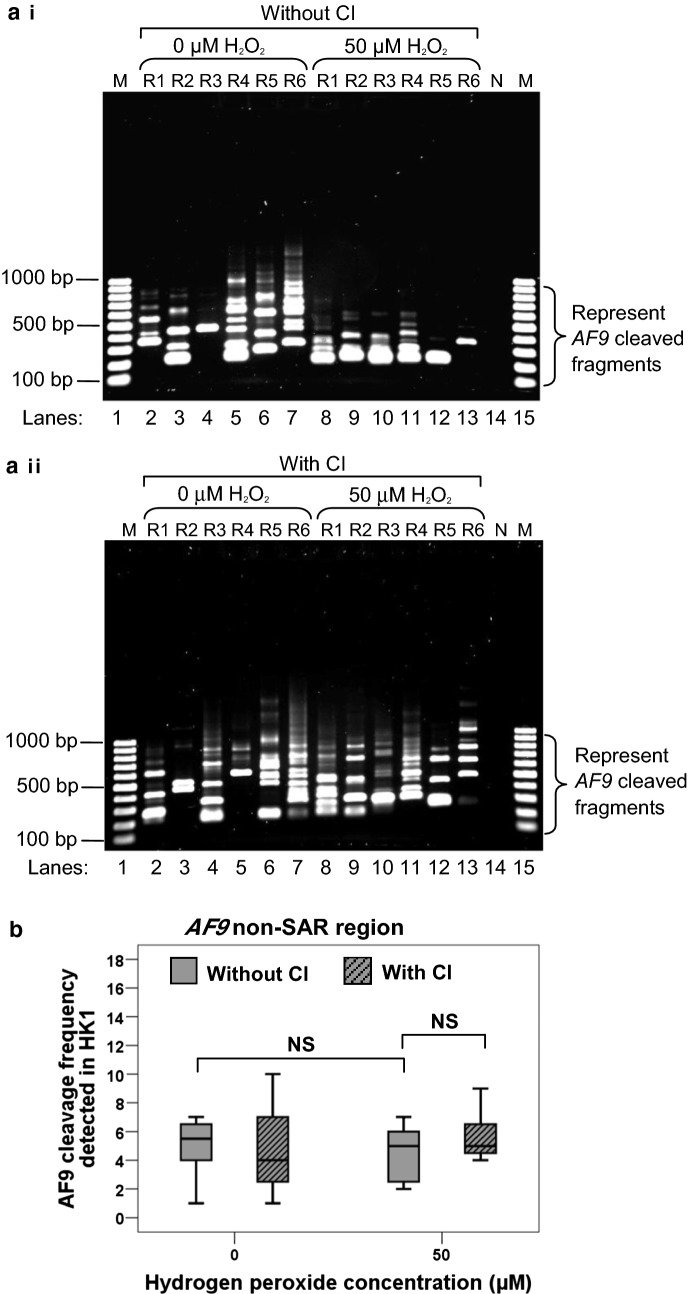
Results: By using MAR/SAR recognition signature (MRS), potential MAR/SAR sites were predicted in the AF9 gene. The predicted MAR/SAR sites precisely match to the experimentally determined MAR/SARs. Hydrogen peroxide (H2O2) was used to induce apoptosis in normal nasopharyngeal epithelial cells (NP69) and NPC cells (HK1). Nested inverse polymerase chain reaction was employed to identify the AF9 gene cleavages. In the SAR region, the gene cleavage frequency of H2O2-treated cells was significantly higher than that of the non-treated cells. A few chromosomal breakages were detected within the AF9 region which was previously found to be involved in the mixed lineage leukaemia (MLL)-AF9 translocation in an acute lymphoblastic leukaemia patient. As for the non-SAR region, no significant difference in the gene cleavage frequency was found between the untreated control and H2O2-treated cells. Furthermore, H2O2-induced cleavages within the SAR region were reduced by caspase-3 inhibitor, which indirectly inhibits CAD.

Conclusions: These results reaffirm our previous findings that oxidative stress-induced apoptosis could be one of the potential mechanisms underlying chromosome breakages in nasopharyngeal epithelial cells. MAR/SAR may play a vital role in defining the location of chromosomal breakages mediated by oxidative stress-induced apoptosis, where CAD is the major nuclease.

Keywords: AF9 gene; Apoptosis; H2O2; MAR/SAR; NPC; Oxidative stress.


Figures

Fig. 1
Fig. 1
Distribution of potential MAR/SAR sites predicted in the AF9 gene. The AF9 genomic map from nucleotide positions 601–281,480 is illustrated above [EMBL:ENSG00000171843]. The locations of exons 1 to 10 and BamH I (B) restriction sites are shown. Green boxes indicate the two patient BCRs reported in the previous study. These two patient BCRs were denominated as BCR1 and BCR2 [28]. Yellow boxes indicate the two MAR/SARs that were biochemically identified by Strissel and co-workers. These two MAR/SARs were designated as SAR1 and SAR2 [28]. Yellow arrows represent the potential MAR/SAR sites predicted by MRS in our study. Clusters of more than one MRS within close proximity are regarded as a single potential MAR/SAR site. Three MRSs were found in SAR1 (MAR 24-2, 24-3, 24-4). One MRS (MAR 27) has been predicted next to the SAR2. Based on the in silico prediction of MAR/SAR, a SAR region (contains MAR/SAR) and a non-SAR region (does not contain MAR/SAR) were determined to be the regions of study
Fig. 2
Fig. 2
Cleavage frequencies of the AF9 SAR and non-SAR regions in H2O2-treated NP69 cells. a Representative gel pictures showing the IPCR results of the AF9 gene in H2O2-treated NP69 cells: i SAR region, ii Non-SAR region. NP69 cells were either untreated (lanes 2–7) or treated with 100 µM of H2O2 for 16 h (lanes 8–13). The cells were harvested for gDNA extraction and nested IPCR. For each cell sample, six IPCR replicates (R1–R6) were prepared. The side brackets show the IPCR bands derived from the cleavages of the AF9 gene. M: 100 bp DNA ladder. N: Negative control for IPCR. b AF9 cleavage frequency detected in NP69 cells. Data are representative of three independent experiments. Each experiment consisted of 1–2 sets of IPCR. Each set of IPCR was performed in 5–8 IPCR replicates per cell sample. The results are presented as medians with IQRs. *P < 0.05; NS: no significant difference (Mann–Whitney U test)
Fig. 3
Fig. 3
Cleavage frequencies of the AF9 SAR and non-SAR regions in H2O2-treated HK1 cells. a Representative gel pictures showing the IPCR results of the AF9 gene in H2O2-treated HK1 cells: i SAR region, ii non-SAR region. HK1 cells were either untreated (lanes 2–6) or treated with 50 µM of H2O2 for 8 h (lanes 7–11). The cells were harvested for gDNA extraction and nested IPCR. For each cell sample, five IPCR replicates (R1–R5) were prepared. The side brackets show the IPCR bands derived from the cleavages of the AF9 gene. M: 100 bp DNA ladder. N: Negative control for IPCR. b AF9 cleavage frequency detected in HK1 cells. Data are representative of two independent experiments. Each experiment consisted of 1–2 sets of IPCR. Each set of IPCR was performed in 5–6 IPCR replicates per cell sample. The results are expressed as medians with IQRs. *P < 0.05; NS: no significant difference (Mann–Whitney U test)
Fig. 4
Fig. 4
The repeat elements identified within the AF9 SAR and the non-SAR regions. a The SAR region. The SAR region which is bordered by two BamH I sites is 10.2 kb in length (from coordinates 236,059 to 246,292). Green box represents the previously identified patient BCR which is indicated as BCR1. Yellow box shows the previously experimentally isolated MAR/SAR which is indicated as SAR1 [28]. Yellow arrows represent the potential MAR/SAR sites predicted by MRS in the present study. Green and blue arrows represent the primers used in the first and second rounds of nested IPCR, respectively. Black boxes show the repeat elements predicted by CENSOR program. BamH I (B), Kpn I (K) and Nde I (N) restriction sites are shown. b The non-SAR region. The non-SAR region which is bordered by two BamH I sites is 4.2 kb in length (from coordinates 71,116 to 75,277). Green and blue arrows represent the primers used in the first and second rounds of nested IPCR, respectively. Black boxes represent the repeat elements identified by using CENSOR program. BamH I (B), Hind III (H) and Xba I (X) restriction sites are shown
Fig. 5
Fig. 5
Caspase-3 inhibitor abolishes H2O2-induced cleavages within the AF9 SAR region. a Representative gel pictures showing the IPCR analysis of the AF9 SAR region in H2O2-treated HK1 cells: i without CI pre-treatment ii with CI pre-treatment. HK1 cells were left untreated or pre-treated with 50 µM of Z-DEVD-FMK for 1 h. The cells were then either untreated (lanes 2–7) or treated with 50 µM of H2O2 for 8 h (lanes 8–13). Genomic DNA was extracted and modified for nested IPCR. For each cell sample, six IPCR replicates (R1–R6) were prepared. The side brackets show the IPCR bands derived from the cleavages of the AF9 gene. M: 100 bp DNA ladder. N: Negative control for IPCR. b Cleavage frequency of the AF9 SAR region detected in HK1 cells. Data are representative of two independent experiments. Each experiment consisted of 1–2 sets of IPCR. Each set of IPCR was performed in 5–6 IPCR replicates per cell sample. The results are expressed as medians with IQRs. *P < 0.05 (Mann–Whitney U test)
Fig. 6
Fig. 6
Caspase-3 inhibitor shows no effect on reducing cleavages within the AF9 non-SAR region. a Representative gel pictures showing the IPCR analysis of the AF9 non-SAR region in H2O2-treated HK1 cells: i without CI pre-treatment ii with CI pre-treatment. HK1 cells were left untreated or pre-treated with 50 µM of Z-DEVD-FMK for 1 h. The cells were then either untreated (lanes 2–7) or treated with 50 µM of H2O2 for 8 h (lanes 8–13). Genomic DNA was extracted and modified for nested IPCR. For each cell sample, six IPCR replicates (R1–R6) were prepared. The side brackets show the IPCR bands derived from the cleavages of the AF9 gene. M: 100 bp DNA ladder. N: Negative control for IPCR. b Cleavage frequency of the AF9 non-SAR region detected in HK1 cells. Data are representative of two independent experiments. Each experiment consisted of 5–7 IPCR replicates per cell sample. The results are expressed as medians with IQRs. NS: No significant difference (Mann–Whitney U test)
Fig. 7
Fig. 7
The positions of H2O2-induced chromosome breaks within the AF9 SAR region. a The AF9 genomic map from nucleotide positions 601–281,480 [EMBL:ENSG00000171843] [26]. Black vertical lines represent the locations of exons 1–10. Green boxes show the two previously identified patient BCRs, namely BCR1 and BCR2 [28]. Yellow boxes show the two MAR/SARs which were extracted experimentally in the previous study. These two MAR/SARs were indicated as SAR1 and SAR2 [28]. BamH I (B) restriction sites are shown. Yellow arrows represent the potential MAR/SAR sites predicted by MRS in our study. b The AF9 SAR region (10.2 kb). BamH I (B), Kpn I (K) and Nde I (N) restriction sites are shown. Green and blue arrows represent the primers used in the first and second rounds of nested IPCR, respectively. c Breakpoints mapped in H2O2-treated cells. Red and green vertical lines show the breakpoints identified in H2O2-treated NP69 and HK1 cells, respectively. All the chromosome breaks were mapped within BCR1 which is bordered SAR1 and SAR2. Blue box represents the AF9 region (at coordinates 245,252–245,612) that was previously reported to translocate with the MLL gene resulting in the formation of the MLL-AF9 fusion gene in an ALL patient [GenBank:AM050804]

References

    1. Henle G, Henle W. Epstein–Barr virus-specific IgA serum antibodies as an outstanding feature of nasopharyngeal carcinoma. Int J Cancer. 1976;17:1–7. doi: 10.1002/ijc.2910170102. - DOI - PubMed
    1. Raab-Traub N. Epstein–Barr virus and nasopharyngeal carcinoma. Semin Cancer Biol. 1992;3:297–307. - PubMed
    1. Armstrong RW, Armstrong MJ, Yu MC, Henderson BE. Salted fish and inhalants as risk factors for nasopharyngeal carcinoma in Malaysian Chinese. Cancer Res. 1983;43:2967–2970. - PubMed
    1. Fong LY, Ho JH, Huang DP. Preserved foods as possible cancer hazards: WA rats fed salted fish have mutagenic urine. Int J Cancer. 1979;23:542–546. doi: 10.1002/ijc.2910230416. - DOI - PubMed
    1. Huang DP, Ho JH, Saw D, Teoh TB. Carcinoma of the nasal and paranasal regions in rats fed Cantonese salted marine fish. IARC Sci Publ. 1978;20:315–328. - PubMed

Publication types

Substances