. 2018 Dec 4;19(1):212.
doi: 10.1186/s13059-018-1587-x.

Downregulation of RdDM during strawberry fruit ripening

Affiliations

Downregulation of RdDM during strawberry fruit ripening

Jingfei Cheng et al. Genome Biol. .

Abstract

Background: Recently, DNA methylation was proposed to regulate fleshy fruit ripening. Fleshy fruits can be distinguished by their ripening process as climacteric fruits, such as tomatoes, or non-climacteric fruits, such as strawberries. Tomatoes undergo a global decrease in DNA methylation during ripening, due to increased expression of a DNA demethylase gene. The dynamics and biological relevance of DNA methylation during the ripening of non-climacteric fruits are unknown.

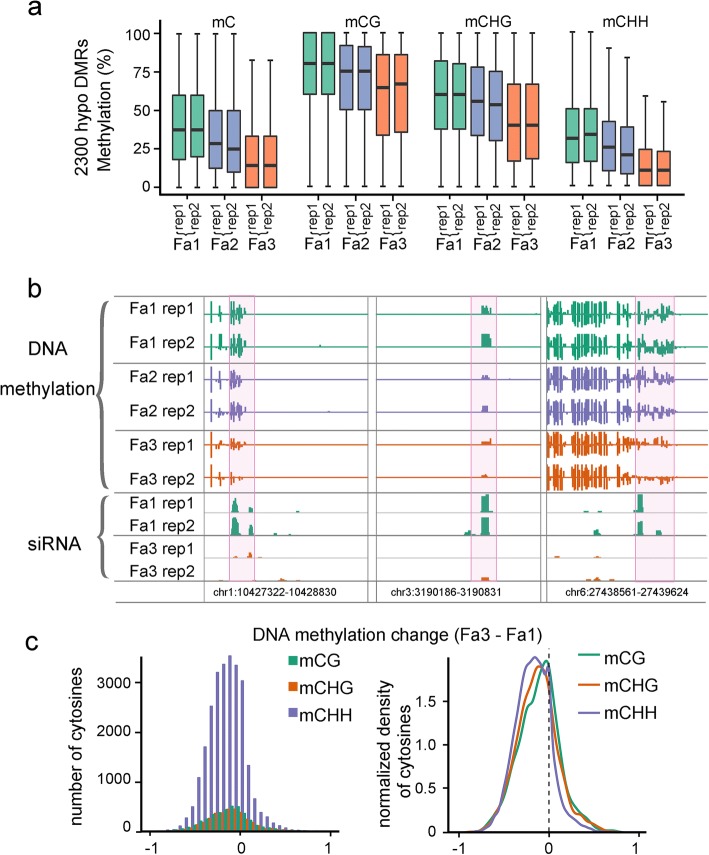
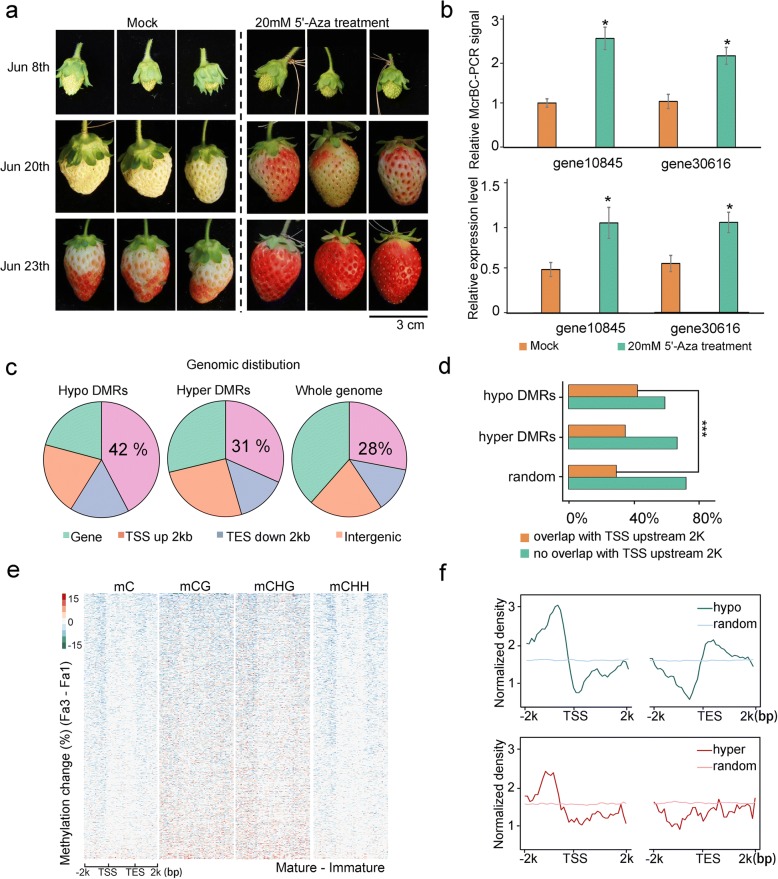
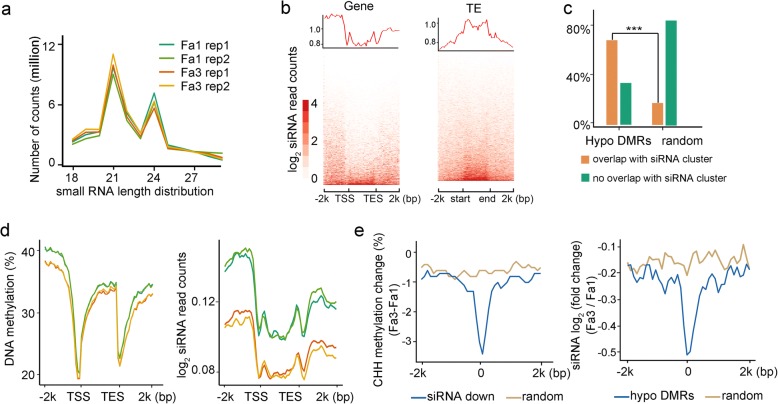
Results: Here, we generate single-base resolution maps of the DNA methylome in immature and ripe strawberry. We observe an overall loss of DNA methylation during strawberry fruit ripening. Thus, ripening-induced DNA hypomethylation occurs not only in climacteric fruit, but also in non-climacteric fruit. Application of a DNA methylation inhibitor causes an early ripening phenotype, suggesting that DNA hypomethylation is important for strawberry fruit ripening. The mechanisms underlying DNA hypomethylation during the ripening of tomato and strawberry are distinct. Unlike in tomatoes, DNA demethylase genes are not upregulated during the ripening of strawberries. Instead, genes involved in RNA-directed DNA methylation are downregulated during strawberry ripening. Further, ripening-induced DNA hypomethylation is associated with decreased siRNA levels, consistent with reduced RdDM activity. Therefore, we propose that a downregulation of RdDM contributes to DNA hypomethylation during strawberry ripening.

Conclusions: Our findings provide new insight into the DNA methylation dynamics during the ripening of non-climacteric fruit and suggest a novel function of RdDM in regulating an important process in plant development.

Keywords: DNA methylation; Fruit ripening; RdDM; Strawberry; siRNA.


Conflict of interest statement

Ethics approval and consent to participate

Not applicable.

Consent for publication

Not applicable.

Competing interests

The authors declare that they have no competing interests.

Publisher’s Note

Springer Nature remains neutral with regard to jurisdictional claims in published maps and institutional affiliations.

Figures

Fig. 1
Fig. 1
Characterization of strawberry methylomes. a Picture of strawberry fruits at different stages. Immature (Fa1), half-red (Fa2), and fully red (Fa3) fruits were used. b Correlation between DNA methylation level and gene (left panel) or TE densities (right panel). c Percentages of genes that have TEs within 500 bp, 1 kb and 2 kb in Arabidopsis (At), strawberry (Fv), and tomato (Sl) genomes, respectively. d DNA methylation profiles of mCG, mCHG, mCHH and mC surrounding genes (upper panel) and TEs (lower panel) in immature (Fa1) and fully red (Fa3) fruits. Two biological replicates were shown. Transcription start site (TSS) and transcription end site (TES) are indicated
Fig. 2
Fig. 2
DNA methylation dynamics during strawberry ripening. a Boxplots showing DNA methylation levels of 2300 hypo-differentially methylated regions (DMRs) in Fa3 relative to Fa1 in all stages. Methylation levels in mC, mCG, mCHG, and mCHH contexts of two biological replicates are shown. b Integrated Genome Browser (IGB) display of DNA methylation levels and 24-nt siRNA levels of representative hypo-DMRs. DNA methylation levels of cytosines and siRNA levels are indicated by the heights of the vertical bars on each track. Genome coordinates are indicated at the bottom. Two biological replicates are shown. c Distribution of ripening-induced methylation change of cytosines in different contexts. Cytosines within 2766 DMRs in Fa3 relative to Fa1 were used. DNA methylation change (Fa3-Fa1) for each cytosine was plotted according to the number of cytosines
Fig. 3
Fig. 3
Characterization of ripening-induced DNA hypomethylation. a Pictures of DNA methylation inhibitor 5-azacytidine-treated fruits. Fruits treated with water served as control (mock). b McrBC-qPCR analysis of DNA methylation levels (upper panel) and qPCR analysis of gene expression levels (lower panel) of two genes in mock and 5-azacytidine-treated fruits. In McrBC-qPCR analysis, a higher qPCR signal indicates lower mC level. Error bars indicate SD, n = 3 (*P value < 0.05, two-tailed t test). c Distribution of genomic elements within ripening-induced hypo-DMRs, hyper-DMRs, and the whole genome. Gene, gene body; TSS up 2 kb, 2 kb upstream of TSS; TES down 2 kb, 2 kb downstream of TES; Intergenic, intergenic regions. d Hypo-DMRs are significantly associated with regions 2 kb upstream of TSS as compared to random genomic regions (***P value < 0.01, as determined using Fisher’s exact test). e Heatmaps showing DNA methylation changes (Fa3-Fa1) across hypo-DMR-associated genes. Methylation changes in mC, mCG, mCHG, and mCHH contexts are shown. f Distributions of hypo-DMRs (blue line in upper panel) and hyper-DMRs (red line in lower panel) around genes as compared to that of randomly selected genomic regions (light-blue line and light-red line)
Fig. 4
Fig. 4
Expression of genes involved in DNA methylation. a Phylogenetic analysis of DNA methyltransferase genes in strawberry and Arabidopsis. b Heatmap showing transcript levels of DNA methyltransferase genes in Fa1~Fa3 (*adjusted P value < 0.05, as determined using the DESeq). c Transcript levels of genes involved in the RdDM pathway in Fa1~Fa3. A brief working model of RdDM pathway is shown on the left. Pol IV (RNA polymerase IV), RDR2 (RNA-Dependent RNA polymerase 2), and DCLs (DICER-LIKES) are required for siRNA biogenesis; Pol V, AGO4/6 (ARGONAUTE 4/6), and DRM2 are involved in siRNA-guided DNA methylation. NRPD1 and NRPE1 are the largest subunits of Pol IV and Pol V respectively. Heatmap (right panel) shows transcript levels of genes involved in RdDM pathways (* adjusted P value < 0.05, as determined using the DESeq)
Fig. 5
Fig. 5
Association between ripening-induced siRNA decrease and DNA hypomethylation. a Size distribution of sequenced strawberry small RNAs. Two biological replicates of Fa1 and Fa3 are shown. b Average profile and heatmaps showing 24-nt siRNA distribution surrounding genes (left) and TEs (right). c Hypo-DMRs are significantly associated with siRNA clusters as compared to random genomic regions (***P value < 0.01, as determined using Fisher’s exact test). d Profiles of DNA methylation (left panel) and siRNA (right panel) surrounding genes in Fa1 and Fa3. Two biological replicates of Fa1 and Fa3 are shown. e Change of CHH methylation surrounding siRNA downregulated regions (left) and change of 24-nt siRNA level surrounding hypo-DMRs (right) on average
Fig. 6
Fig. 6
Association between DNA methylation and gene expression changes. a MA-plot showing the expression change during ripening. Eight hundred ninety-nine up- and 1417 down-differentially expressed genes (DEGs) were detected in Fa3 as compared to Fa1 (adjusted P value < 0.01, as determined using the DESeq). b Heatmaps showing DNA methylation changes (Fa3-Fa1) surrounding 1417 down-DEGs (left panel) and 899 up-DEGs (right panel). The blue bars on the right indicate hypomethylated genes. c IGB display of DNA methylation levels and transcript levels of two up-DEGs (upper panel) and two down-DEGs (lower panel) in Fa1 and Fa3. Hypo-DMRs are boxed. d Gene Ontology (GO) analysis of hypomethylated DEGs and non-hypomethylated DEGs. GO terms enriched in hypomethylated-DEGs were illustrated. GO enrichments of hypomethylated down-DEGs (left panel) and up-DEGs (right panel) are shown respectively

References

    1. Zhu JK. Active DNA demethylation mediated by DNA glycosylases. Annu Rev Genet. 2009;43:143–166. doi: 10.1146/annurev-genet-102108-134205. - DOI - PMC - PubMed
    1. Law JA, Jacobsen SE. Establishing, maintaining and modifying DNA methylation patterns in plants and animals. Nat Rev Genet. 2010;11:204–220. doi: 10.1038/nrg2719. - DOI - PMC - PubMed
    1. Zemach A, Kim MY, Hsieh PH, Coleman-Derr D, Eshed-Williams L, Thao K, Harmer SL, Zilberman D. The Arabidopsis nucleosome remodeler DDM1 allows DNA methyltransferases to access H1-containing heterochromatin. Cell. 2013;153:193–205. doi: 10.1016/j.cell.2013.02.033. - DOI - PMC - PubMed
    1. Matzke MA, Kanno T, Matzke AJ. RNA-directed DNA methylation: the evolution of a complex epigenetic pathway in flowering plants. Annu Rev Plant Biol. 2015;66:243–267. doi: 10.1146/annurev-arplant-043014-114633. - DOI - PubMed
    1. Matzke MA, Mosher RA. RNA-directed DNA methylation: an epigenetic pathway of increasing complexity. Nat Rev Genet. 2014;15:394–408. doi: 10.1038/nrg3683. - DOI - PubMed

Publication types