. 2019 Jan 8;116(1):127-141.
doi: 10.1016/j.bpj.2018.11.011. Epub 2018 Nov 16.

Mouse ICM Organoids Reveal Three-Dimensional Cell Fate Clustering

Affiliations

Mouse ICM Organoids Reveal Three-Dimensional Cell Fate Clustering

Biena Mathew et al. Biophys J. .

Abstract

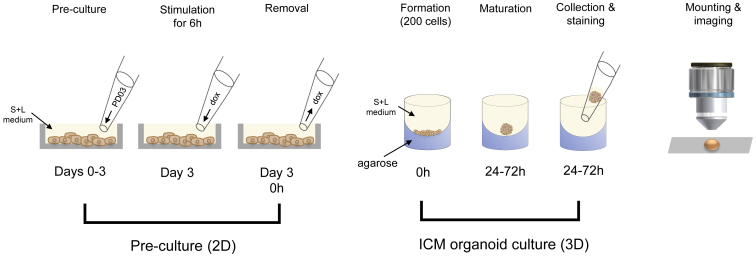
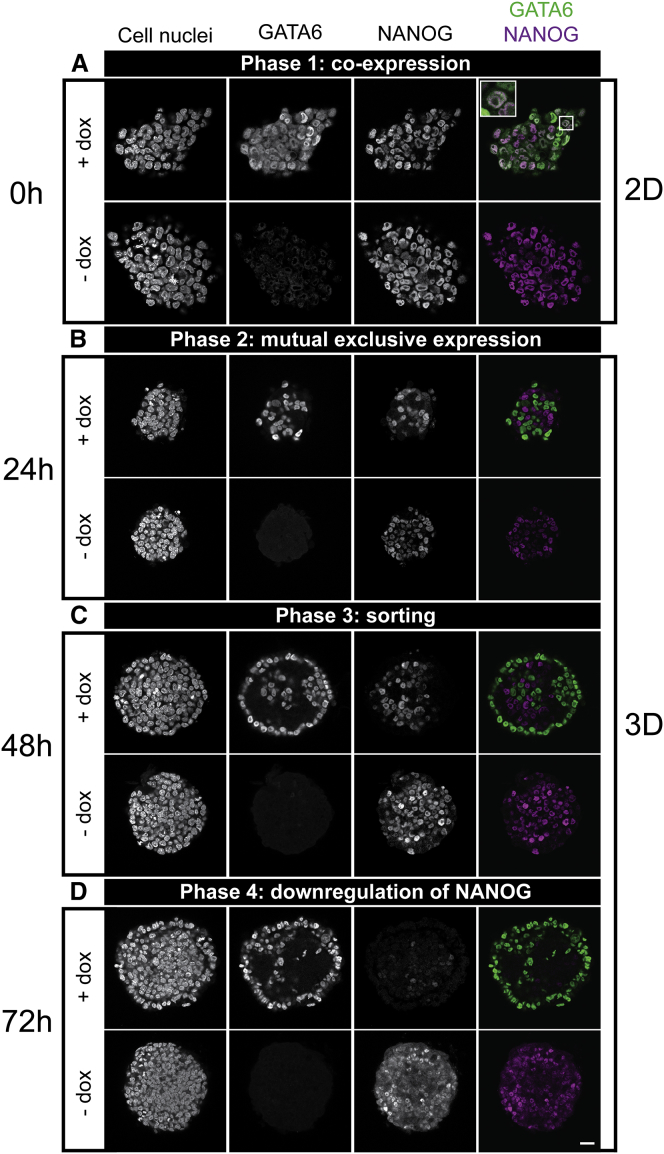
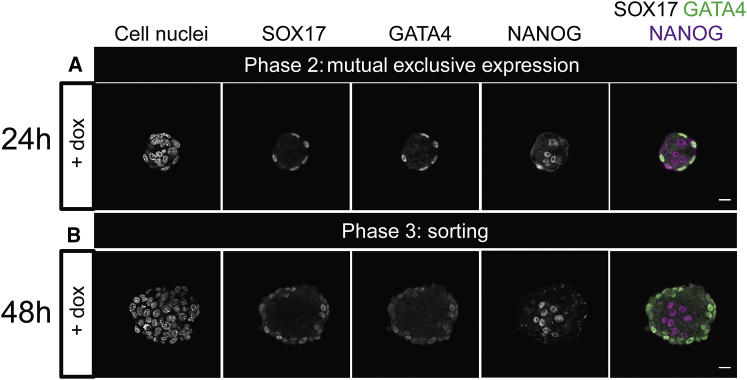
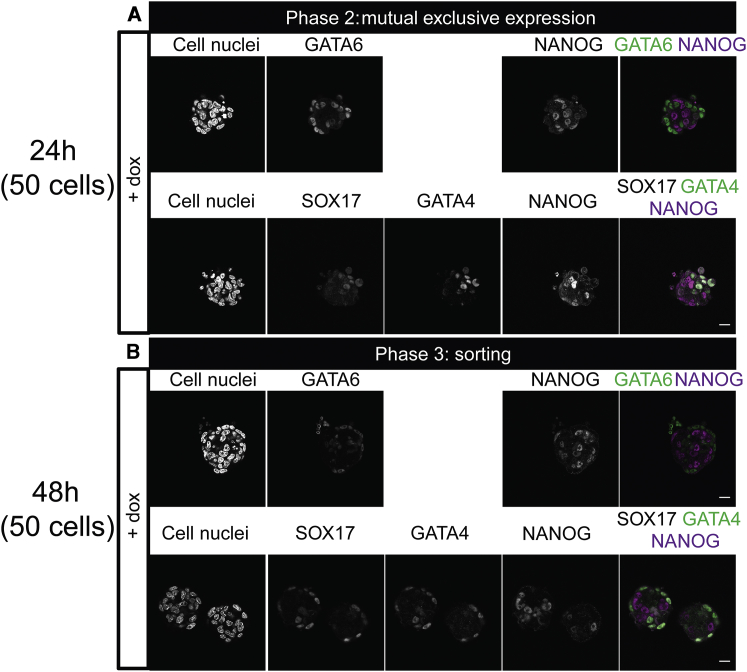
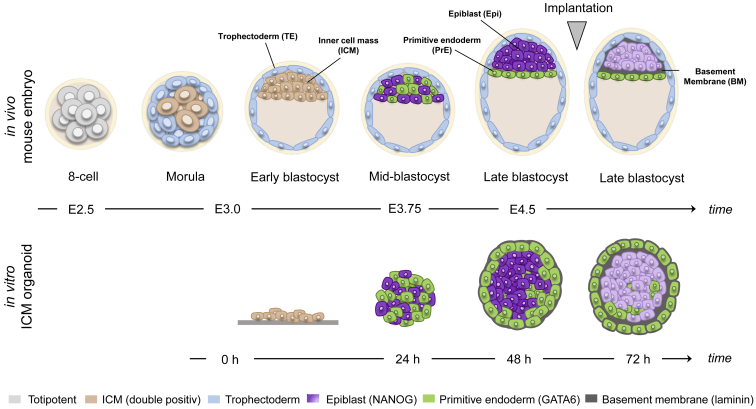
During mammalian preimplantation, cells of the inner cell mass (ICM) adopt either an embryonic or an extraembryonic fate. This process is tightly regulated in space and time and has been studied previously in mouse embryos and embryonic stem cell models. Current research suggests that cell fates are arranged in a salt-and-pepper pattern of random cell positioning or a spatially alternating pattern. However, the details of the three-dimensional patterns of cell fate specification have not been investigated in the embryo nor in in vitro systems. We developed ICM organoids as a, to our knowledge, novel three-dimensional in vitro stem cell system to model mechanisms of fate decisions that occur in the ICM. ICM organoids show similarities to the in vivo system that arise regardless of the differences in geometry and total cell number. Inspecting ICM organoids and mouse embryos, we describe a so far unknown local clustering of cells with identical fates in both systems. These findings are based on the three-dimensional quantitative analysis of spatiotemporal patterns of NANOG and GATA6 expression in combination with computational rule-based modeling. The pattern identified by our analysis is distinct from the current view of a salt-and-pepper pattern. Our investigation of the spatial distributions both in vivo and in vitro dissects the contributions of the different parts of the embryo to cell fate specifications. In perspective, our combination of quantitative in vivo and in vitro analyses can be extended to other mammalian organisms and thus creates a powerful approach to study embryogenesis.


Figures

Figure 1
Figure 1
Generation and imaging pipeline for aggregates of mESCs (ICM organoids). Mouse tet::GATA4 ESCs were pre-cultured for 3 days in medium containing serum and LIF (S + L) and PD0325901 (PD03). At day 3, cells were stimulated with dox for 6 h to induce PrE differentiation. After dox removal, 200 cells were seeded in microwell plates coated with 1% low melt agarose. Aggregates were formed in medium containing S + L and were kept undisturbed. After 24, 48, and 72 h, aggregates were collected, stained, mounted, and imaged. To see this figure in color, go online.
Figure 2
Figure 2
ICM organoids mimic the mouse ICM. Mouse tet::GATA4 ESCs were stimulated for 6 h with doxycycline (+ dox) to induce PrE differentiation. Cells that were not stimulated with dox (− dox) served as control. (A) After removal of dox, GATA6 and NANOG were coexpressed in cells of the two-dimensional monolayer of mESCs (see box for a magnified section of a coexpressing cell). (B) 24 h after ICM organoid formation, GATA6 and NANOG were mutually exclusively expressed within the ICM organoids. (C) After 48 h, GATA6-positive cells arranged at the rim of the ICM organoids. (D) After 72 h, NANOG was downregulated. Images show a single slice from the aggregate’s center. Microscope: Zeiss LSM780; objective: 63×/1.40 oil; scale bars, 20 μm. To see this figure in color, go online.
Figure 3
Figure 3
Mouse ICM organoids express the PrE markers GATA4 and SOX17. Mouse tet::GATA6 ESCs were stimulated for 6 h with doxycycline (+ dox) to induce PrE differentiation. After the removal of dox, 200 cells formed ICM organoids and were cultured for 24 h or 48 h. (A) GATA4 and SOX17 expression was found on the edge of the ICM organoids 24 h after formation. NANOG expression was found within the ICM organoids. (B) GATA4 and SOX17 expression was maintained 48 h after ICM organoid formation. Microscope: Zeiss LSM880; objective: 40×/1.3 oil differential interference contrast; scale bars, 20 μm. To see this figure in color, go online.
Figure 4
Figure 4
ICM organoids seeded with 50 cells show mutual exclusive expression and sorting. Mouse tet::GATA6 ESCs were stimulated for 6 h with doxycycline (+ dox) to induce PrE differentiation. ICM organoids were formed with 50 cells and kept undisturbed for 24 (A) and 48 h (B). ICM organoids show the two first phases: mutual exclusive expression and sorting of GATA6-positive cells. GATA4 and SOX17 expression was present at both stages. Microscope: Zeiss LSM880; objective: 40×/1.3 oil differential interference contrast; scale bars, 20 μm. To see this figure in color, go online.
Figure 5
Figure 5
ICM organoids show secretion of basement membrane component laminin. Mouse tet::GATA4 ESCs were stimulated for 6 h with doxycycline (+ dox) to induce PrE differentiation. Cells that were not stimulated with dox (− dox) served as controls. (A) Heterogeneous laminin distribution in 1-day-old ICM organoids at stage of mutual exclusive expression. (B) After 48 h of ICM organoid formation, secretion of laminin is restricted to the outer layer. (C) After 72 h, at the stage of NANOG downregulation, laminin layers of different thicknesses were detected between the PrE layer and inner Epi core (red arrows and red boxes, second and third rows). Different structures could be observed and indicate differentiation toward visceral endoderm (VE) and parietal endoderm (PE): aligned columnar cell structure (green box, first row), aligned cuboidal cell morphology (white arrows, third row, first column), and vacuoles (yellow arrows and box, third row). Characteristics for VE were columnar- or cuboidal-shaped cells and low laminin expression; for PE, they were smaller-sized cells and loosely connected to the Epi core and high laminin expression. For more details, please also see text. Images show a single slice from the ICM organoids’ center. Microscope: Zeiss LSM780; objective: 63×/1.40 oil; scale bars, 20 μm. To see this figure in color, go online.
Figure 6
Figure 6
ICM organoids show characteristics of epithelisation. Mouse tet::GATA4 ESCs were stimulated for 6 h with doxycycline (+ dox) to induce PrE differentiation. Cells that were not stimulated with dox (− dox) served as controls. Aggregates were formed and kept undisturbed for 72 h. ICM organoids show punctate patterns of ZO-1 at the outer cell layer (see zoomed regions in boxes and arrowheads). Control aggregates show continuous ZO-1 staining at the junctions (see zoomed regions in boxes and arrowheads). Images show single slices from the ICM organoid’s center. Microscope: Zeiss LSM780; objective: 63×/1.40 oil; scale bars, 20 μm. To see this figure in color, go online.
Figure 7
Figure 7
Lineage composition and spatial distribution of GATA6 and NANOG in ICM organoids resemble those of mid- and late mouse blastocysts. (A) Three-dimensional imaging and three-dimensional image analysis form the basis for a quantitative comparison between ICM organoids of mouse tet::GATA4 ES cells and blastocysts. Quantitative data of early, mid-, and late blastocysts were taken from Saiz et al. (22) (B) Fluorescence intensity levels of GATA6 and NANOG of individual cells in ICM organoids after 24 and 48 h. The data points are colored by cell population. (C and D) Lineage composition is shown as percentage of the total number of cells in ICM organoids after 24 and 48 h and in the ICM of early, mid-, and late blastocysts. (E and F) Lineage composition of neighboring cells is shown as percentage of the total of neighboring cells in ICM organoids after 24 and 48 h and the ICM of mid- and late blastocysts. The error bars indicate the standard error of the mean. The number of independent experiments for ICM organoids or blastocysts is, respectively, 76, 147. DN: double negative (NANOG−/GATA6−), DP: double positive (NANOG+/GATA6+), N+/G− (NANOG+/GATA6−), N−/G+ (NANOG−/GATA6+). To see this figure in color, go online.
Figure 8
Figure 8
Mutual exclusive pattern in 1-day-old ICM organoids exhibits local cell fate clustering. (A) Spatial distribution of NANOG-positive and negative cells or GATA6-positive and negative cells, respectively, in a 1-day-old ICM organoid (positive: N+/G− or G+/N−, respectively, and DP; negative: N−/G+ or G−/N+, respectively and DN) (B) Lineage composition of neighboring cells is shown as percentage of the total number of neighboring cells in ICM organoids after 24 h. The error bars indicate the standard error of the mean. (C) Simulation of three artificial patterns describing the salt-and-pepper patterning (for more information, please see Materials and Methods). A negative cell is NANOG-negative or GATA6-negative, respectively. A positive cell is NANOG-positive or GATA6-positive, respectively. (D) Lineage composition of neighboring cells is shown as percentage of the total of neighboring cells in the three simulated artificial patterns. The error bars indicate the standard error of the mean. (E) Statistical comparison of the data from 24-h-old ICM organoids with the three artificial patterns (∗∗p < 0.01, n.s.: not significant; for details, Wilcoxon-Mann-Whitney test with Bonferroni correction). (F) The closest fit of the simulated pattern to the experimental data is expressed as mean relative deviation, i.e., (s¯d¯)/d¯, where s¯ is the mean of the simulated data and d¯ the mean of the experimental data. Number of independent experiments for ICM organoids: 34. To see this figure in color, go online.
Figure 9
Figure 9
In vitro ICM organoids closely resemble the ICM of in vivo blastocyst stages during mouse preimplantation. A schematic representation of ICM organoid development relative to the different stages in the preimplantation mouse embryo. To see this figure in color, go online.

Similar articles

Cited by

References

    1. Jarvis G.E. Early embryo mortality in natural human reproduction: what the data say. F1000 Res. 2016;5:2765. - PMC - PubMed
    1. Simon C.S., Hadjantonakis A.K., Schröter C. Making lineage decisions with biological noise: lessons from the early mouse embryo. Wiley Interdiscip. Rev. Dev. Biol. 2018;7:e319. - PMC - PubMed
    1. Chazaud C., Yamanaka Y., Rossant J. Early lineage segregation between epiblast and primitive endoderm in mouse blastocysts through the Grb2-MAPK pathway. Dev. Cell. 2006;10:615–624. - PubMed
    1. Plusa B., Piliszek A., Hadjantonakis A.-K. Distinct sequential cell behaviours direct primitive endoderm formation in the mouse blastocyst. Development. 2008;135:3081–3091. - PMC - PubMed
    1. Guo G., Huss M., Robson P. Resolution of cell fate decisions revealed by single-cell gene expression analysis from zygote to blastocyst. Dev. Cell. 2010;18:675–685. - PubMed

Publication types