

MRI demonstrates glutamine antagonist-mediated reversal of cerebral malaria pathology in mice
- PMID: 30514812
- PMCID: PMC6304986
- DOI: 10.1073/pnas.1812909115
MRI demonstrates glutamine antagonist-mediated reversal of cerebral malaria pathology in mice
Abstract
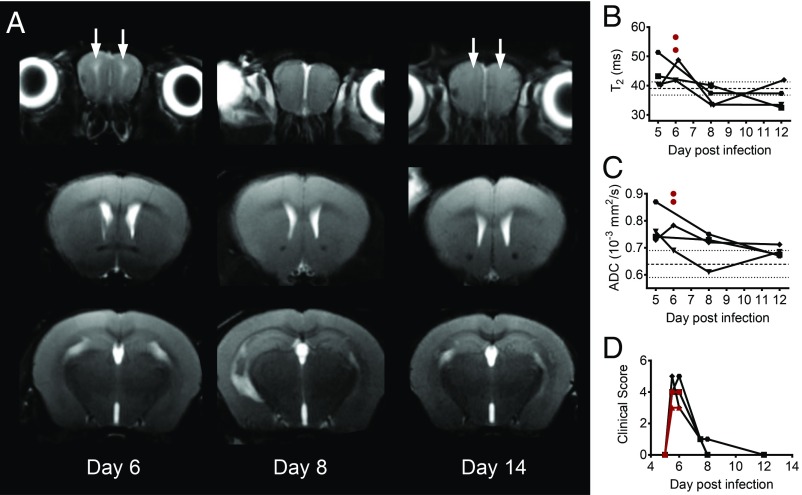
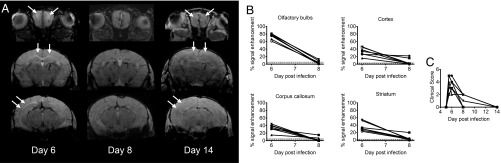
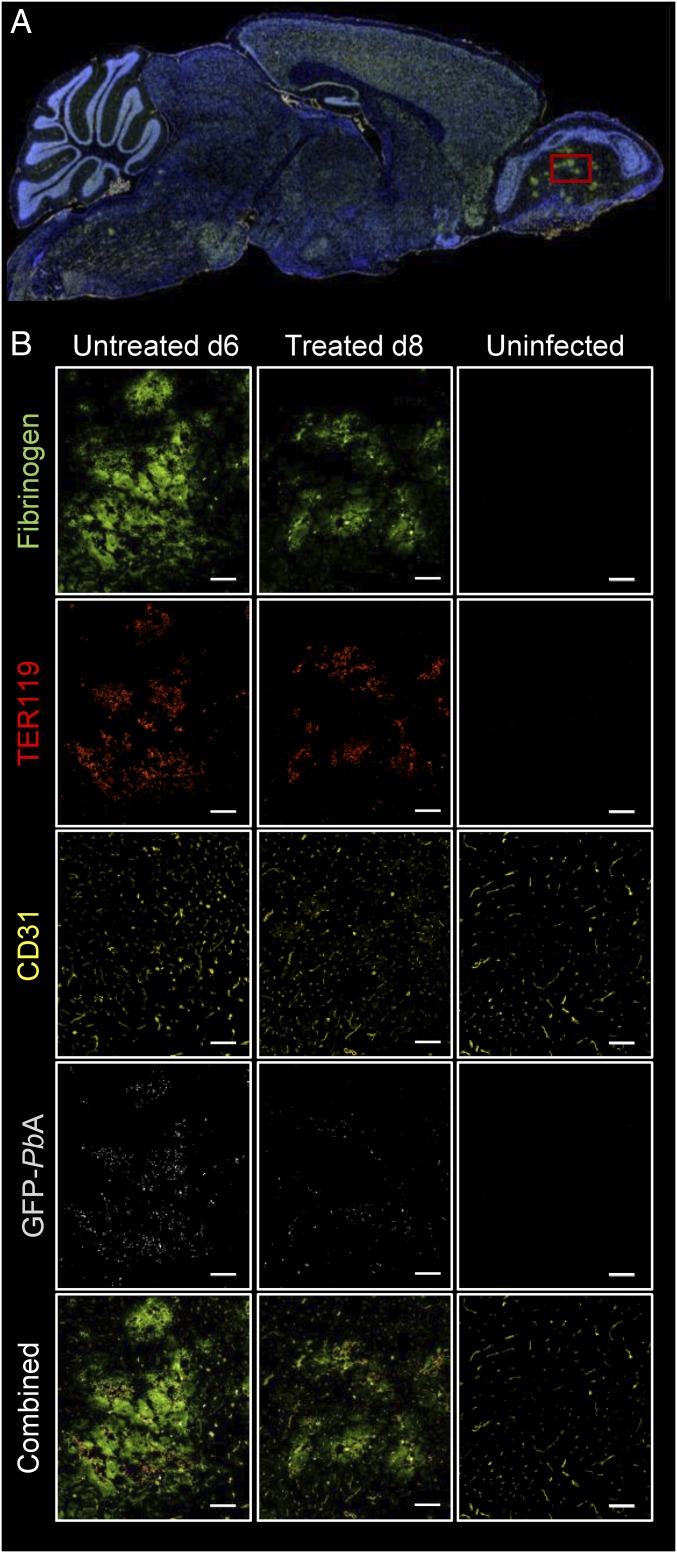
The deadliest complication of Plasmodium falciparum infection is cerebral malaria (CM), with a case fatality rate of 15 to 25% in African children despite effective antimalarial chemotherapy. No adjunctive treatments are yet available for this devastating disease. We previously reported that the glutamine antagonist 6-diazo-5-oxo-l-norleucine (DON) rescued mice from experimental CM (ECM) when administered late in the infection, a time by which mice had already suffered blood-brain barrier (BBB) dysfunction, brain swelling, and hemorrhaging. Herein, we used longitudinal MR imaging to visualize brain pathology in ECM and the impact of a new DON prodrug, JHU-083, on disease progression in mice. We demonstrate in vivo the reversal of disease markers in symptomatic, infected mice following treatment, including the resolution of edema and BBB disruption, findings usually associated with a fatal outcome in children and adults with CM. Our results support the premise that JHU-083 is a potential adjunctive treatment that could rescue children and adults from fatal CM.
Keywords: MRI; Plasmodium falciparum; cerebral malaria; experimental cerebral malaria; glutamine antagonist.
Conflict of interest statement
Conflict of interest statement: B.S.S. and J.D.P. are founders of Dracen Pharmaceuticals, a company pursuing small molecule glutamine antagonists for clinical oncology applications.
Figures
Similar articles
-
Targeting glutamine metabolism rescues mice from late-stage cerebral malaria.Proc Natl Acad Sci U S A. 2015 Oct 20;112(42):13075-80. doi: 10.1073/pnas.1516544112. Epub 2015 Oct 5. Proc Natl Acad Sci U S A. 2015. PMID: 26438846 Free PMC article.
-
DON in pediatric cerebral malaria, a phase I/IIA dose-escalation safety study: study protocol for a clinical trial.Trials. 2024 Jan 26;25(1):87. doi: 10.1186/s13063-023-07808-w. Trials. 2024. PMID: 38279124 Free PMC article.
-
Eugenol disrupts Plasmodium falciparum intracellular development during the erythrocytic cycle and protects against cerebral malaria.Biochim Biophys Acta Gen Subj. 2021 Mar;1865(3):129813. doi: 10.1016/j.bbagen.2020.129813. Epub 2020 Dec 13. Biochim Biophys Acta Gen Subj. 2021. PMID: 33321150
-
Severe malaria: what's new on the pathogenesis front?Int J Parasitol. 2017 Feb;47(2-3):145-152. doi: 10.1016/j.ijpara.2016.08.002. Epub 2016 Sep 23. Int J Parasitol. 2017. PMID: 27670365 Free PMC article. Review.
-
An Update on Recent Advances for the Treatment of Cerebral Malaria.Mini Rev Med Chem. 2022;22(12):1607-1618. doi: 10.2174/1389557521666211124143117. Mini Rev Med Chem. 2022. PMID: 34819002 Review.
Cited by
-
CD8+ T cells target cerebrovasculature in children with cerebral malaria.J Clin Invest. 2020 Mar 2;130(3):1128-1138. doi: 10.1172/JCI133474. J Clin Invest. 2020. PMID: 31821175 Free PMC article. Clinical Trial.
-
Glutamine antagonism attenuates physical and cognitive deficits in a model of MS.Neurol Neuroimmunol Neuroinflamm. 2019 Aug 29;6(6):e609. doi: 10.1212/NXI.0000000000000609. Print 2019 Nov. Neurol Neuroimmunol Neuroinflamm. 2019. PMID: 31467038 Free PMC article.
-
Pipecolic Acid, a Putative Mediator of the Encephalopathy of Cerebral Malaria and the Experimental Model of Cerebral Malaria.J Infect Dis. 2022 Feb 15;225(4):705-714. doi: 10.1093/infdis/jiab615. J Infect Dis. 2022. PMID: 34932816 Free PMC article.
-
Contribution of Magnetic Resonance Imaging Studies to the Understanding of Cerebral Malaria Pathogenesis.Pathogens. 2024 Nov 27;13(12):1042. doi: 10.3390/pathogens13121042. Pathogens. 2024. PMID: 39770302 Free PMC article. Review.
-
Desperately Seeking Therapies for Cerebral Malaria.J Immunol. 2020 Jan 15;204(2):327-334. doi: 10.4049/jimmunol.1900829. J Immunol. 2020. PMID: 31907275 Free PMC article. Review.
References
-
- World Health Organization . World Malaria Report. WHO; Geneva: 2015.
-
- WHO Severe malaria. Trop Med Int Health. 2014;19:7–131. - PubMed
-
- Taylor TE. Caring for children with cerebral malaria: Insights gleaned from 20 years on a research ward in Malawi. Trans R Soc Trop Med Hyg. 2009;103:S6–S10. - PubMed
Publication types
MeSH terms
Substances
Grants and funding
LinkOut - more resources
Full Text Sources
Medical
