. 2018 Dec 18;115(51):E12111-E12120.
doi: 10.1073/pnas.1810379115. Epub 2018 Dec 4.

A unique ferredoxin acts as a player in the low-iron response of photosynthetic organisms

Affiliations

A unique ferredoxin acts as a player in the low-iron response of photosynthetic organisms

Michael Schorsch et al. Proc Natl Acad Sci U S A. .

Abstract

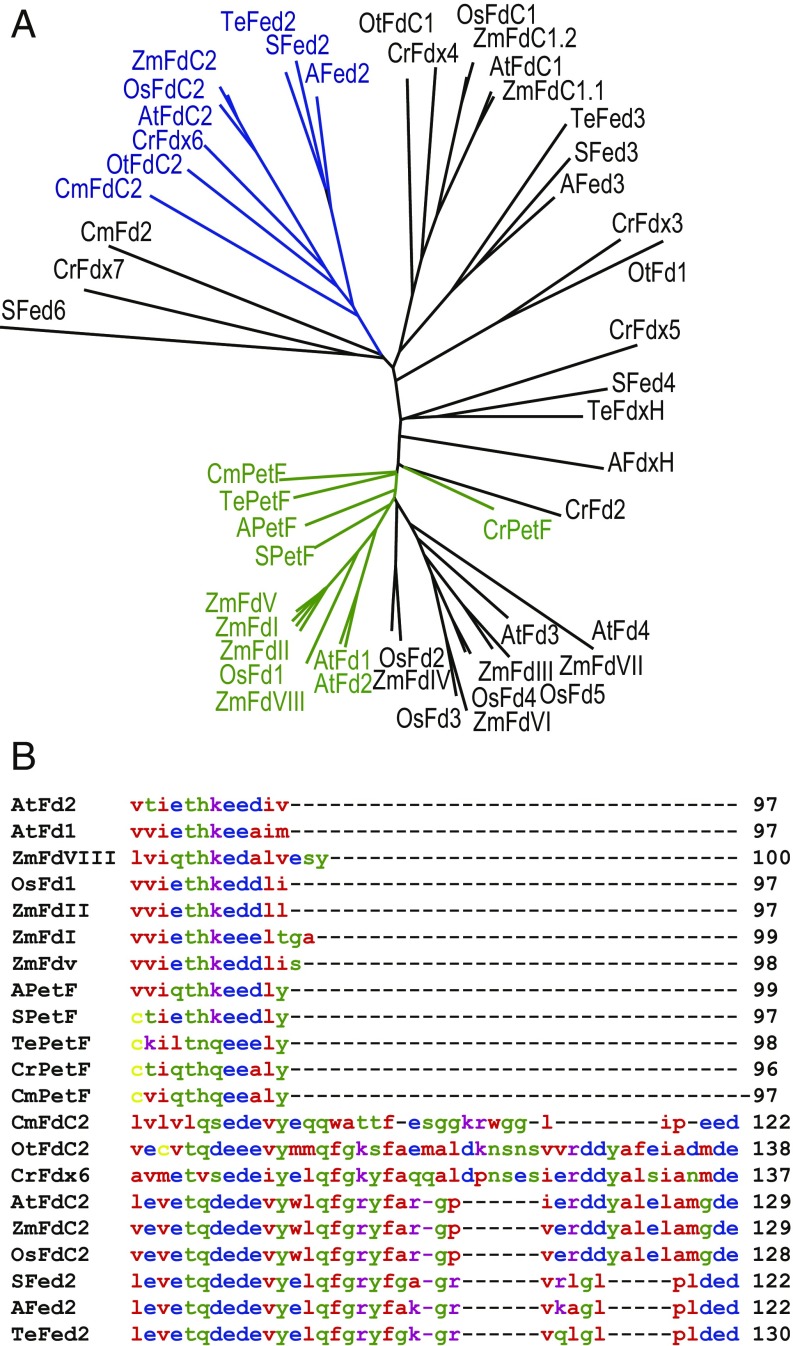
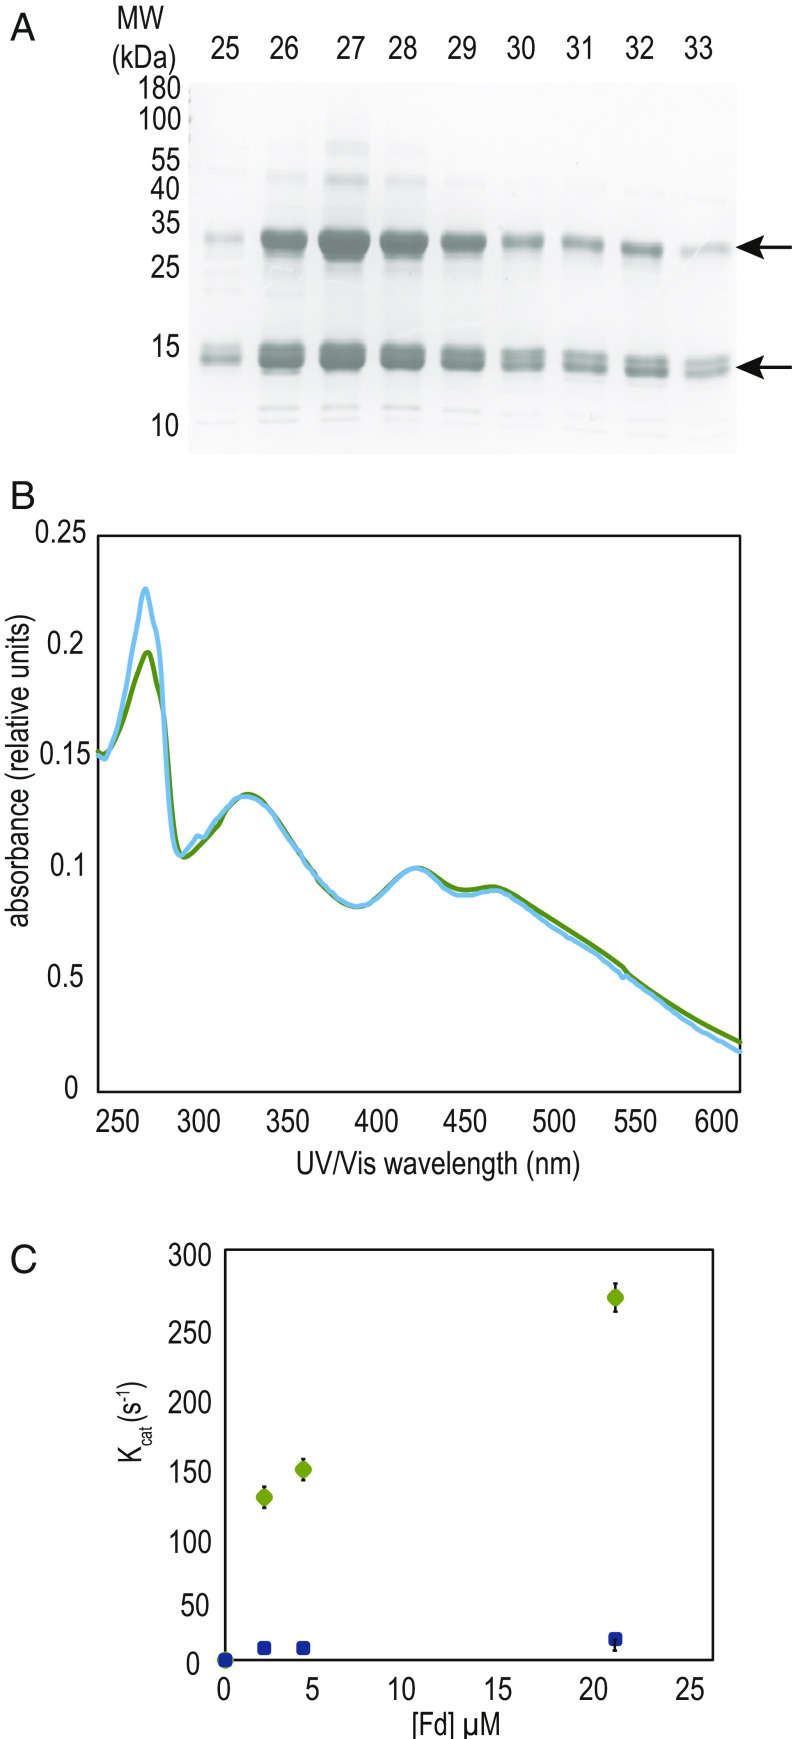
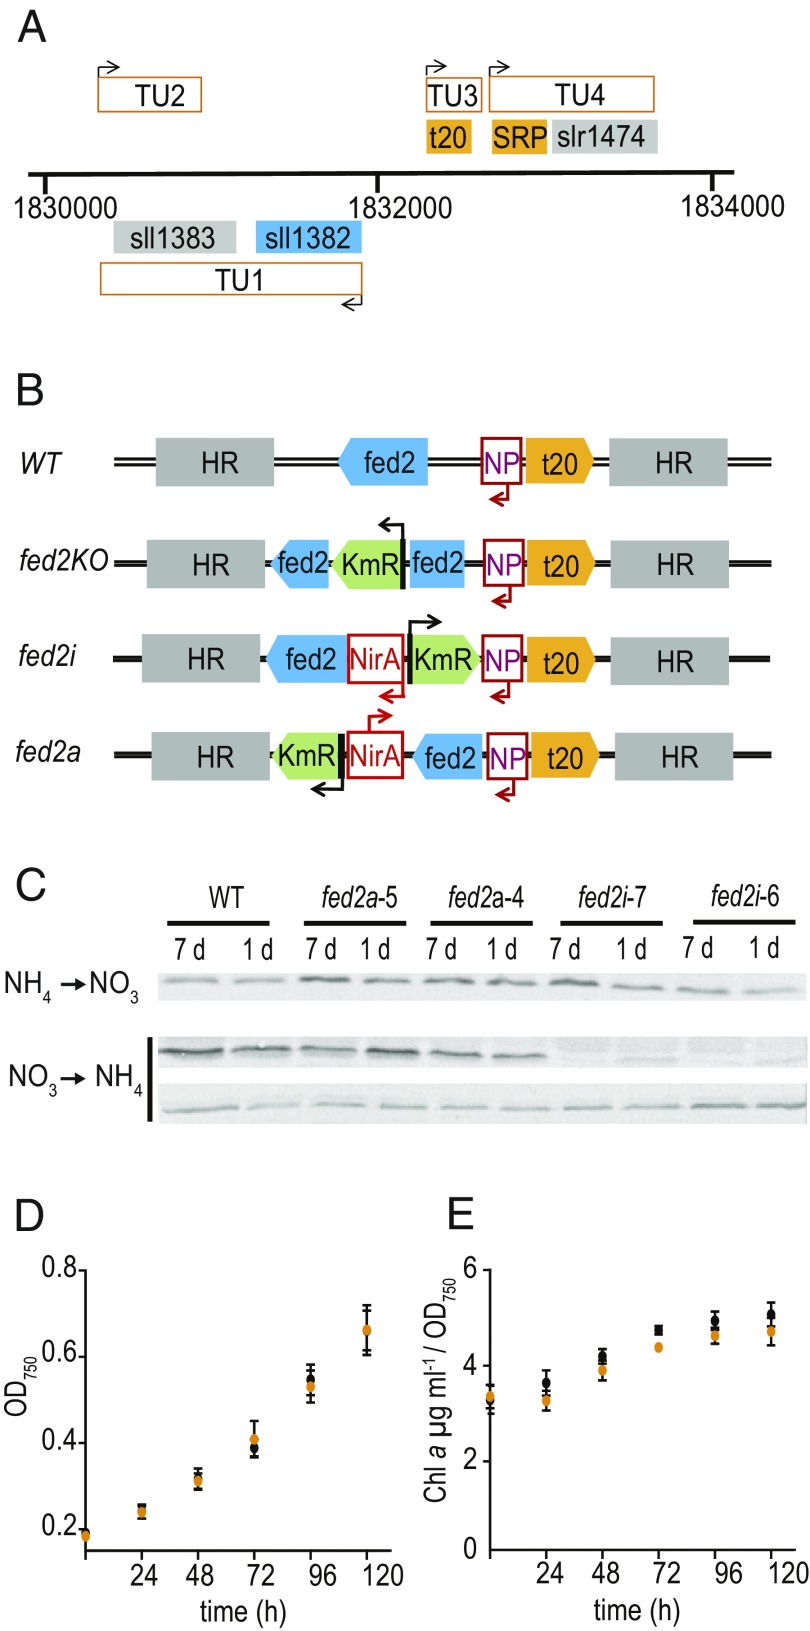
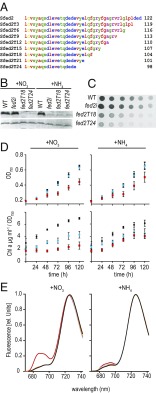
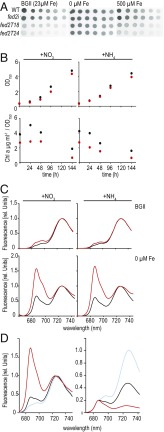
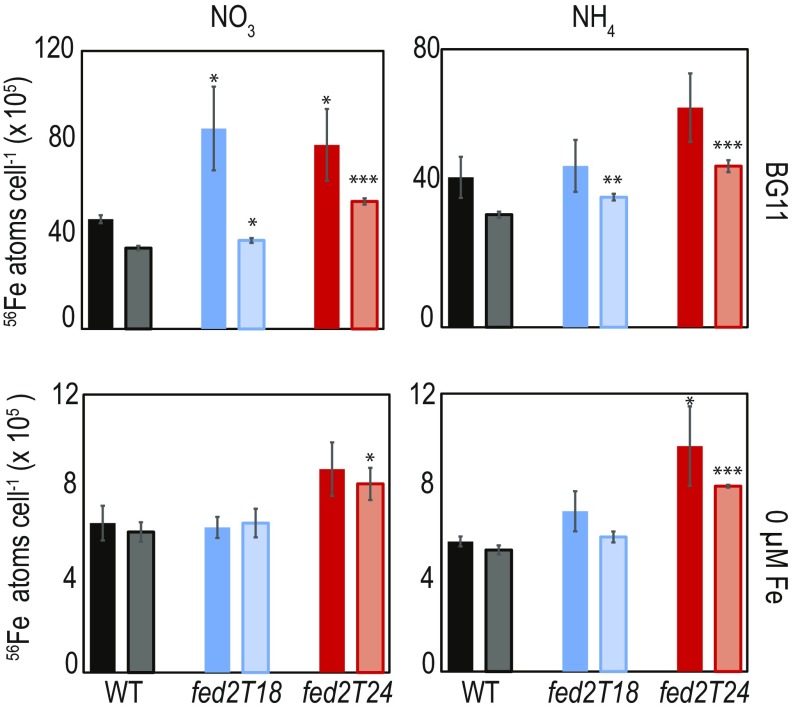
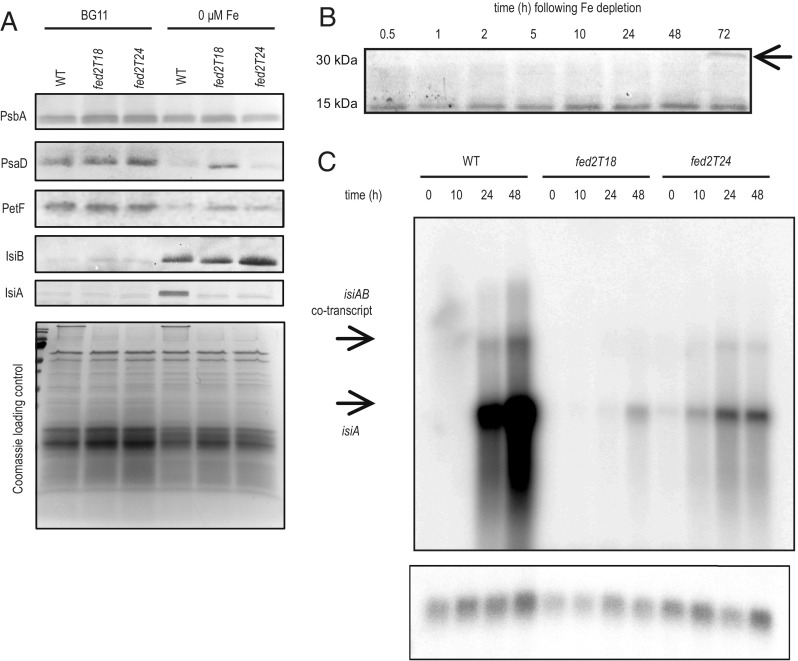
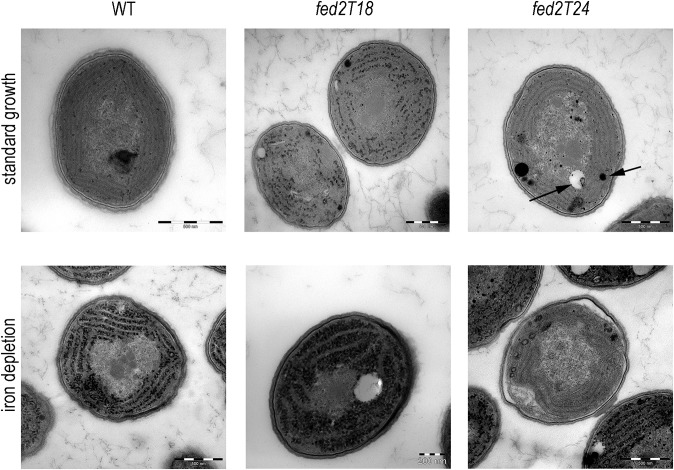
Iron chronically limits aquatic photosynthesis, especially in marine environments, and the correct perception and maintenance of iron homeostasis in photosynthetic bacteria, including cyanobacteria, is therefore of global significance. Multiple adaptive mechanisms, responsive promoters, and posttranscriptional regulators have been identified, which allow cyanobacteria to respond to changing iron concentrations. However, many factors remain unclear, in particular, how iron status is perceived within the cell. Here we describe a cyanobacterial ferredoxin (Fed2), with a unique C-terminal extension, that acts as a player in iron perception. Fed2 homologs are highly conserved in photosynthetic organisms from cyanobacteria to higher plants, and, although they belong to the plant type ferredoxin family of [2Fe-2S] photosynthetic electron carriers, they are not involved in photosynthetic electron transport. As deletion of fed2 appears lethal, we developed a C-terminal truncation system to attenuate protein function. Disturbed Fed2 function resulted in decreased chlorophyll accumulation, and this was exaggerated in iron-depleted medium, where different truncations led to either exaggerated or weaker responses to low iron. Despite this, iron concentrations remained the same, or were elevated in all truncation mutants. Further analysis established that, when Fed2 function was perturbed, the classical iron limitation marker IsiA failed to accumulate at transcript and protein levels. By contrast, abundance of IsiB, which shares an operon with isiA, was unaffected by loss of Fed2 function, pinpointing the site of Fed2 action in iron perception to the level of posttranscriptional regulation.

Keywords: FdC2; cyanobacteria; fed2; ferredoxin; iron.


Conflict of interest statement

The authors declare no conflict of interest.

Figures

Fig. 1.
Fig. 1.
Fed2/FdC2 proteins are highly conserved in photosynthetic organisms. (A) Unrooted phylogenetic tree of Fds from different photosynthetic organisms, highlighting known photosynthetic type (in green) and Fed2/FdC2 type (in blue). The tree was generated at the Phylodendron website using an alignment generated in Clustal Omega (62). Transit peptide amino acids were removed from eukaryotic proteins for accurate comparison of mature proteins. Fd isoproteins from different species are as follows: Synechocystis PCC 6803: SFed2 sll1382, SFed3 slr1828, SPetF ssl0020, SFed6 ssl2559, SFed4 slr0150; Anabeana PCC7120: Afed2 all2919, Afed3 alr0784, APetF all4148, AFdxH all1430; T. elongatus: TeFdxH WP_011057078.1, TePetF WP_011056851.1, TeFed3 WP_011056338.1, TeFed2 WP_011057493.1; C. reinhardtii: CrFdx6 ABC88605.1, CrPetF AAA33085.1, CrFdx2 ABC88601, CrFdx3 ABC88602, CrFdx4 ABC88603.1, CrFdx7 EDP05356, CrFdX5 ABC88604.1; Ostreochoccus tauri: OtFdC2 CAL53412.1, OtFdC1 CAL53607, OtFdI CAL58543.1; Cyanidioschyzon merolae: CmPetF CMV193c, CmFd2 CMR177c, CmFdC2 CMR278c; A. thaliana: AtFdC2 AT1G32550.1, AtFdC1 AT4G14890, AtFd1 AT1G10960, AtFd2 AT1G60950, AtFd3 AT2G27510, AtFd4 AT5G10000.1; O. sativa: OsFdC2 Os03g0685000, OsFdC1 Os03g0659200, OsFd1 Os08g0104600, OsFd2 Os04g0412200, OsFd3 Os05g0443500, OsFd4 Os03g0835900, OsFd5 Os01g0860601; and Zea mays: ZmFdC2 ACG28100.1, ZmFdC1.1 ACG25123, ZmFdC1.2 AAT42183, ZmFdI AAA33459.1, ZmFdII BAA32348.1, ZmFdIII BAA19251.1, ZmFdIV NP_001150016, ZmFdV ACA34366.1, ZmFdVI BAA19249.1, ZmFdVII ACF78894, ZmFdVIII ACN29244. (B) Comparison of the C-terminal region of photosynthetic Fds with Fed2/FdC2 proteins from the same Clustal Omega alignment. Amino acid coloring is as follows: red, small and hydrophobic; blue, acidic; magenta, basic; yellow, cysteine; and green, other polar (full alignment shown in SI Appendix, Fig. S1); same protein codes as in A.
Fig. 2.
Fig. 2.
Unusual properties of the recombinant purified Fed2 protein. (A) Coomassie-stained SDS/PAGE gel showing two bands in eluting fractions from size exclusion chromatography in the final step of recombinant T. elongatus Fed2 (TFed2) purification. (B) Comparison of UV-Vis spectra of recombinant purified PetF (green), cloned from Synechocystis sp.PCC 6803, and TeFed2 (blue). Spectra measured at 0.1 mM concentration. (C) Electron transport between FNR and Fds. Activity was measured in cytochrome c coupled assay with 20 nM FNR over a range of concentrations of Synechocystis PetF (green circles) and TeFed2 (blue squares).
Fig. 3.
Fig. 3.
Genomic environment and disruption of fed2 in Synechocystis. (A) Genomic context of fed2 in Synechocystis. The sll1382 (fed2) and sll1383 (suhB) form a single transcriptional unit (TU1). In the region 5′ from fed2 there are two more transcriptional units. One encodes a unique t-RNA-Ser (t20) and the other a predicted signal recognition particle (SRP) in combination with slr1471, a protein of unknown function. (B) Strategies for fed2 knockdown and knockout. Arrows show direction of promoter action; HR, homologous region taken for cloning; KmR, kanamycin resistance; NP, fed2 native promoter; NirA, nitrate responsive promoter. From top to bottom: WT genomic arrangement, knockout insertion of KmR, inducible knockdown by replacing the native promoter with NirA, and inducible antisense by introduction of the NirA promoter 3′ of fed2 in the anticoding direction. (C) Protein abundance of Fed2 following transfer of single colony derived cultures of inducible antisense and inducible expression lines between inducing and noninducing media, detected by Western blotting for Fed2 (see SI Appendix, Fig. S3 for segregation of strains). For nitrate to ammonium transfer, Top is Fed2 and Bottom is a loading control of a nonspecific band on the same blot. (D) Growth and (E) chlorophyll content of Synechocystis WT (black) and fed2i (orange) cells following transfer to ammonium media (suppression of fed2 expression in fed2i line). Chlorophyll a content is expressed as a function of the cell density. Values are mean ± SD of at least three independent measurements. Data from ref. .
Fig. 4.
Fig. 4.
Truncation of Fed2 results in perturbed growth. (A) Sequential truncation of the Fed2 protein by three amino acid steps. (B) Western blot analysis of Fed2 content in fully segregated fed2T18, fed2T24, and fed2i lines (see SI Appendix, Fig. S3 for segregation analysis). Cells were cultivated for 1 wk in liquid media supplemented with either nitrate or ammonium. Following SDS/PAGE gel (20 µg of total protein per lane) and Western blotting, proteins were visualized via a secondary antibody conjugated to alkaline phosphatase. Top is Fed2, and Bottom is a loading control of a nonspecific band on the same blot. (C) Growth of Synechocystis WT, fed2i, fed2T18, and fed2T24 truncation lines. A cell suspension of 0.2 µg⋅mL−1 of chlorophyll was plated in a dilution series on regular BG11 plates followed by 1 wk of growth. (D) Growth and pigment analysis of the same lines as in C, cultivated in liquid media containing either nitrate or ammonium as a N source. WT (black circles), fed2T18 (blue circles), and fed2T24 (red squares). Precultured cells (grown in ammonium-containing media) were washed in nitrogen-free BG11 media and subsequently diluted to an OD750 of 0.2 in media containing either nitrate or ammonium. Growth rate was monitored for 5 d. Chlorophyll a content is expressed as a function of the cell density. Values are mean ± SD of at least three independent measurements. (E) The 77 K fluorescence emission spectra of Synechocystis WT (black), inducible fed2i (orange), and truncation lines fed2T18 and fed2T24 (blue and red, respectively) grown for 7 d in media containing either nitrate (Left) or ammonium (Right) as N source. Cells were adjusted to a chlorophyll a content of 3 µg⋅mL−1. The excitation wavelength was 430 nm. Each spectrum shown is the mean of five spectra, normalized to the characteristic PSI fluorescence peak emitted at 725 nm.
Fig. 5.
Fig. 5.
Truncated Fed2 perturbs adaptation to low iron. (A) Twofold dilution series of Synechocystis WT, fed2i inducible knockdown, and truncated fed2 lines fed2T18 and fed2T24. Cell suspensions of 2 µg⋅mL−1 of chlorophyll were spotted onto BG11 plates with the indicated iron concentrations. Plates were scanned after 7 d of growth. (B) Growth and pigment analysis comparing WT and the Fed2 truncation line fed2T24 cultivated in liquid media containing either nitrate or ammonium as a N source; WT, black; fed2T24, red. Precultured cells (grown in ammonium-containing media) were washed in nitrogen-free BG11 media and subsequently diluted to an OD750 of 0.2 in media containing either nitrate or ammonium in the indicated iron concentrations. Growth rate was monitored for 5 d. Chlorophyll a content is expressed as a function of the cell density. Results are typical of three independent experiments. (C) The 77 K fluorescence emission spectra of Synechocystis WT (black) and truncation line fed2T24 (red) grown for 7 d in media containing either nitrate or ammonium as N source in the indicated iron concentrations. Cells were adjusted to a chlorophyll a content of 5 µg⋅mL−1. The excitation wavelength was 430 nm. Experiments were performed three times with basically the same result. (D) Comparison of 77 K spectra from WT (black), fed2T18 (blue), and fed2T24 (red) lines following 1 wk of growth in liquid media lacking iron, normalized to the PSI emission peak of 720 nm (Left) and the PSII emission peak of 685 nm (Right). Experiments were performed three times with basically the same result.
Fig. 6.
Fig. 6.
Iron content of Synechocystis WT (black) and Fed2 truncation lines fed2T18 (blue) and fed2T24 (red) as measured by ICP-MS. Cells were precultured in liquid BG11 before washing three times in minimal BG11 media without iron or copper and subsequently diluted to an OD750 of 0.5 in regular BG11 or BG11 lacking iron. After 1 wk of growth, 500 μL of the cell culture was harvested and washed two times with either chelex-treated water (solid colors) for total cellular Fe, or 5 mM EDTA (pH 8.0) (pale colors) to remove periplasmic iron. Cells were resuspended in 200 μL of chelex-treated water and analyzed by ICP-MS. Values are mean ± SE of three independent measurements. Values are typical of two independent experiments. Statistically significant differences from WT in a Students t test: *P < 0.05; **P < 0.01; ***P < 0.001.
Fig. 7.
Fig. 7.
Truncation of Fed2 results in perturbed transcriptional responses to iron concentrations. (A) Western blot analysis of photosynthetic components. WT, fed2T18, and fed2T24 lines were grown in regular BG11 and BG11 containing no iron, with NO3 as a N source. Cells were diluted to the same OD750 in fresh BG11 and washed once before harvesting. Subsequently, cell pellets were treated with SDS-loading buffer and boiled for 5 min before SDS/PAGE. After electrophoresis, proteins were either subject to Western blotting and the indicated proteins were visualized using specific primary antibodies raised against PsbA, PsaD, PetF, IsiB, and IsiA, with a secondary antibody conjugated to alkaline phosphatase (Top), or stained with Coomassie brilliant blue as a loading control (Bottom). Results are typical of three independent experiments. (B) Fed2 abundance responds to iron starvation. Western blot was performed to detect Fed2 in protein samples taken from WT Synechocystis cells following transfer to no-iron BG11. Cells were precultured in iron-containing ammonium BG11 media before washing in iron-free media and transfer to iron-free BG11. Sampling was performed at indicated time points. Results are typical of three independent experiments. (C) The isiA transcript responses detected by Northern blotting at the indicated time points following transfer of the cells to no-iron-containing media (Top). RnpB detection as control (Bottom). Results are typical of two independent experiments.
Fig. 8.
Fig. 8.
Impact of Fed2 truncation on cyanobacterial cell structure. Synechocystis WT, fed2T18, and fed2T24 lines were transferred to BG11 with NO3 as a N source, either with iron (Top) or in the absence of iron (Bottom), for 7 d before fixation and treatment for TEM. Typical phenotypes are displayed. Arrows on fed2T24 cell in standard growth media indicate typical spherical inclusions of high or low density interpreted as inclusion bodies. Additional cells are shown in SI Appendix, Fig. S6.

References

    1. Lyons TW, Reinhard CT, Planavsky NJ. The rise of oxygen in Earth’s early ocean and atmosphere. Nature. 2014;506:307–315. - PubMed
    1. Norman L, Cabanesa DJ, Blanco-Ameijeiras S, Moisset SA, Hassler CS. Iron biogeochemistry in aquatic systems: From source to bioavailability. Chimia (Aarau) 2014;68:764–771. - PubMed
    1. Margulis L. Symbiotic theory of the origin of eukaryotic organelles; criteria for proof. Symp Soc Exp Biol, 1975:21–38. - PubMed
    1. Falkowski PG, Barber RT, Smetacek V. Biogeochemical controls and feedbacks on ocean primary production. Science. 1998;281:200–207. - PubMed
    1. Coale KH, et al. A massive phytoplankton bloom induced by an ecosystem-scale iron fertilization experiment in the equatorial Pacific Ocean. Nature. 1996;383:495–501. - PubMed

Publication types

LinkOut - more resources