. 2018 Dec 4;9(1):5163.
doi: 10.1038/s41467-018-07634-8.

The preeminence of ethnic diversity in scientific collaboration

Affiliations

The preeminence of ethnic diversity in scientific collaboration

Bedoor K AlShebli et al. Nat Commun. .

Abstract

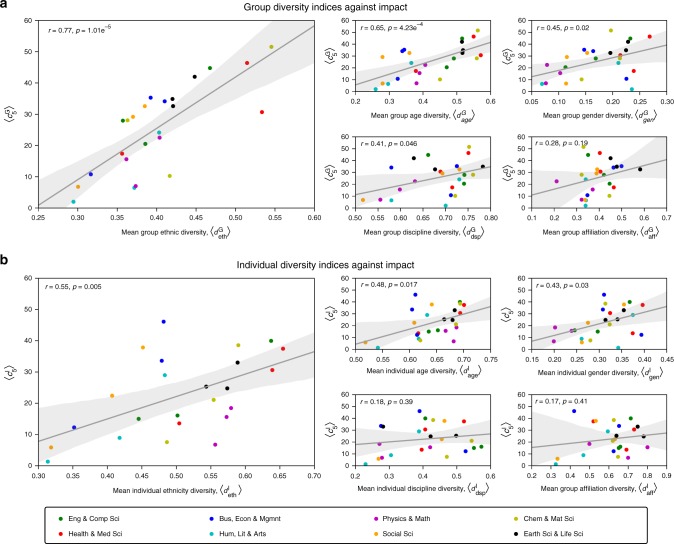
Inspired by the social and economic benefits of diversity, we analyze over 9 million papers and 6 million scientists to study the relationship between research impact and five classes of diversity: ethnicity, discipline, gender, affiliation, and academic age. Using randomized baseline models, we establish the presence of homophily in ethnicity, gender and affiliation. We then study the effect of diversity on scientific impact, as reflected in citations. Remarkably, of the classes considered, ethnic diversity had the strongest correlation with scientific impact. To further isolate the effects of ethnic diversity, we used randomized baseline models and again found a clear link between diversity and impact. To further support these findings, we use coarsened exact matching to compare the scientific impact of ethnically diverse papers and scientists with closely-matched control groups. Here, we find that ethnic diversity resulted in an impact gain of 10.63% for papers, and 47.67% for scientists.


Conflict of interest statement

The authors declare no competing interests.

Figures

Fig. 1
Fig. 1
Exploring homophily in real vs. randomized data. Each column corresponds to a different class of diversity, and each row presents the results of a specific set of experiments whereby dxG:x{eth,age,gen,aff} in real data is compared against randomized data. a Cumulative distributions of dxG. b Change in mean diversity dxG over time. c Mean diversity dxG for papers with different number of authors
Fig. 2
Fig. 2
Group vs. individual diversity. For any given class of diversity, x ∈ {eth, age, gen, dsp, aff}, differences in color represent differences in terms of x. The group diversity index dxG of Paper A is higher than that of Paper B. The individual diversity index of Scientist C is higher than that of Scientist D
Fig. 3
Fig. 3
Group and individual diversity vs. impact in each subfield. In each subplot, the points correspond to subfields, the color indicates the main field, while the solid line and the shaded area represent the regression line and the 95% confidence interval, respectively. Each regression has also been annotated with the corresponding Pearson’s r and p values. a For each subfield, the subplots depict the mean group diversity indices, dethG, dageG, dgenG, ddspG and daffG, against the mean 5-year citation count, c5G, taken over papers in that subfield. b For each subfield, the subplots depict the mean individual diversity indices, dethI, dageI, dgenI, ddspI and daffI, against the mean 5-year citation count, c5I, taken over scientists in that subfield
Fig. 4
Fig. 4
The relationship between ethnic diversity and impact. a Distribution of dethG in real data. Papers were partitioned into two categories: diverse (highlighted in the darker tones, with dethG>d~ethG) and non-diverse (highlighted in the lighter tones, with dethGd~ethG), where the tilde denotes the median. b The same as (a), but for randomized data. c and d The same as (a, b), respectively, but with dethI instead of dethG. e c5G against publication year in real data. f The same as (e), but for randomized data. g c5G against number of authors per paper in real data. h The same as (g), but for randomized data. i c5I against number of collaborators per scientist in real data. j The same as (i), but for randomized data
Fig. 5
Fig. 5
The interplay between group and individual ethnic diversity. The top part of the figure illustrates an example of 4 papers. The authors of paper A have different ethnicities, but each has ethnically homogeneous collaborators. Then, one could argue that paper A has high dethG but low dethIpaper. Similarly, paper B has low dethG and low dethIpaper, paper C has low dethG and high dethIpaper, and paper D has high dethG and high dethIpaper. The matrix at the bottom-right corner represents the mean citation counts, c5G, of papers falling in different ranges of dethG and dethIpaper

References

    1. Wagner CS, Jonkers K. Open countries have strong science. Nature. 2017;550:32–33. doi: 10.1038/550032a. - DOI - PubMed
    1. Puritty C, et al. Without inclusion, diversity initiatives may not be enough. Science. 2017;357:1101–1102. doi: 10.1126/science.aai9054. - DOI - PubMed
    1. Page, S. E. The Difference: How the Power of Diversity Creates Better Groups, Firms, Schools, and Societies (Princeton University Press, Princeton, 2008).
    1. Ager P, Brückner M. Cultural diversity and economic growth: evidence from the US during the age of mass migration. Eur. Econ. Rev. 2013;64:76–97. doi: 10.1016/j.euroecorev.2013.07.011. - DOI
    1. Lee N. Migrant and ethnic diversity, cities and innovation: firm effects or city effects? J. Econ. Geogr. 2014;15:769–796. doi: 10.1093/jeg/lbu032. - DOI