. 2019 Feb;29(2):136-150.
doi: 10.1038/s41422-018-0120-9. Epub 2018 Dec 4.

Ubiquitination of Rheb governs growth factor-induced mTORC1 activation

Affiliations

Ubiquitination of Rheb governs growth factor-induced mTORC1 activation

Lu Deng et al. Cell Res. 2019 Feb.

Abstract

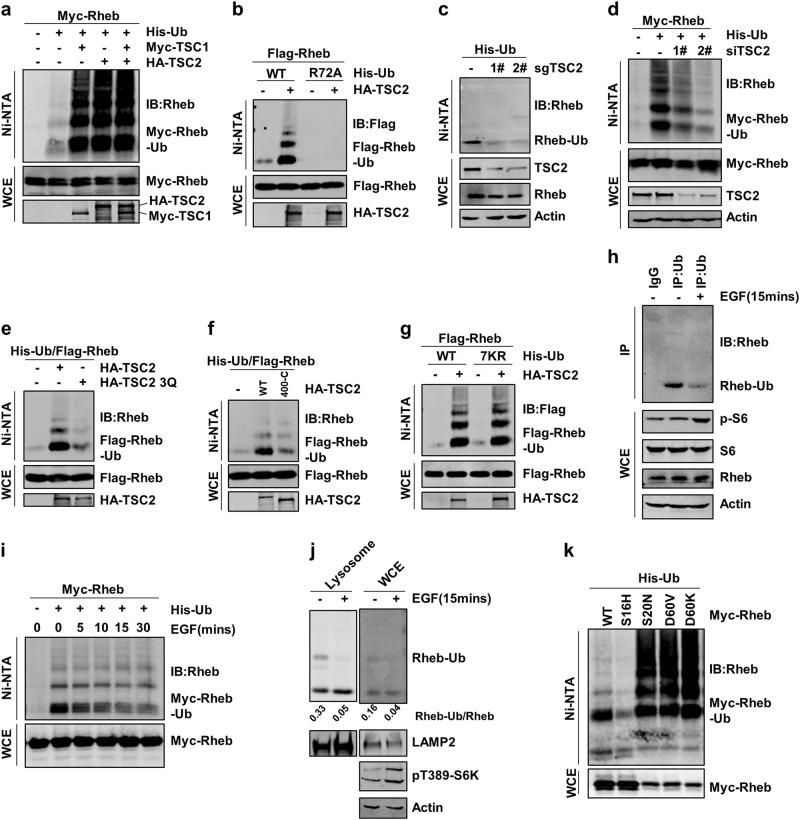
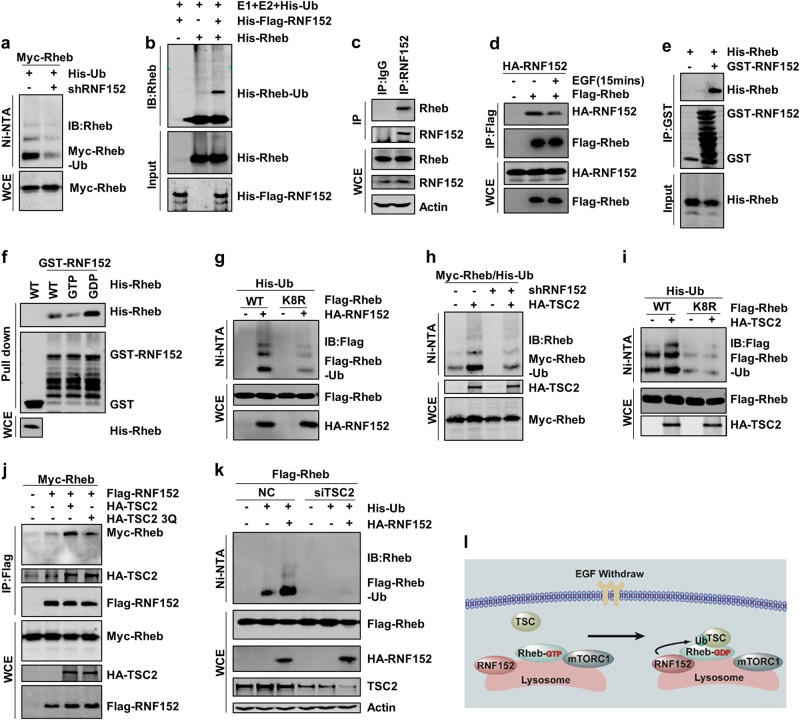
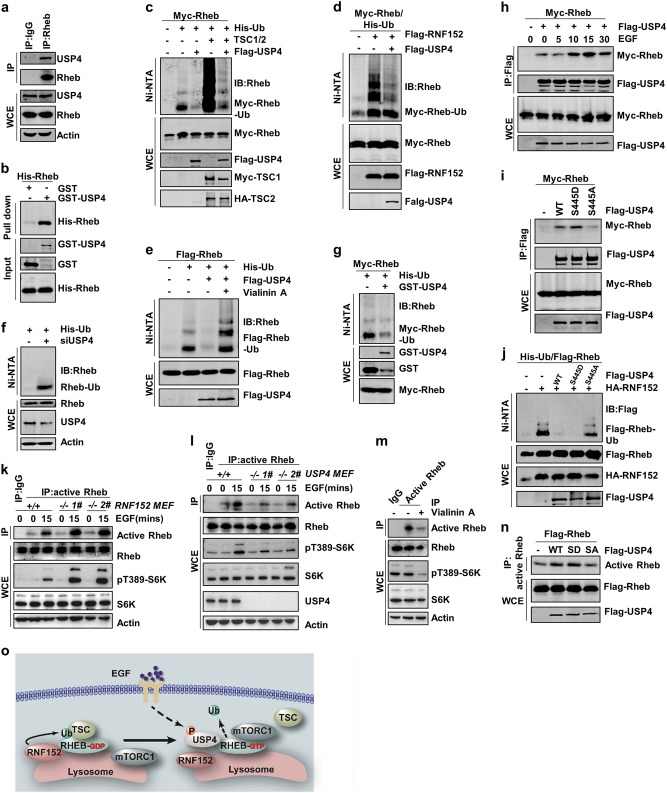
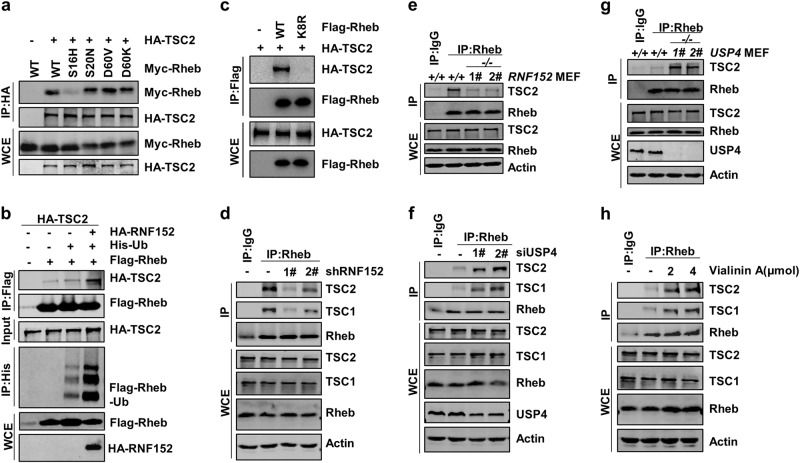
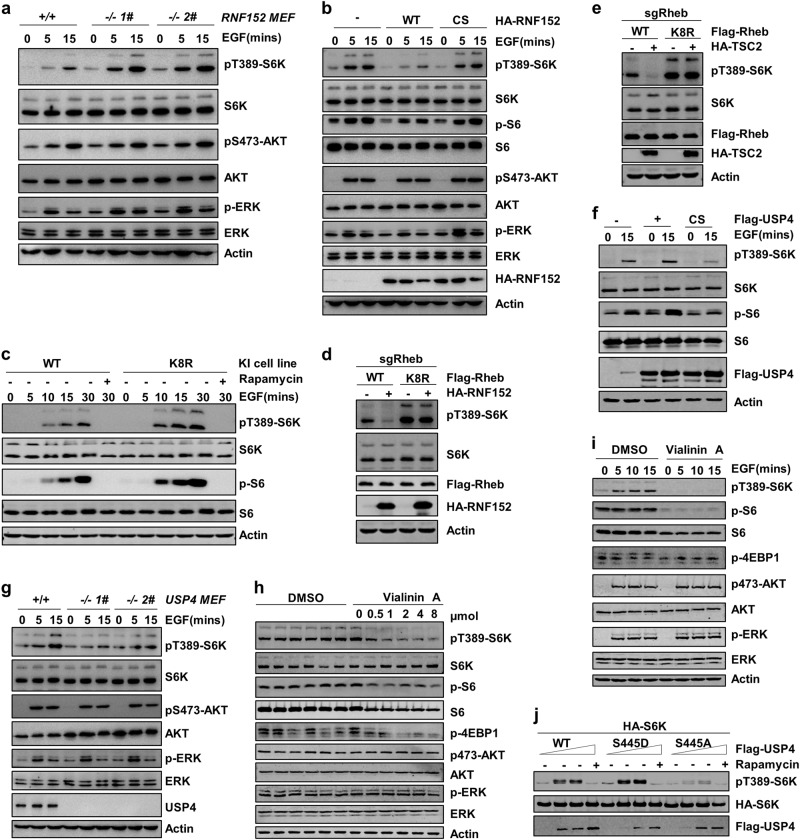
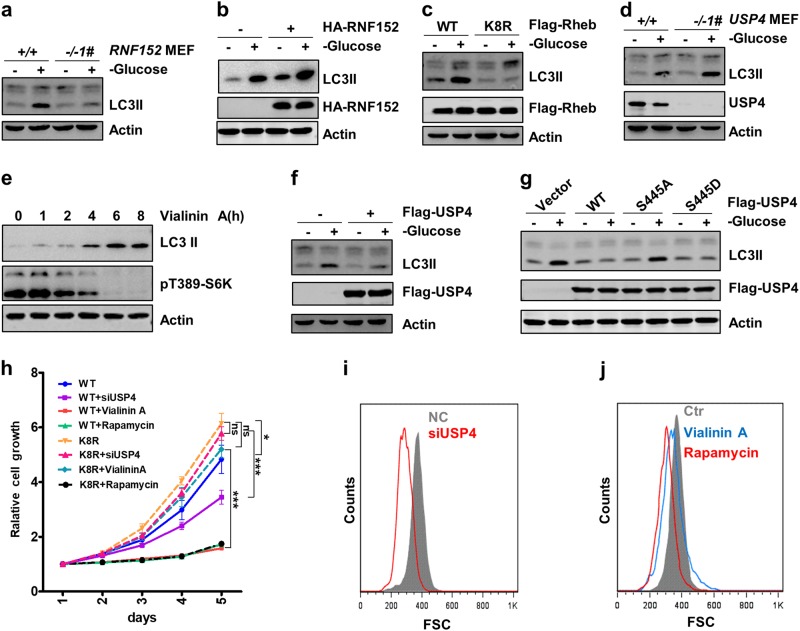
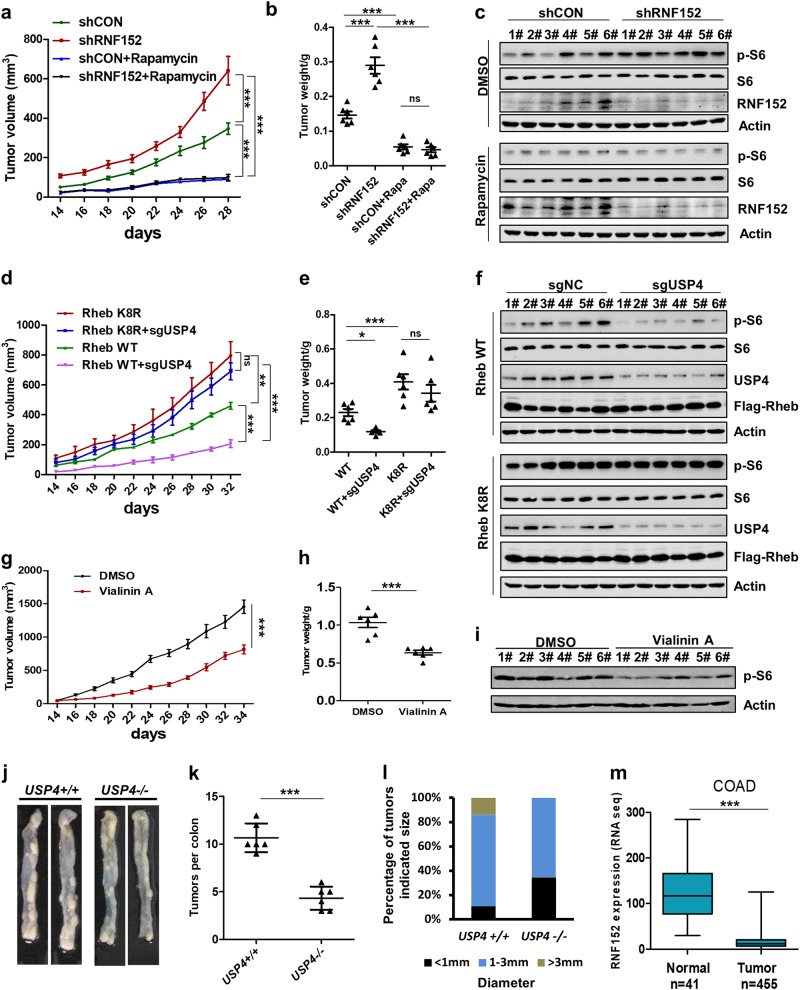
Mechanistic target of rapamycin mTOR complex 1 (mTORC1) plays a key role in the integration of various environmental signals to regulate cell growth and metabolism. mTORC1 is recruited to the lysosome where it is activated by its interaction with GTP-bound Rheb GTPase. However, the regulatory mechanism of Rheb activity remains largely unknown. Here, we show that ubiquitination governs the nucleotide-bound status of Rheb. Lysosome-anchored E3 ligase RNF152 catalyzes Rheb ubiquitination and promotes its binding to the TSC complex. EGF enhances the deubiquitination of Rheb through AKT-dependent USP4 phosphorylation, leading to the release of Rheb from the TSC complex. Functionally, ubiquitination of Rheb is linked to mTORC1-mediated signaling and consequently regulates tumor growth. Thus, we propose a mechanistic model whereby Rheb-mediated mTORC1 activation is dictated by a dynamic opposing act between Rheb ubiquitination and deubiquitination that are catalyzed by RNF152 and USP4 respectively.


Conflict of interest statement

The authors declare no competing interests.

Figures

Fig. 1
Fig. 1
TSC complex and EGF signaling promote the ubiquitination of Rheb. a TSC1 and TSC2 promoted Rheb ubiquitination in HEK293T cells. The ubiquitinated proteins were purified under the denature condition via Ni-NTA agarose beads and were analyzed by Western Blotting. b Co-transfection of HA-TSC2, Myc-Rheb, Ub-WT, or Ub-R72A mutants to detect Rheb ubiquitination, Rheb ubiquitination was analyzed as in (a). c, d Rheb ubiquitination was detected in TSC2 knockdown cells. e, f Ubiquitination of Rheb was detected by co-transfection of TSC2-WT, TSC2-3Q mutant (e) or TSC2(400-C) mutant (f) in HEK293T cells. g The linkage-specific ubiquitination of Rheb was examined in HEK293T cells. h, i Ubiquitination of endogenous (h) and exogenous (i) Rheb was detected in HEK293T cells with the treatment of EGF. j Rheb ubiquitination level was detected in lysosome samples enriched from cells with or without EGF treatment. k Ubiquitination of WT, active (S16H) and inactive (D60V, D60K, S20N)) forms of Rheb was analyzed via Ni-NTA
Fig. 2
Fig. 2
RNF152 is involved in TSC2-mediated Rheb ubiquitination. a Rheb ubiquitination was detected in RNF152 knockdown cells. The knockdown efficiency of RNF152 was detected via RT-PCR in Supplementary information, Fig. S2d. b RNF152 enhanced Rheb ubiquitination in vitro. c, d Endogenous(c) and exogenous (d) interaction between Rheb and RNF152 was examined in HEK293T cells with EGF stimulation. e RNF152 could specifically interact with His-tagged Rheb detected by GST pull-down assay. f Pull-down assay was performed to detect the interaction between GST-RNF152 and His-Rheb, and Rheb was loaded with GDP or GTP in advance. g Rheb-K8R displayed lower ubiquitination level than Rheb-WT when co-expressed with RNF152. h TSC2-induced Rheb ubiquitination decreased in RNF152 knockdown HEK293T cells. The knockdown efficiency was detected by RT-PCR in Supplementary information, Fig. S2d. i Ubiquitination of Rheb-WT or Rheb-K8R mutant was detected with or without TSC2 in HEK-293T cells. j Co-IP assay was performed to test the interaction between Rheb and RNF152 after co-expressed with TSC2 or TSC2-3Q mutant. k Ubiquitination of Rheb was detected in TSC2-depleted HEK293T cell line. l The model of Rheb ubiquitination: TSC complex inactivates Rheb in the absence of EGF, which consequently promotes Rheb-GDP to interact with RNF152 followed by subsequent Rheb ubiquitination
Fig. 3
Fig. 3
USP4 promotes Rheb activation through removing the ubiquitin from Rheb. a The endogenous interaction between USP4 and Rheb was analyzed via Co-IP assay. b The interaction between USP4 and Rheb was analyzed via pull-down assay. c, d USP4 reversed the effect of TSC2 (c) and RNF152 (d) on Rheb ubiquitination in HEK293T cells. e Vialinin A blocked the effects of USP4 on Rheb deubiquitination. f Endogenous ubiquitination of Rheb was increased in USP4-depleted HEK293T cells. g USP4 directly removed the ubiquitin from Rheb in vitro. h The interaction between Rheb and USP4 was analyzed under EGF treatment for indicated time periods. i The interaction between Rheb and USP4-WT, USP4-S445A, and USP4-S445D. j The effects of USP4-WT, USP4-S445A, and USP4-S445D on RNF152-mediated ubiquitination of Rheb in HEK293T cells. k, l The activation of Rheb was measured in RNF152 deficient (k) or USP4 deficient MEF cells (l) with EGF treatment for indicated time. RNF152-KO MEF cells were analyzed via genomic DNA PCR in Supplementary information, Fig. S3s. m Vialinin A reduced the activation of endogenous Rheb. n The activation of Rheb was measured in HEK293T cells co-expressing Flag-Rheb with USP4-WT or USP4 mutants, respectively. o The model of Rheb deubiquitination by USP4
Fig. 4
Fig. 4
Ubiquitinated Rheb promotes its interaction with TSC. a Co-IP assay was performed to analyze the binding of TSC2 to different forms of Rheb mutants (active form: S16H; inactive form: D60V, D60K, S20N). b TSC2 purified from HEK293T cells showed stronger binding affinity to the ubiquitinated Rheb. c Rheb-K8R mutant showed weaker binding affinity to TSC2 as compared with Rheb-WT. d, e RNF152 Knockdown (d) or knockout (e) reduced the binding bewteen Rheb and TSC2. The knockdown efficiency was detected by RT-PCR in Supplementary information, Fig. S2e. RNF152-KO MEF cells were analyzed via genomic DNA PCR in Supplementary information, Fig. S3s. fh USP4 knockdown (f), knockout (g) or inactivation of USP4 by Vialinin A (h) promoted the binding of Rheb to TSC2
Fig. 5
Fig. 5
RNF152 and USP4 regulate mTORC1 activation. a EGF-induced mTORC1 activation was measured in primary WT or RNF152−/− MEF cells. RNF152 knockout was analyzed via genomic DNA PCR in Supplementary information, Fig. S3s. b Overexpressing RNF152, but not the E3 ligase dead mutant RNF152-CS, reduced EGF-induced mTORC1 activation in HEK293T cells. c The activation of mTORC1 induced by EGF was analyzed in Rheb-WT or Rheb-K8R knockin HEK293T cells. d, e Activation of mTORC1 induced by Rheb-K8R was resistant to RNF152 (d) and TSC2 (e). f Overexpressing USP4-WT, not USP4-CS, enhanced EGF-induced mTORC1 activation. g EGF-induced mTORC1 activation was detected in WT and USP4 deficient primary MEF cells. h, i mTORC1 activation was measured after treatment with different doses of Vialinin A for 4 h in HEK293T cells. j The effects of different USP4 mutants (USP4-WT, S445A, S445D) on mTPRC1 activation
Fig. 6
Fig. 6
Rheb ubiquitination regulates cell autophagy, cell proliferation, and cell size. a Cell autophagy induced by glucose starvation was analyzed in WT and RNF152−/− MEF cells. Cells were harvested after treated with Bafilomycin A1 (100 nM) for 4 h. RNF152-KO MEF cells were analyzed by genomic DNA PCR in Supplementary information, Fig. S3s. b The protein levels of LC3II were analyzed in HEK293T cells after glucose starvation and Bafilomycin A1 treatment as in (a). c Under glucose starvation, Rheb-K8R showed stronger blocking effects on autophagy than Rheb-WT. Bafilomycin A1 treatment was performed as in (a). d USP4−/− MEF cells showed higher autophagy levels than USP4+/+ MEF cells. Cells were treated with Bafilomycin A1 treatment as (a). e The effects of USP4 on cell autophagy were analyzed by examining the LC3II protein levels. Cells were treated with Vialinin A (2 μmol) for indicated time periods together with Bafilomycin A1 as in (a). f, g The effects of WT or USP4 mutants on autophagy were detected in HEK293T cells. h USP4 knockdown and Vialinin A treatment blocked cell proliferation in Rheb-WT-expressed, but not Rheb-K8R expressed SW620 cells. Data were analyzed by two-way ANOVA. P < 0.05 was considered statistically significant. *P < 0.05 and ***P < 0.001, respectively, ns not significant. i, j Cell size was measured in USP4 knockdown cells (i) and Vialinin A-treated cells (j)
Fig. 7
Fig. 7
Regulation of tumor growth by RNF152 or USP4 in an mTOR-dependent manner. a, b RNF152 knockdown promoted SW620 tumor cell growth in a xenograft model (n = 6 per group). The diameter of the tumor was measured every 2 days after 14 days of injection. Tumors were obtained on the 28th day after injection and the weight of the tumors were measured (b). Data were analyzed by two-way ANOVA (a) or one-way ANOVA (b). P< 0.05 was considered statistically significant. ***P < 0.001. ns not significant. c mTORC1 activation was tested in the tumor samples. df Rheb-WT or Rheb-K8R mutant was expressed stably in control or USP4 deficient SW620 cells and then the cells were injected into nude mice subcutaneous. The volume (d) and weight (e) of tumors, and the mTORC1 activation (f) in tumor samples were shown. Data were analyzed by two-way ANOVA (d) or one-way ANOVA (e) P< 0.05 was considered statistically significant. *P < 0.05, **P < 0.01, and ***P < 0.001, respectively. ns not significant. g, h The effects of Vialinin A on tumor growth were examined by injecting HCT116 cells into nude mice (n = 6 per group). Data were analyzed by two-way ANOVA (g) or Student’s t test (h). P< 0.05 was considered statistically significant. ***P < 0.001. i The effect of Vialinin A on the phosphorylation of S6 was examined in tumor samples from the xenografts of nude mice induced by the injection of HCT116 cells. j Representative images of colon tumors in mice on the 60th day after injection of azoxymethane. k, l Number (k) and size (l) of colon tumors in wildtype (n = 6) and USP4−/− (n = 6) mice. Data were analyzed by Student’s t-test (k). P< 0.05 was considered statistically significant. ***P < 0.001. m The expression level of RNF152 in colon cancers based on the TCGA database. Data were analyzed by Student’s t-test. P< 0.05 was considered statistically significant. ***P < 0.001,

References

    1. Saxton RA, Sabatini DM. mTOR signaling in growth, metabolism, and disease. Cell. 2017;168:960–976. doi: 10.1016/j.cell.2017.02.004. - DOI - PMC - PubMed
    1. Sengupta S, Peterson TR, Sabatini DM. Regulation of the mTOR complex 1 pathway by nutrients, growth factors, and stress. Mol. Cell. 2010;40:310–322. doi: 10.1016/j.molcel.2010.09.026. - DOI - PMC - PubMed
    1. Dibble CC, Manning BD. Signal integration by mTORC1 coordinates nutrient input with biosynthetic output. Nat. Cell Biol. 2013;15:555–564. doi: 10.1038/ncb2763. - DOI - PMC - PubMed
    1. Laplante M, Sabatini DM. mTOR signaling in growth control and disease. Cell. 2012;149:274–293. doi: 10.1016/j.cell.2012.03.017. - DOI - PMC - PubMed
    1. Fingar DC, Blenis J. Target of rapamycin (TOR): an integrator of nutrient and growth factor signals and coordinator of cell growth and cell cycle progression. Oncogene. 2004;23:3151–3171. doi: 10.1038/sj.onc.1207542. - DOI - PubMed

Publication types

MeSH terms

Substances