

Genome wide association analysis in a mouse advanced intercross line
- PMID: 30514929
- PMCID: PMC6279738
- DOI: 10.1038/s41467-018-07642-8
Genome wide association analysis in a mouse advanced intercross line
Abstract
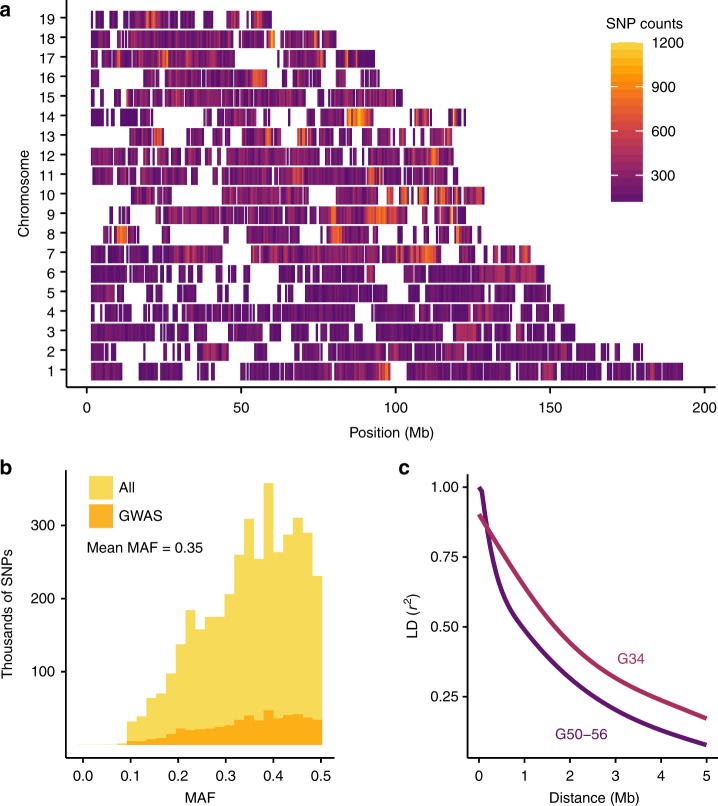
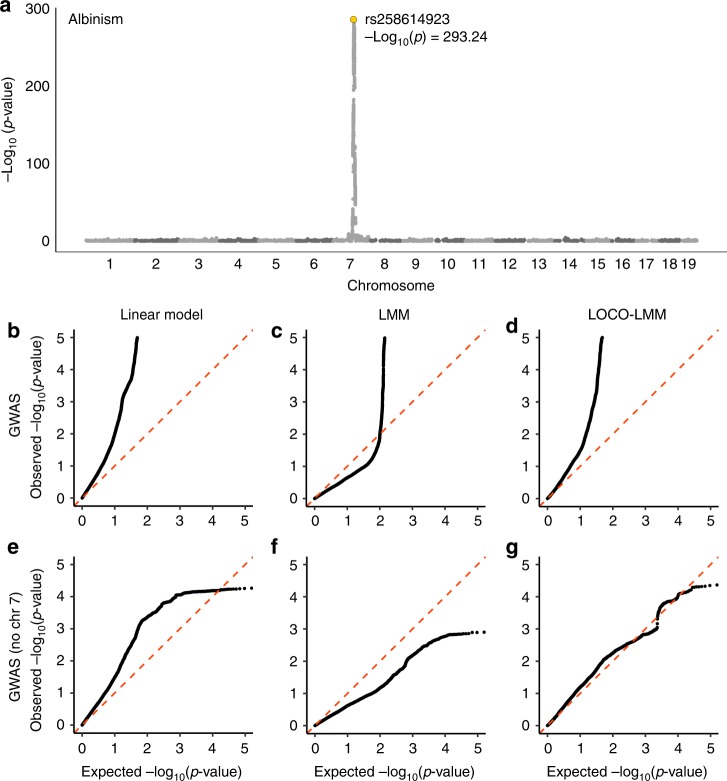
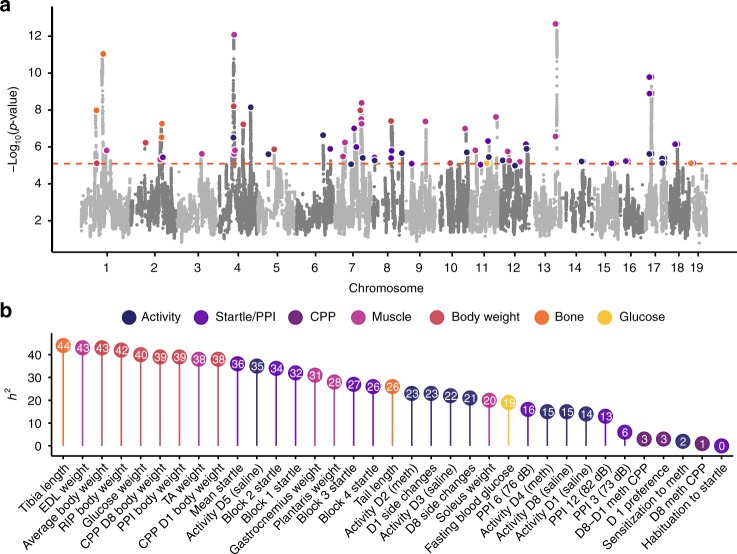
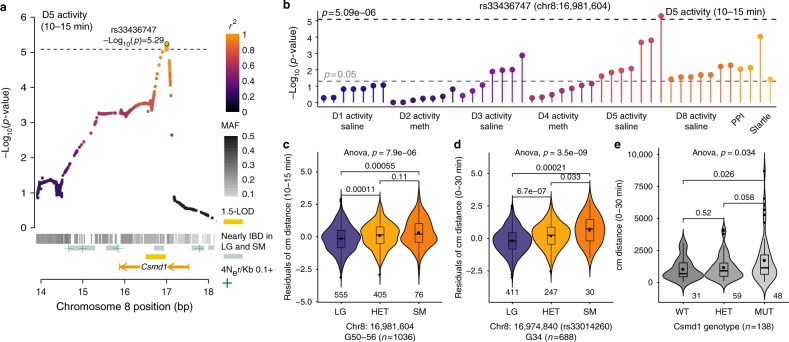
The LG/J x SM/J advanced intercross line of mice (LG x SM AIL) is a multigenerational outbred population. High minor allele frequencies, a simple genetic background, and the fully sequenced LG and SM genomes make it a powerful population for genome-wide association studies. Here we use 1,063 AIL mice to identify 126 significant associations for 50 traits relevant to human health and disease. We also identify thousands of cis- and trans-eQTLs in the hippocampus, striatum, and prefrontal cortex of ~200 mice. We replicate an association between locomotor activity and Csmd1, which we identified in an earlier generation of this AIL, and show that Csmd1 mutant mice recapitulate the locomotor phenotype. Our results demonstrate the utility of the LG x SM AIL as a mapping population, identify numerous novel associations, and shed light on the genetic architecture of mammalian behavior.
Conflict of interest statement
The authors declare no competing interests.
Figures
Similar articles
-
Genome-wide association studies and the problem of relatedness among advanced intercross lines and other highly recombinant populations.Genetics. 2010 Jul;185(3):1033-44. doi: 10.1534/genetics.110.116863. Epub 2010 May 3. Genetics. 2010. PMID: 20439773 Free PMC article.
-
The heritability of oxycodone reward and concomitant phenotypes in a LG/J × SM/J mouse advanced intercross line.Addict Biol. 2014 Jul;19(4):552-61. doi: 10.1111/adb.12016. Epub 2012 Dec 12. Addict Biol. 2014. PMID: 23231598 Free PMC article.
-
Genome-Wide Association Study in Two Cohorts from a Multi-generational Mouse Advanced Intercross Line Highlights the Difficulty of Replication Due to Study-Specific Heterogeneity.G3 (Bethesda). 2020 Mar 5;10(3):951-965. doi: 10.1534/g3.119.400763. G3 (Bethesda). 2020. PMID: 31974095 Free PMC article.
-
A novel strategy for genetic dissection of complex traits: the population of specific chromosome substitution strains from laboratory and wild mice.Mamm Genome. 2010 Aug;21(7-8):370-6. doi: 10.1007/s00335-010-9270-x. Epub 2010 Jul 11. Mamm Genome. 2010. PMID: 20623355 Review.
-
QTL mapping in outbred populations: successes and challenges.Physiol Genomics. 2014 Feb 1;46(3):81-90. doi: 10.1152/physiolgenomics.00127.2013. Epub 2013 Dec 10. Physiol Genomics. 2014. PMID: 24326347 Free PMC article. Review.
Cited by
-
Genetic variation and function: revealing potential factors associated with microbial phenotypes.Biophys Rep. 2021 Apr 30;7(2):111-126. doi: 10.52601/bpr.2021.200040. Biophys Rep. 2021. PMID: 37288143 Free PMC article.
-
Novel insights into the genetic architecture and mechanisms of host/microbiome interactions from a multi-cohort analysis of outbred laboratory rats.bioRxiv [Preprint]. 2025 Mar 27:2025.03.20.644349. doi: 10.1101/2025.03.20.644349. bioRxiv. 2025. PMID: 40166210 Free PMC article. Preprint.
-
Genome-wide association study finds multiple loci associated with intraocular pressure in HS rats.Front Genet. 2023 Jan 30;13:1029058. doi: 10.3389/fgene.2022.1029058. eCollection 2022. Front Genet. 2023. PMID: 36793389 Free PMC article.
-
Mosaic patterns of selection in genomic regions associated with diverse human traits.PLoS Genet. 2022 Nov 7;18(11):e1010494. doi: 10.1371/journal.pgen.1010494. eCollection 2022 Nov. PLoS Genet. 2022. PMID: 36342969 Free PMC article.
-
Zhx2 Is a Candidate Gene Underlying Oxymorphone Metabolite Brain Concentration Associated with State-Dependent Oxycodone Reward.J Pharmacol Exp Ther. 2022 Aug;382(2):167-180. doi: 10.1124/jpet.122.001217. Epub 2022 Jun 10. J Pharmacol Exp Ther. 2022. PMID: 35688478 Free PMC article.
References
Publication types
MeSH terms
Substances
Grants and funding
LinkOut - more resources
Full Text Sources
Molecular Biology Databases
