. 2018 Nov 20:9:2676.
doi: 10.3389/fimmu.2018.02676. eCollection 2018.

IVIg and LPS Co-stimulation Induces IL-10 Production by Human Monocytes, Which Is Compromised by an FcγRIIA Disease-Associated Gene Variant

Affiliations

IVIg and LPS Co-stimulation Induces IL-10 Production by Human Monocytes, Which Is Compromised by an FcγRIIA Disease-Associated Gene Variant

Lisa K Kozicky et al. Front Immunol. .

Abstract

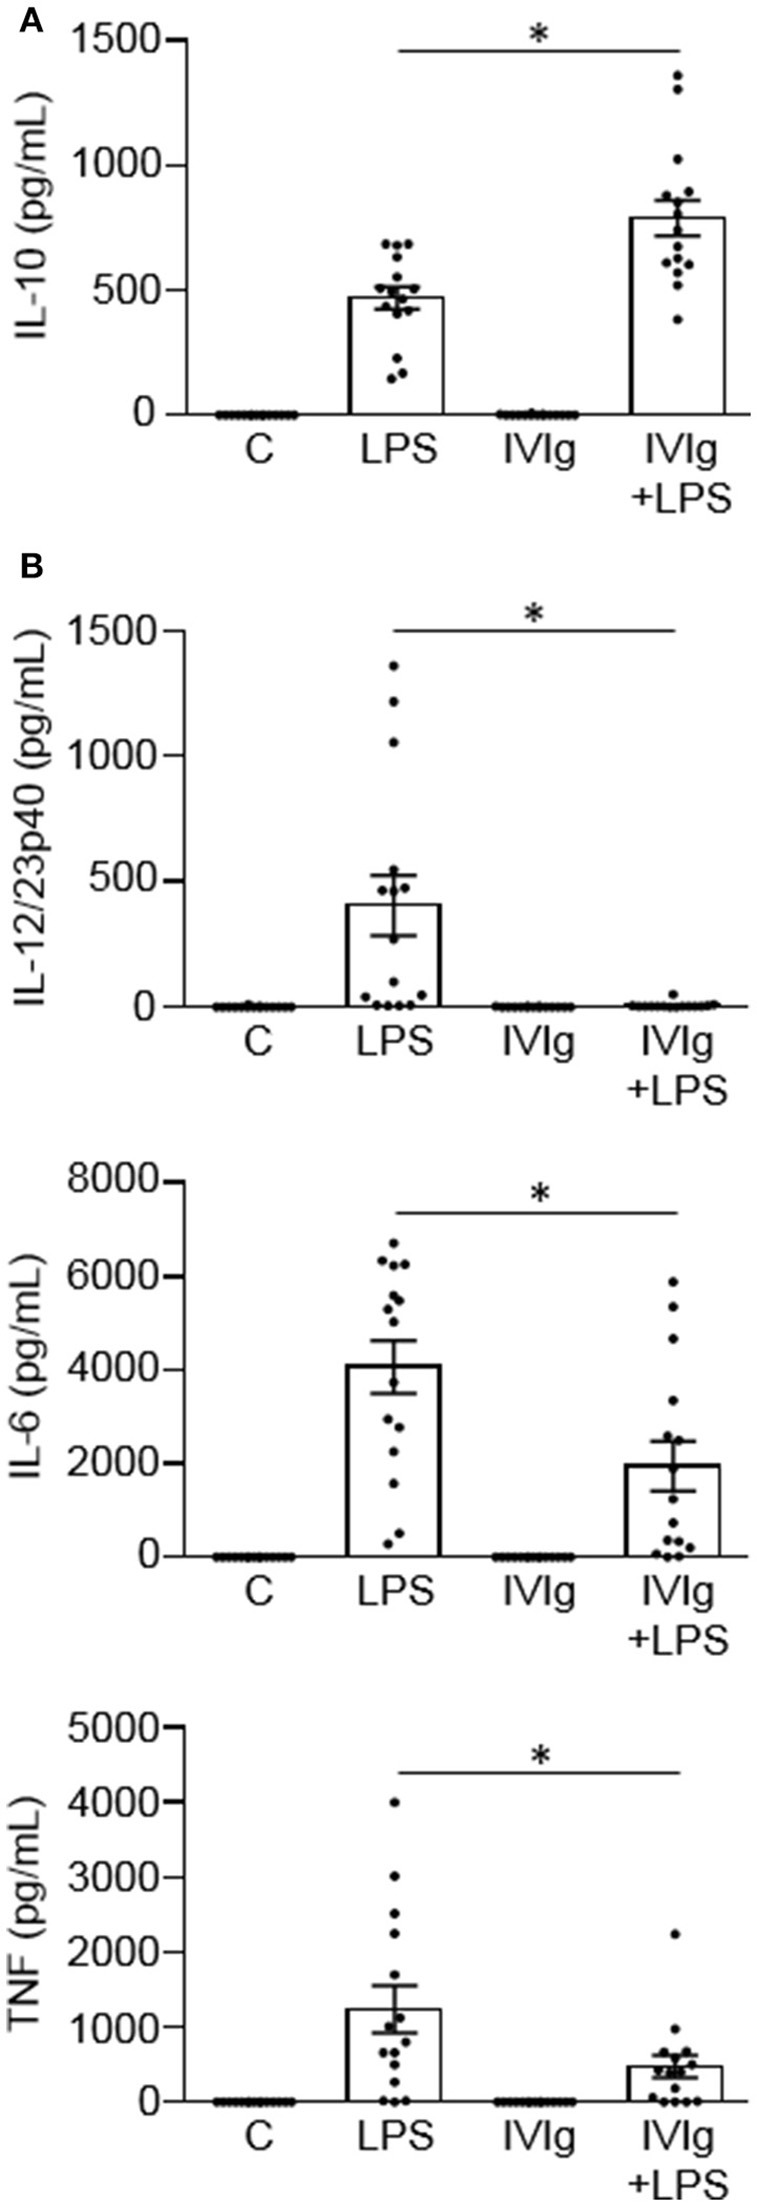
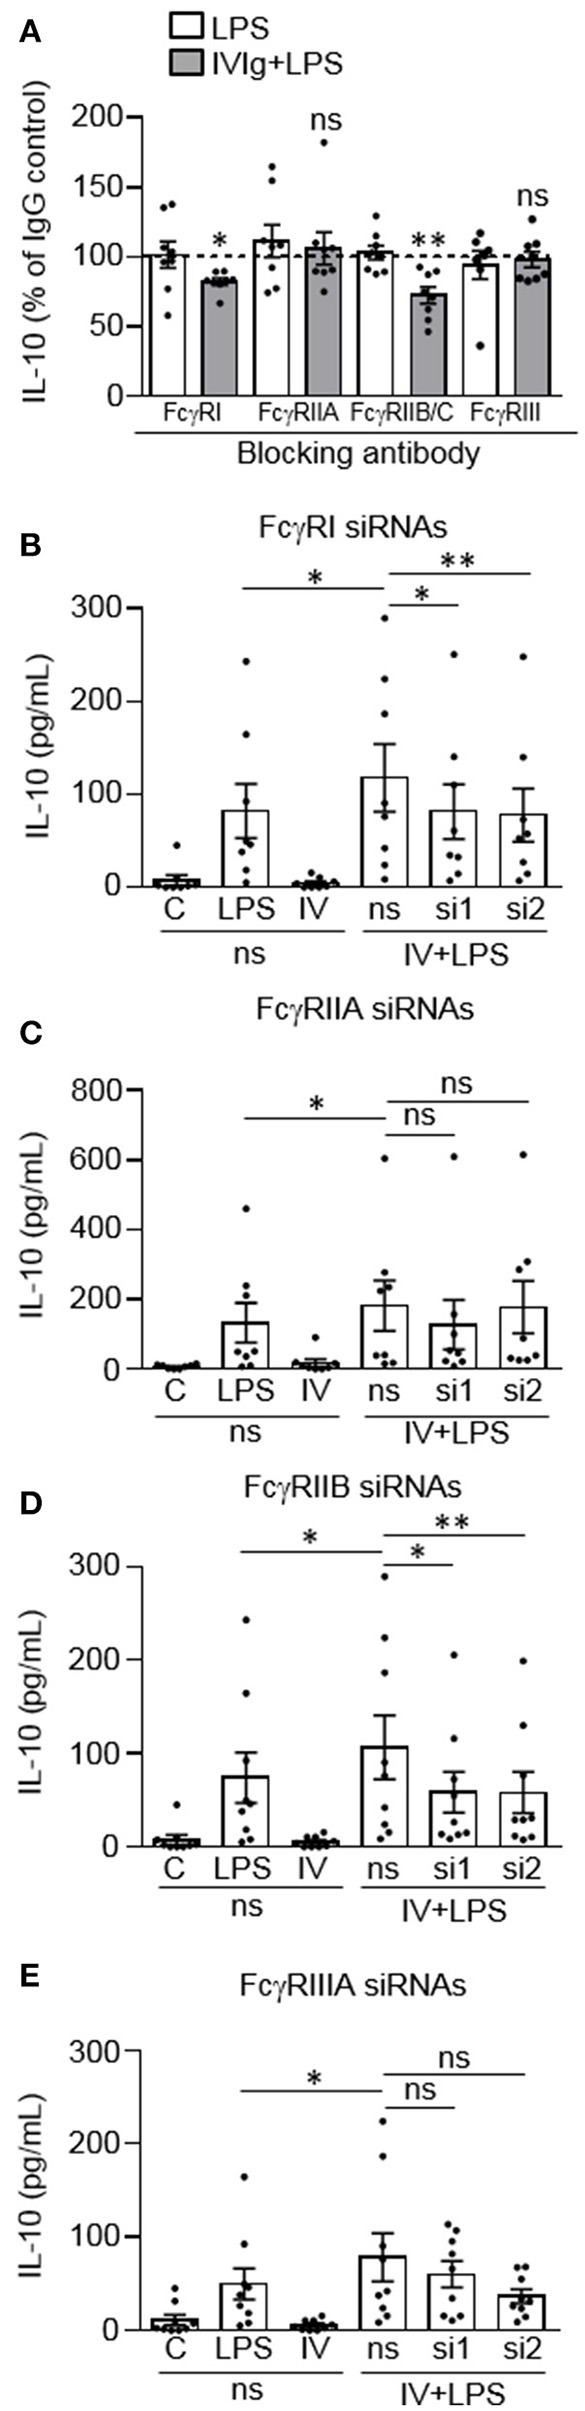
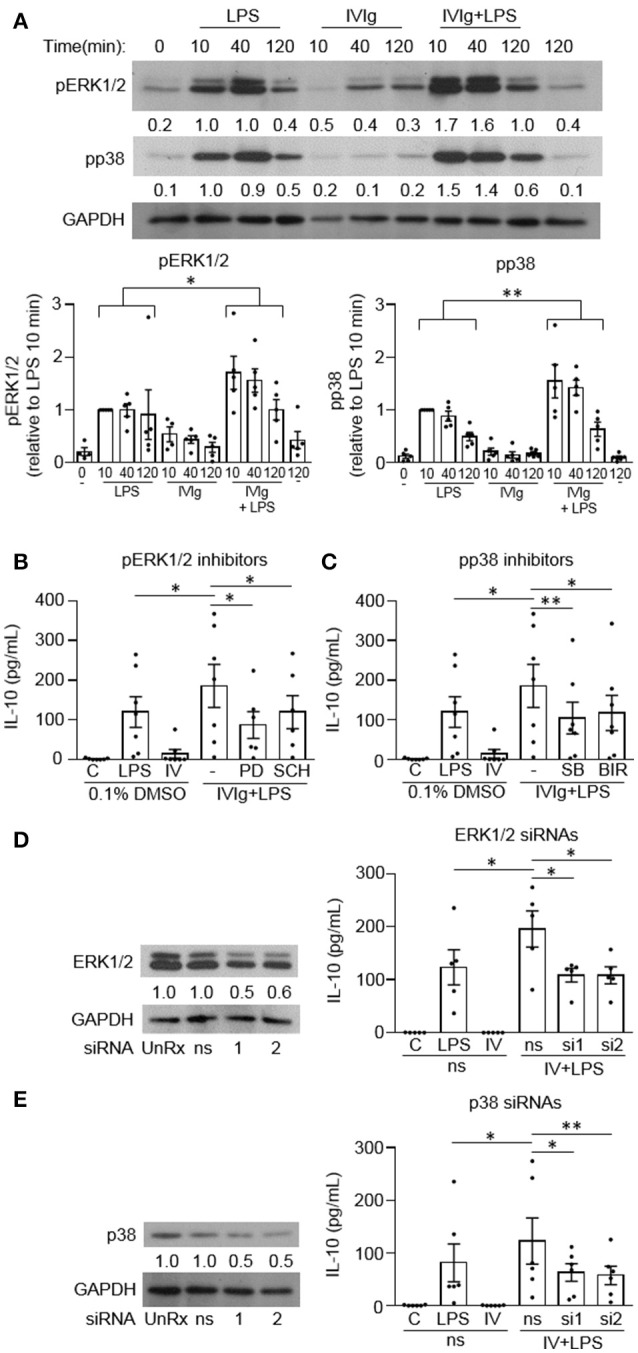
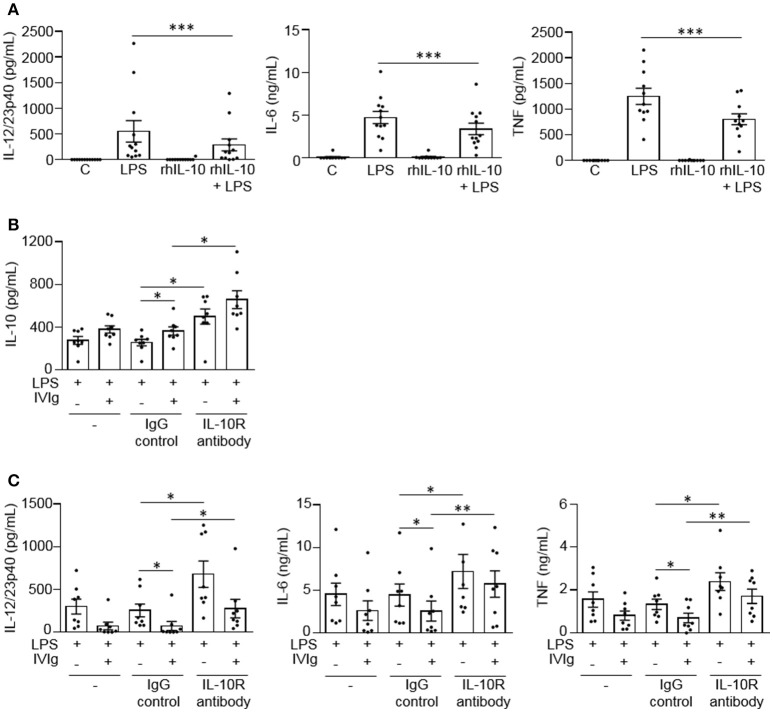
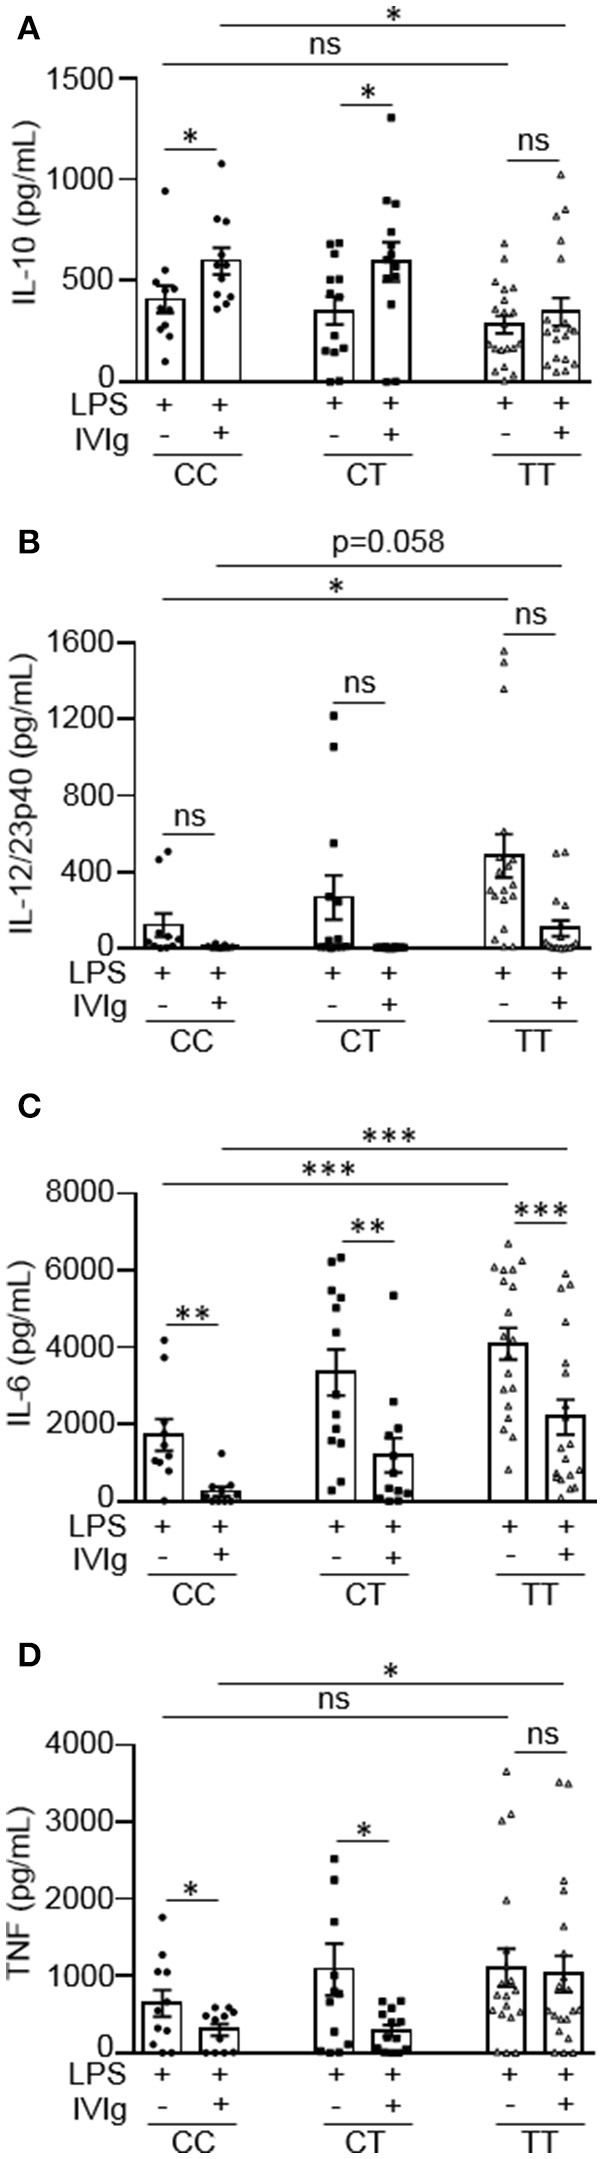
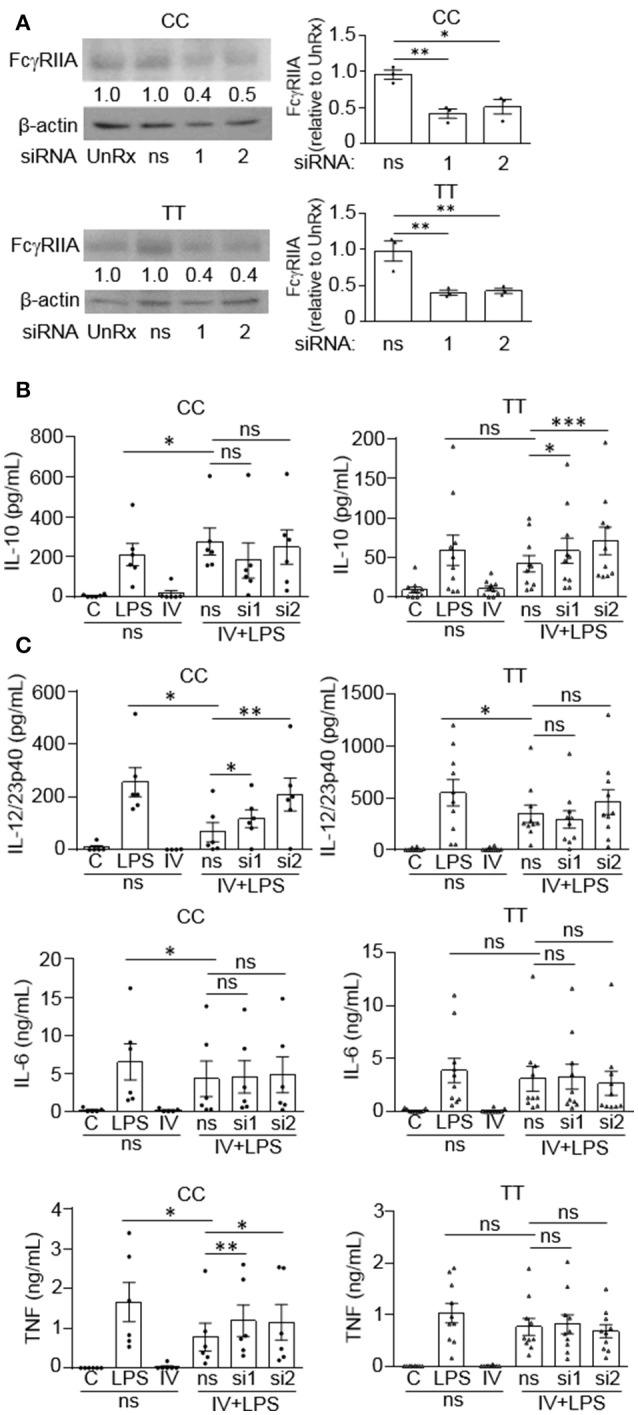
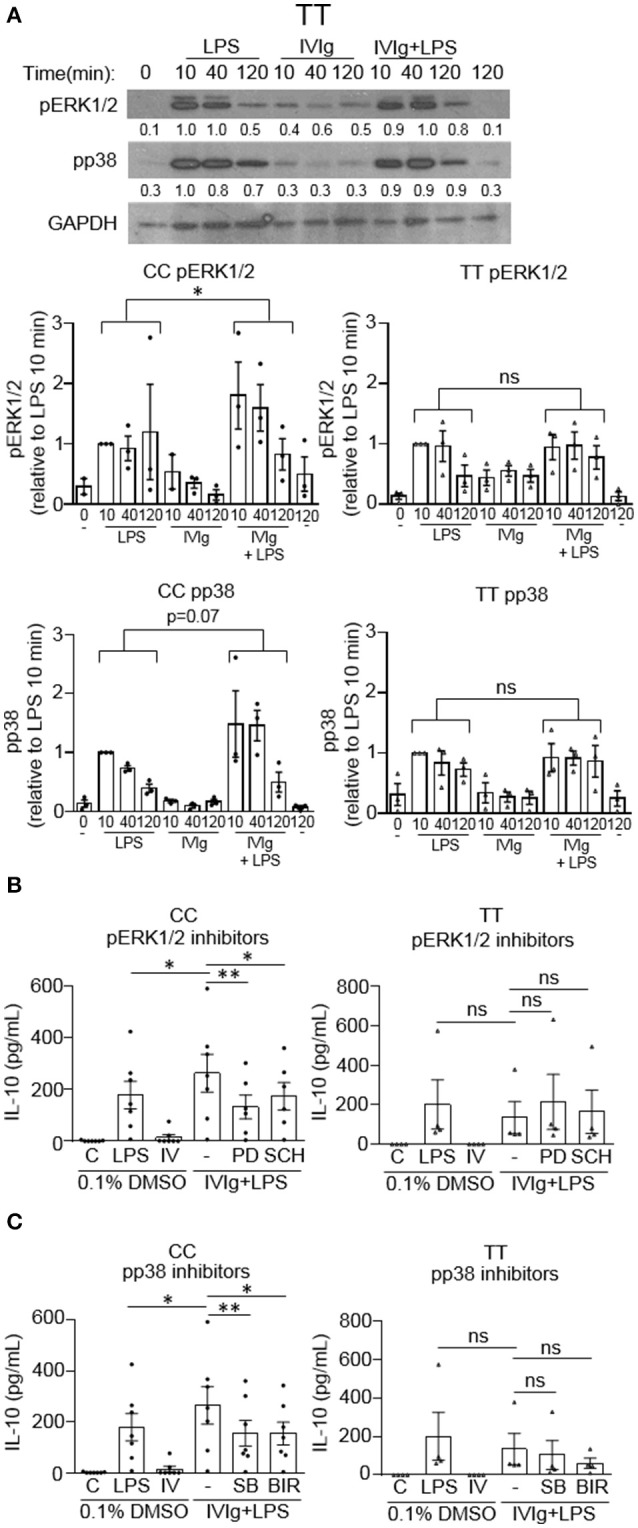
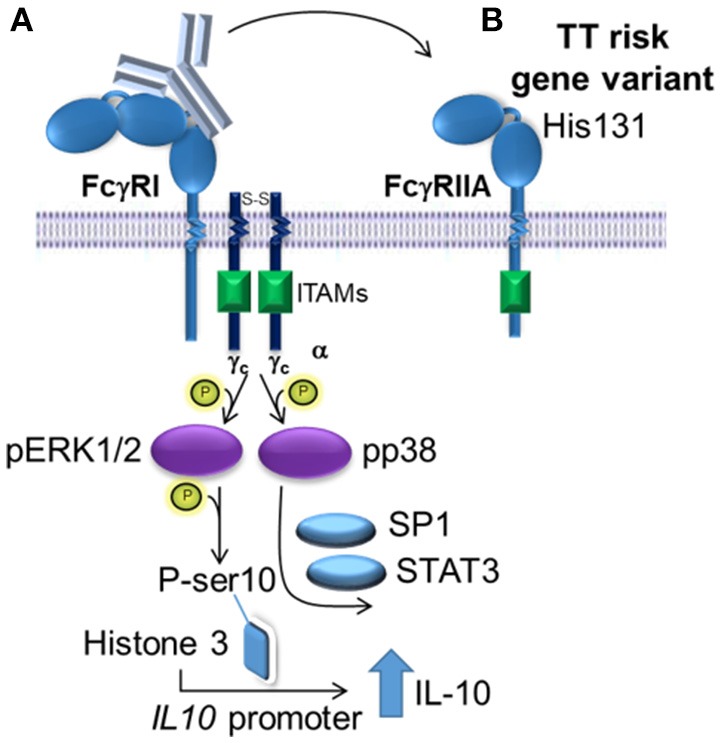
Intravenous Immunoglobulin (IVIg) is used to treat autoimmune or inflammatory diseases, but its mechanism of action is not completely understood. We asked whether IVIg can induce interleukin-10 (IL-10) and reduce pro-inflammatory cytokine production in human monocytes, and whether this response is reduced in monocytes from people with an Fcγ receptor IIA (FcγRIIA) gene variant, which is associated with increased risk of inflammatory diseases and poor response to antibody-based biological therapy. IVIg increased IL-10 production and reduced pro-inflammatory cytokine production in response to bacterial lipopolysaccharide (LPS), which required FcγRI and FcγRIIB and activation of MAPKs, extracellular signal-regulated kinase 1/2 (ERK1/2), and p38. IL-10 production was lower and pro-inflammatory cytokine production was higher in monocytes from people with the FcγRIIA risk variant and the risk variant prevented IL-10 production in response to (IVIg+LPS). Finally, we show that IVIg did not induce MAPK activation in monocytes from people with the risk variant. Our results demonstrate that IVIg can skew human monocytes to an anti-inflammatory, IL-10-producing activation state, which is compromised in monocytes from people with the FcγRIIA risk variant. This research has profound implications for the use of IVIg because 25% of the population is homozygous for the FcγRIIA risk variant and its efficacy may be reduced in those individuals. In addition, this research may be useful to develop new therapeutic strategies to replace IVIg by cross-linking FcγRIs and FcγRIIBs to promote anti-inflammatory macrophage activation, independent of the FcγRIIA genotype.

Keywords: ERK; FcγRIIA; IL-10; IVIg; MAPK; monocyte; p38; rs1801274.


Figures

Figure 1
Figure 1
IVIg increases IL-10 production and reduces pro-inflammatory cytokine production in LPS-stimulated human monocytes. Monocytes from healthy control participants were unstimulated [Control (C)] or stimulated with LPS (100 ng/ml), IVIg (5 mg/ml), or both, for 24 h. Clarified cell supernatants were assayed for (A) IL-10, (B) IL-12/23p40, IL-6, or TNF by ELISA. Data are mean ± SEM with n = 16 participants performed as independent experiments, and assayed in duplicate. *p < 0.001 for cells treated with LPS compared to cells treated with (IVIg + LPS). Statistical analyses were performed using a non-parametric paired t-test.
Figure 2
Figure 2
FcγRI and FcγRIIB are required for IVIg-induced IL-10 production in response to LPS. (A) Monocytes were untreated or pre-treated for 1 h with an IgG isotype control (50 or 100 μg/ml) or a blocking antibody against FcγRI (100 μg/ml), FcγRIIA (50 μg/ml), FcγRIIB/C (100 μg/ml), or FcγRIII (50 μg/ml). Cells were stimulated with LPS (100 ng/ml) or [IVIg (5 mg/ml) + LPS (100 ng/ml)] for 24 h. Clarified cell supernatants were assayed for IL-10. Statistical comparisons are for the IgG control to specific FcγR blocking antibody (raw data). (B–E) Monocytes were untreated or pre-treated for 48 h with a non-silencing siRNA (ns) or 2 different siRNAs (si1 or si2) to FcγRI (B), FcγRIIA (C), FcγRIIB (D), or FcγRIIIA (E). Monocytes pre-treated with the ns siRNA control were unstimulated [control (C)] or stimulated with LPS (100 ng/ml), IVIg (5 mg/ml), or both, for 24 h. Monocytes pre-treated with si1 or si2 were stimulated with IVIg (5 mg/ml) + LPS (100 ng/ml). Clarified cell supernatants were assayed for IL-10. Data are mean ± SEM. Results are representative of n = 8 experiments in (A) and n = 8 or 9 experiments in (B–E); Monocytes were derived from 1 participant for each of 8 or 9 independent experiments, and were assayed in duplicate. *p < 0.05, **p < 0.01 and ns = not statistically different. Statistical analyses were performed using a repeated measures one-way ANOVA with Dunn's multiple comparisons correction.
Figure 3
Figure 3
MAPKs are required for IVIg-induced IL-10 production in response to LPS. (A) Monocytes from healthy control participants were unstimulated or stimulated with LPS (100 ng/ml), IVIg (5 mg/ml), or both, for 0, 10, 40, or 120 min. Cell lysates (2.5 × 10⁵ cells / time point) were prepared at the indicated times. Lysates were separated by SDS-PAGE and analyzed by western blotting using phosphospecific antibodies for ERK1/2 and p38, and GAPDH, as a loading control. Results are representative of n = 5 experiments; monocytes were derived from 1 participant for each of 5 independent experiments. Densitometry for pERK1/2 and pp38; normalized to GAPDH and relative to LPS 10 min; are averaged and shown below each band and values are graphed and reported as mean ± SEM. In (B) and (C), monocytes were pre-treated for 1 h with an appropriate volume of DMSO, as a vehicle control, or (B) the ERK1/2 inhibitors, PD98059 (PD) and SCH772984 (SCH), or (C) the p38 inhibitors, SB203580 (SB), and BIRB796 (BIR). In (D) and (E) monocytes were untreated (UnRx) or pre-treated for 48 h with a non-silencing siRNA (ns) or 2 different sets of siRNAs (si1 or si2) to ERK1 and 2 (D) or p38α, p38γ, and p38δ (E). Samples in (D) and (E) were prepared, as above, and analyzed by western blotting using antibodies for ERK1/2 (D) or p38 (E) and GAPDH, as a loading control. Densitometry for ERK1/2 (D) or p38 (E) normalized to GAPDH and relative to untreated control (UnRx) are shown below each band. Monocytes in (B–E) were unstimulated (C) or stimulated with LPS (100 ng/ml), IVIg (5 mg/ml), or (IVIg + LPS) for 24 h. Clarified cell supernatants were assayed for IL-10 by ELISA. Values are reported as mean ± SEM for n = 7 (B,C) or n = 5 or 6 (D,E) participants performed as independent experiments, assayed in duplicate. *p < 0.05, **p < 0.01, and ns = not statistically different for the comparisons indicated. Statistical analyses were performed using a two-way ANOVA in (A) and repeated measures one-way ANOVA in (B–E) with Dunn's multiple comparisons correction.
Figure 4
Figure 4
IL-10 signaling contributes to reduced LPS-induced pro-inflammatory cytokine production by IVIg-activated monocytes. In (A) monocytes from healthy control participants were left untreated (C) or stimulated with LPS (100 ng/ml), recombinant human IL-10 (rhIL-10; 400 pg/ml) or [rhIL-10 (400 pg/ml) + LPS (100 ng/ml)] for 24 h. Clarified cell supernatants were assayed for (A) IL-12/23p40, IL-6, and TNF. In (B,C) monocytes from healthy control participants were untreated (–) or pre-treated for 1 h with an IgG isotype control (IgG; 5 μg/ml) or an IL-10 receptor (IL-10R) blocking antibody (5 μg/ml). Cells were then stimulated with LPS (100 ng/ml) or [IVIg (5 mg/ml) + LPS (100 ng/ml)] for 24 h. Clarified cell supernatants were assayed for (B) IL-10, (C) IL-12/23p40, IL-6, and TNF. Data are mean ± SEM from n = 12 (A) or 8 (B,C) participants performed as independent experiments, assayed in duplicate. *p < 0.05 and **p < 0.01, and ***p < 0.001 for the comparisons indicated. Statistical analyses were performed using a non-parametric paired t-test in (A) and a repeated measures one-way ANOVA with Dunn's multiple comparisons correction in (B,C).
Figure 5
Figure 5
Monocytes from people with the FcγRIIA disease associated gene variant have lower IVIg-mediated anti-inflammatory responses to LPS. Monocytes from healthy control participants were stimulated with LPS (100 ng/ml) or [IVIg (5 mg/ml) + LPS (100 ng/ml)] for 24 h. Participants were genotyped for the FcγRIIA H131R polymorphism (rs1801274); CC = does not have the disease associated gene variant (low affinity), CT = heterozygous for the disease associated gene variant, and TT = homozygous for the disease associated gene variant (high affinity). Clarified cell supernatants were assayed for (A) IL-10, (B) IL-12/23p40, (C) IL-6, and (D) TNF and responses were stratified to genotype. Data are mean ± SEM from n = 11 CC participants, n = 13 CT participants, and n = 20 TT participants performed as independent experiments, assayed in duplicate. *p < 0.05, **p < 0.01, ***p < 0.001, and ns, not statistically significant. Statistical analyses were performed using a repeated measures one-way ANOVA with Dunn's multiple comparisons correction.
Figure 6
Figure 6
FcγRIIA prevents IVIg-induced IL-10 production in monocytes from people with the disease-associated gene variant. Monocytes from healthy control participants of the non-risk genotype (CC) and risk genotype (TT) were untreated (UnRx) or pre-treated for 48 h with a non-silencing siRNA (ns) or 2 different siRNAs to the FcγRIIA (si1 or si2). (A) Cell lysates (2.5 × 10⁵ cells / treatment) were prepared, separated by SDS-PAGE, analyzed by western blotting with antibodies for FcγRIIA and β-actin, as a loading control. Results are representative of n = 6 experiments for the non-risk genotype (CC) and n = 10 experiments for the risk genotype (TT); Monocytes were derived from 1 participant for each independent experiment. Densitometry for FcγRIIA normalized to β-actin and relative to the control (UnRx) are averaged and shown below each band. (B,C) Monocytes pre-treated with the ns siRNA control were unstimulated [control (C)] or stimulated with LPS (100 ng/ml), IVIg (5 mg/ml), or both, for 24 h, and monocytes pre-treated with FcγRIIA si1 and si2 were stimulated with IVIg (5 mg/ml) + LPS (100 ng/ml). Clarified cell supernatants were assayed for (B) IL-10, (C) IL-12/23p40, IL-6, and TNF. Data are mean ± SEM and are representative of n = 6 experiments for the non-risk genotype (CC) and n = 10 experiments for the risk genotype (TT). Monocytes were derived from 1 participant for each independent experiment and assayed in duplicate. *p < 0.05, **p < 0.01, ***p < 0.001, and ns = not statistically different for the comparisons indicated. Statistical analyses were performed using a repeated measures one-way ANOVA with Dunn's multiple comparisons correction.
Figure 7
Figure 7
(IVIg + LPS)-induced MAPK phosphorylation is lower in monocytes from people with the FcγRIIA risk variant. (A) Monocytes from healthy participants with the non-risk genotype (CC) or the risk genotype (TT) were unstimulated or stimulated with LPS (100 ng/ml), IVIg (5 mg/ml), or both, for 0, 10, 40, or 120 min. Cell lysates (2.5 × 10⁵ cells / time point) were prepared at the indicated times. Lysates were separated by SDS-PAGE and analyzed by western blotting using phosphospecific antibodies for ERK1/2, p38, and using GAPDH, as a loading control. Representative western blot from participants with the TT genotype are shown in (A). Results are representative of n = 3 experiments per genotype; monocytes were derived from 1 participant for each of 3 independent experiments. Densitometry for pERK1/2 and pp38; normalized to GAPDH and relative to LPS 10 min; are averaged from n = 3 independent experiments and shown below each band and values are graphed as mean ± SEM for each genotype. Monocytes were pre-treated for 1 h with an appropriate volume of DMSO, as a vehicle control, or (B) the ERK1/2 inhibitors, PD98059 (PD) and SCH772984 (SCH); or (C) the p38 inhibitors, SB203580 (SB) and BIRB796 (BIR) and were unstimulated (C) or stimulated with LPS (100 ng/ml), IVIg (5 mg/ml), or both for 24 h. Clarified cell supernatants were analyzed for IL-10 by ELISA. (B,C) Values are reported as mean ± SEM for n = 7 participants for the CC genotype and n = 4 participants for the TT genotype performed as independent experiments, and assayed in duplicate. *p < 0.05, **p < 0.01, and ns = not statistically different for the comparisons indicated. Statistical analyses were performed using a two-way ANOVA in (A) and repeated measures one-way ANOVA in (B,C) with Dunn's multiple comparisons correction.
Figure 8
Figure 8
Proposed model of IVIg-induced IL-10 production in monocytes from people with the non-risk, low affinity FcγRIIA gene variant. (A) In monocytes from people with the low affinity, non-risk gene variant, the FcγRI induces increased IL-10 production in response to IVIg. ERK1/2 activation is increased, which primes cells for IL-10 production by phosphorylating ser10 on histone 3 opening up the IL10 promoter and phosphorylating p38, which drives specificity protein 1 (SP1)- and signal transducer and activator of transcription 3 (STAT3)-mediated transcription of IL10. (B) The high affinity, risk variant FcγRIIA sequesters IVIg antibodies from the FcγRI in monocytes, which prevents activation of ERK1/2 and p38, and limits IL-10 production.

References

    1. Mosser DM, Edwards JP. Exploring the full spectrum of macrophage activation. Nat Rev Immunol. (200) 8:958–69. 10.1038/nri2448 - DOI - PMC - PubMed
    1. Murray PJ, Wynn TA. Protective and pathogenic functions of macrophage subsets. Nat Rev Immunol. (2011) 11:723–37. 10.1038/nri3073 - DOI - PMC - PubMed
    1. Mosser DM, Zhang X. Interleukin-10: new perspectives on an old cytokine. Immunol Rev. (200) 226:205–18. 10.1111/j.1600-065X.2008.00706.x - DOI - PMC - PubMed
    1. Iyer SS, Cheng G. Role of interleukin 10 transcriptional regulation in inflammation and autoimmune disease. Crit Rev Immunol. (2012) 32:23–63. 10.1615/CritRevImmunol.v32.i1.30 - DOI - PMC - PubMed
    1. Gelfand EW. Intravenous immune globulin in autoimmune and inflammatory diseases. N Engl J Med. (2013) 368:777. 10.1056/NEJMc1215489 - DOI - PubMed

Publication types

MeSH terms

Grants and funding