Clinical Trial
. 2018 Nov 20:9:2683.
doi: 10.3389/fimmu.2018.02683. eCollection 2018.

Dysregulated miR-155 and miR-125b Are Related to Impaired B-cell Responses in Down Syndrome

Affiliations
Clinical Trial

Dysregulated miR-155 and miR-125b Are Related to Impaired B-cell Responses in Down Syndrome

Chiara Farroni et al. Front Immunol. .

Abstract

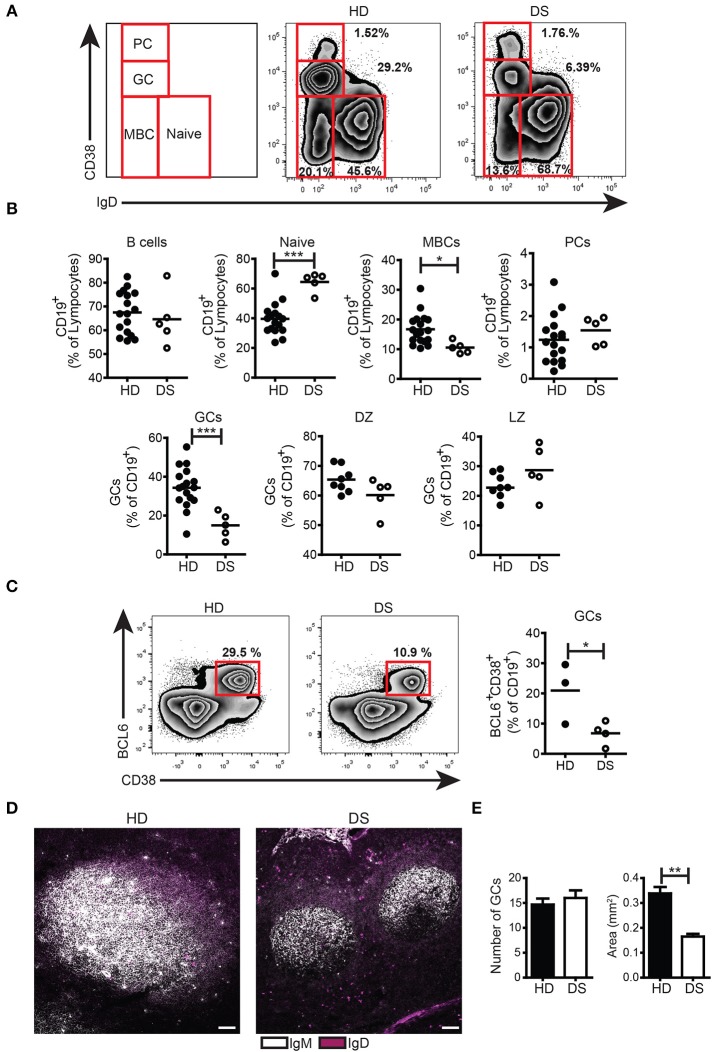
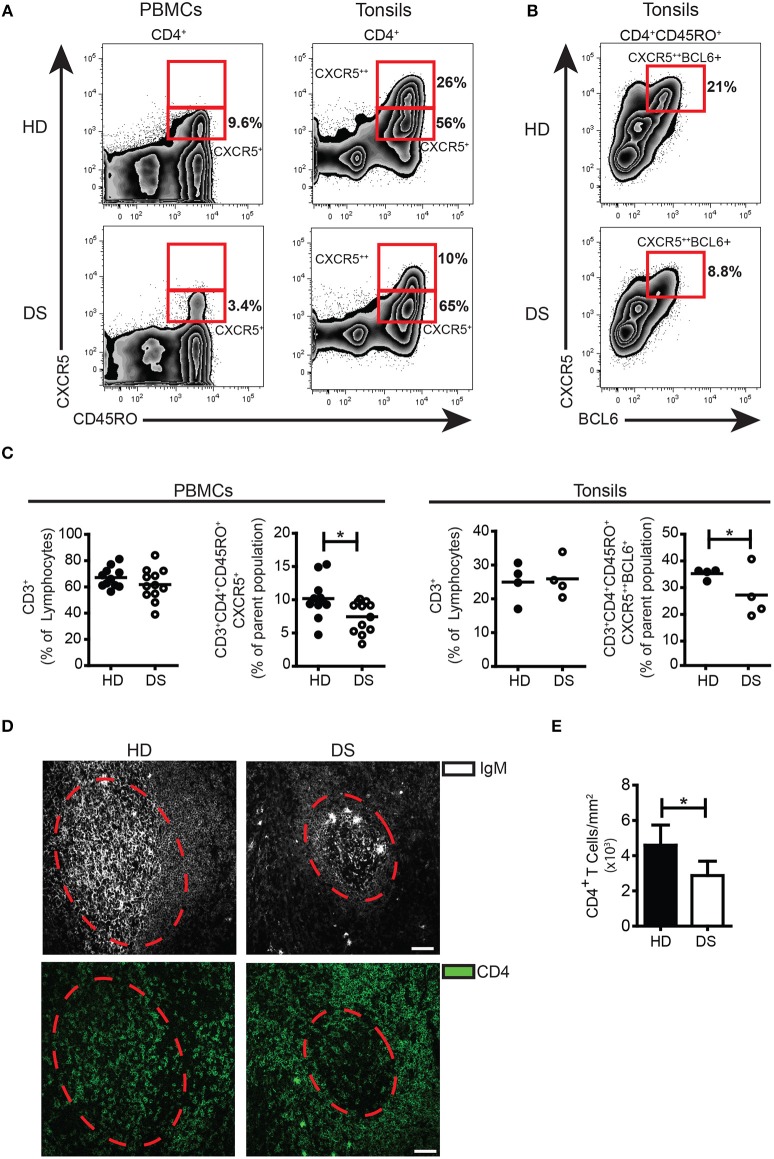
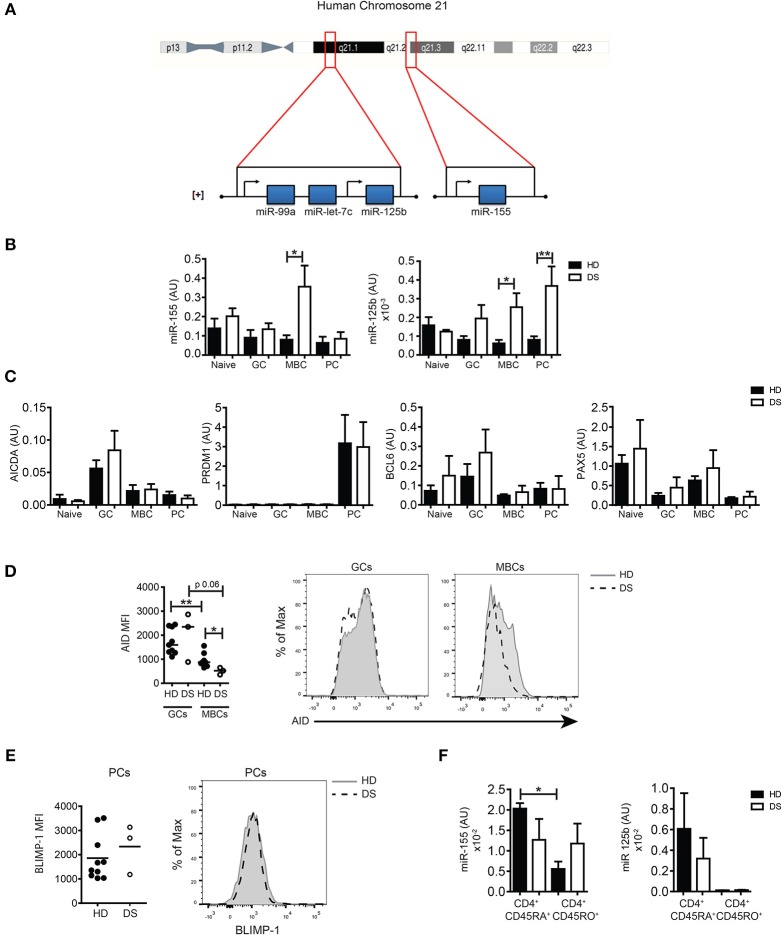
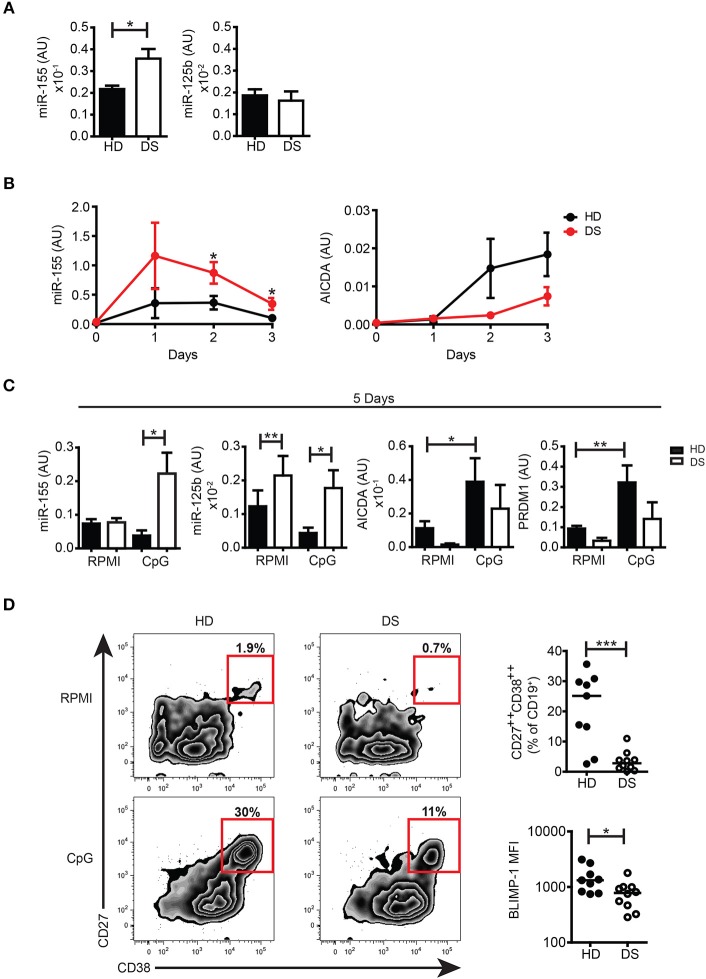
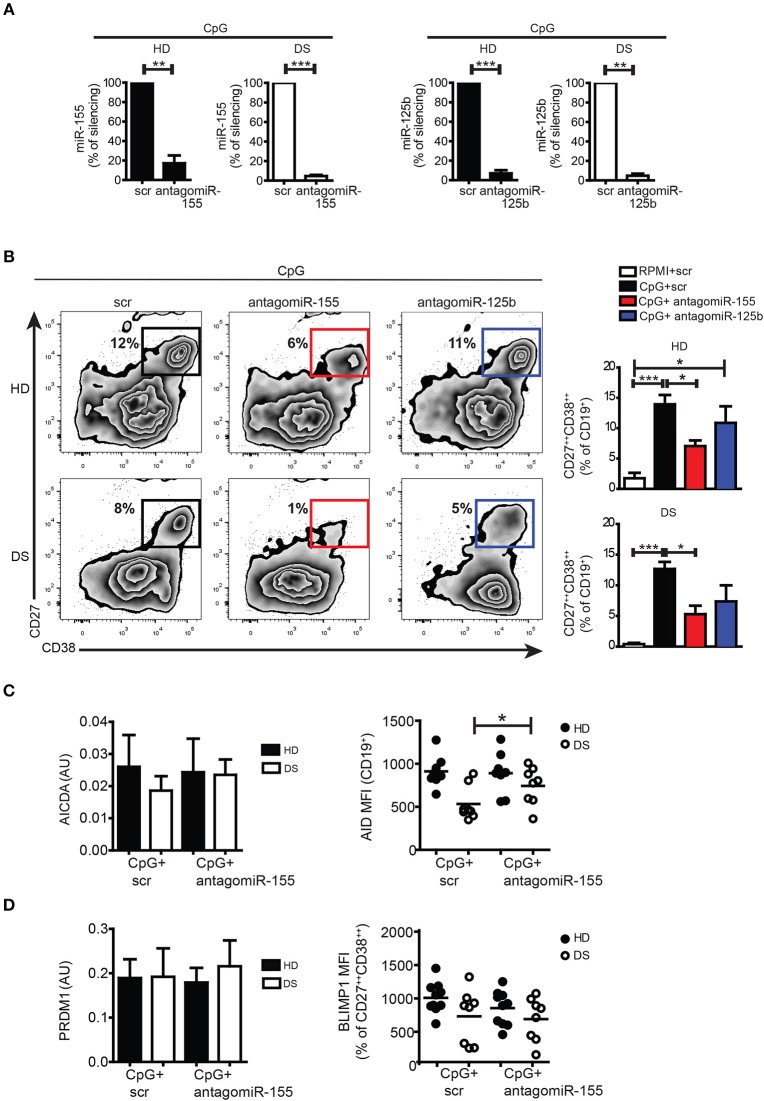
Children with Down Syndrome (DS) suffer from immune deficiency with a severe reduction in switched memory B cells (MBCs) and poor response to vaccination. Chromosome 21 (HSA21) encodes two microRNAs (miRs), miR-125b, and miR-155, that regulate B-cell responses. We studied B- and T- cell subpopulations in tonsils of DS and age-matched healthy donors (HD) and found that the germinal center (GC) reaction was impaired in DS. GC size, numbers of GC B cells and Follicular Helper T cells (TFH) expressing BCL6 cells were severely reduced. The expression of miR-155 and miR-125b was increased in tonsillar memory B cells and miR-125b was also higher than expected in plasma cells (PCs). Activation-induced cytidine deaminase (AID) protein, a miR-155 target, was significantly reduced in MBCs of DS patients. Increased expression of miR-155 was also observed in vitro. MiR-155 was significantly overexpressed in PBMCs activated with CpG, whereas miR-125b was constitutively higher than normal. The increase of miR-155 and its functional consequences were blocked by antagomiRs in vitro. Our data show that the expression of HSA21-encoded miR-155 and miR-125b is altered in B cells of DS individuals both in vivo and in vitro. Because of HSA21-encoded miRs may play a role also in DS-associated dementia and leukemia, our study suggests that antagomiRs may represent pharmacological tools useful for the treatment of DS.

Keywords: B cell; Down Syndrome; antagomiR; germinal center; immunodeficiency; miR-125b; miR-155; plasma cells.


Figures

Figure 1
Figure 1
B cell populations and GCs in tonsils. (A-C) Flow cytometry analysis of B-cell subsets in tonsils stained with appropriate Abs. (A) Plots show the distribution and frequency of B-cell subsets in tonsils of a representative HD and DS. (B) Frequency of total B cells (expressed as percentage of lymphocytes), naïve, memory, plasma cells, GC (all expressed as percentage of CD19+), DZ, and LZ (all expressed as percentage of GCs) of HDs (n = 17, except DZ and LZ n = 8) and DS patients (n = 5, except DZ and LZ n = 3) is shown. (C) Representative plots and graph shows frequency of BCL6+ GC B cells in tonsils (HD n = 3; DS n = 4). Each dot represents a different HD or DS and black lines represent mean (D) Analysis of GC B cells in tonsils stained with IgM and IgD by immunofluorescence (IF). Images are 20X, scale bar 100 μm. (E) Bars show mean±SEM number (left) and area (mm2) (right) of GCs that were calculated on sections stained with H&E in HD (n = 3) and DS patients (n = 3). Data are representative of three independent experiments. Differences between groups determined by unpaired Student's t-test (*p = 0.05, **p = 0.01, ***p = 0.001).
Figure 2
Figure 2
TFH cells in tonsils and peripheral blood. (A) Plots show percentage of CD3+CD8CD45RACD45RO+CXCR5+ and CXCR5++ in PBMCs and tonsils of a representative HD and DS patients. (B) Plots show percentage of CD3+CD4+CD45RACXCR5++BCL6+ cells in tonsils of a representative HD and DS patients. (C) Graphs show percentage of total CD3+ T cells in PBMCs and tonsils, CXCR5+ TFH-like cells in PBMCs and CXCR5++BCL6+ TFH cells in tonsils of a representative HD and DS patients. Each dot represents a different HD or DS, black lines represent mean (peripheral blood: HD n = 11, DS n = 12; tonsils: HD n = 4, DS n = 4). (D) IF analysis of tonsils from HD and DS using anti-CD4 and anti-IgM Abs to identify T cells within the GC. Dashed line mark the GC area. Images are 20X, scale bar 75 μm. (E) Bars show mean±SEM cellular density of CD4+ within each GC (HD n = 3, DS n = 3). Differences between groups determined by unpaired Student's t-test (*p = 0.05).
Figure 3
Figure 3
The expression of miRs in sorted tonsillar B cells. (A) Schematic Figure showing HSA21 and loci of miRs on the long arm of HSA21. (B) Bars show mean±SEM expression of miR-155 and miR-125b in sorted tonsillar B-cell populations (HD n = 4; DS n = 4). (C) Bars show mean mRNA expression±SEM of AICDA, PRDM1, PAX5, BCL6 in sorted tonsillar B-cell populations (HD n = 4; DS n = 4). (D) Graphs and histograms show flow cytometry analysis of AID expression in GCs and MBCs (HD n = 8; DS n = 3). (E) Graph and histogram show flow cytometry analysis of BLIMP-1 expression in PCs (HD n = 10; DS n = 3). Each dot represents a different HD or DS and black lines represent mean (F) Bars show mean±SEM expression of miR-125b and miR-155 expression in sorted CD4+ naive and memory T cells (HD n = 3; DS n = 3). Differences between groups determined by unpaired Student's t-test (*p = 0.05, **p = 0.01). In (F) one-way ANOVA Kruskal-Wallis test followed by Dunn's Multiple comparison test was performed (*p < 0.05).
Figure 4
Figure 4
miRs expression in untreated cells and in in vitro activated PBMCs. (A) Bars show mean expression±SEM of miR-125b and miR-155 in untreated PBMCs from HD (n = 11) and DS children (n = 10). (B) Graphs show the mean expression±SEM of mRNA of miR-155 and AICDA in DS and HD at different time points (HD n = 6, DS n = 5). (C) Bars show mean expression±SEM of miR-125b and miR-155 in PBMCs stimulated with CpG for 5 days (HD n = 8; DS n = 4 pools, each pool is composed of 5 children) and mean expression±SEM of mRNA of AICDA and PRDM1 in PBMCs stimulated with CpG for 5 days (HD n = 8; DS n = 4 pools, each pool is composed of 5 children). (D) PBMCs were stimulated for 5 days with CpG and frequency of CD27++CD38++ plasma blasts was evaluated. Left panel shows representative flow cytometry plots of plasma blasts of a HD and a DS patient. Right panel shows frequency of plasma blasts and plasma blasts BLIMP-1 expression after 5 days of culture with CpG (HD n = 9, DS n = 10). Differences between groups determined by unpaired Student's t-test (*p < 0.05; **p < 0.01; ***p < 0.001).
Figure 5
Figure 5
Silencing of mature miRs in activated peripheral blood B cells with CpG. (A) PBMCs were treated with antagomiR and activated with CpG for seven days. Graphs show the efficiency of miR-125b and miR-155 silencing in HD (n = 4) and DS (n = 4) evaluated by qPCR, and expressed as percentage of silencing compared to the scr control. (B) After seven days, plasma blasts differentiation was assessed by flow cytometry through the surface upregulation of CD27 and CD38. Plots of a representative HD and DS patient is shown. Bars indicate mean frequency±SEM of plasma blasts for HD (n = 14) and DS (n = 15). (C) Bars show mean±SEM mRNA levels of AICDA in in vitro stimulated cells after silencing of miR-155 (right); graph shows MFI levels of AID protein expression evaluated by flow cytometry after in vitro silencing of miR-155, each dot represents a different HD or DS, black lines represent mean. (D) Bars show mean±SEM mRNA levels of PRDM1 in in vitro stimulated cells after silencing of miR-155 (right); graph shows MFI levels of BLIMP-1 protein expression evaluated by flow cytometry after in vitro silencing of miR-155, each dot represents a different HD or DS, black lines represent mean. Culture conditions are indicated in figure legend. Differences between groups determined by unpaired Student's t-test in A (**p < 0.01; ***p < 0.001). One-way ANOVA Kruskal-Wallis test followed by Dunn's Multiple comparison test was performed in (B) (*p < 0.05; ***p < 0.001).

References

    1. Asim A, Kumar A, Muthuswamy S, Jain S, Agarwal S. Down syndrome: an insight of the disease. J Biomed Sci. (2015) 22:41. 10.1186/s12929-015-0138-y - DOI - PMC - PubMed
    1. Alsubie HS, Rosen D. The evaluation and management of respiratory disease in children with Down syndrome (DS). Paediatr Respir Rev. (2018) 26:49–54. 10.1016/j.prrv.2017.07.003 - DOI - PubMed
    1. Stores G, Stores R. Sleep disorders in children with Down syndrome: Stores and Stores reply. Dev Med Child Neurol. (2013) 55:1159. 10.1111/dmcn.12180 - DOI - PubMed
    1. van den Driessen Mareeuw FA, Hollegien MI, Coppus AMW, Delnoij DMJ, de Vries E. In search of quality indicators for Down syndrome healthcare: a scoping review. BMC Health Serv Res. (2017) 17:284. 10.1186/s12913-017-2228-x - DOI - PMC - PubMed
    1. Irving C, Basu A, Richmond S, Burn J, Wren C. Twenty-year trends in prevalence and survival of Down syndrome. Eur J Hum Genet. (2008) 16:1336–40. 10.1038/ejhg.2008.122 - DOI - PubMed

Publication types