. 2018 Dec 5;14(12):e1006640.
doi: 10.1371/journal.pcbi.1006640. eCollection 2018 Dec.

Insights on the impact of mitochondrial organisation on bioenergetics in high-resolution computational models of cardiac cell architecture

Affiliations

Insights on the impact of mitochondrial organisation on bioenergetics in high-resolution computational models of cardiac cell architecture

Shouryadipta Ghosh et al. PLoS Comput Biol. .

Abstract

Recent electron microscopy data have revealed that cardiac mitochondria are not arranged in crystalline columns but are organised with several mitochondria aggregated into columns of varying sizes spanning the cell cross-section. This raises the question-how does the mitochondrial arrangement affect the metabolite distributions within cardiomyocytes and what is its impact on force dynamics? Here, we address this question by employing finite element modeling of cardiac bioenergetics on computational meshes derived from electron microscope images. Our results indicate that heterogeneous mitochondrial distributions can lead to significant spatial variation across the cell in concentrations of inorganic phosphate, creatine (Cr) and creatine phosphate (PCr). However, our model predicts that sufficient activity of the creatine kinase (CK) system, coupled with rapid diffusion of Cr and PCr, maintains near uniform ATP and ADP ratios across the cell cross sections. This homogenous distribution of ATP and ADP should also evenly distribute force production and twitch duration with contraction. These results suggest that the PCr shuttle and associated enzymatic reactions act to maintain uniform force dynamics in the cell despite the heterogeneous mitochondrial organization. However, our model also predicts that under hypoxia activity of mitochondrial CK enzymes and diffusion of high-energy phosphate compounds may be insufficient to sustain uniform ATP/ADP distribution and hence force generation.


Conflict of interest statement

The authors have declared that no competing interests exist.

Figures

Fig 1
Fig 1. EM image of a single cardiac myocyte.
(A): A Longitudinal section from the SBF-SEM images of a single cardiomyocyte with mitochondria in dark regions and myofibril/nucleus in light regions. (B-D): Cross sections (1–3) corresponding to the location of three white dotted lines in the longitudinal section. Section 1 is located near a branching point, and section 2 is located close to a nucleus, however none of the sections contain a nucleus.
Fig 2
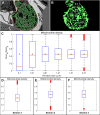
Fig 2. Analysis of mitochondrial distribution in different cross-sections.
(A) Cross-section 1 with mitochondria segmented in green and sarcolemma in red. (B) Square windows representing the ratio of mitochondrial area vs myofibrilar area present inside these windows (C) Statistical box plots of the distribution of these ratios corresponding to different sizes of the square windows. The star in the middle of box plots represents the area fraction of total mitochondria present in section 1. (D-F): Box plot representing the distribution of mitochondrial density at various points in the cross-section 1–3. The stars represent the total mitochondrial area fraction present in each cross section. Mitochondrial area fraction is 55% in section 2 and 3 and 45% in section 1.
Fig 3
Fig 3. Model assumptions and FE mesh generation from EM image cross-sections.
(A): We assumed that individual mitochondria that cluster together will share a common inner membrane space. (B): Based on this assumption, each mitochondrial cluster was divided into two regions: an IMS region, depicted in green and a matrix region, depicted in blue. A third region depicted in red covers the myofibrils present in the cell. (C): Image of a FE mesh developed from the EM image of cross-section 1 with the three different regions.
Fig 4
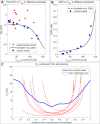
Fig 4. Model validation with experimental results.
(A): Comparison between our model-predicted, spatially averaged PCr/ATP ratio vs VO2 with model predictions from Vendelin et al. [13] and experimental results from Valdur Saks et al. [28] (B): Comparison between our model predictions for spatially averaged ADP vs VO2 with predictions from Vendelin et al.’s [13] zero dimensional model (C): Comparison between model predicted radial profiles of O2 with intracellular PO2 levels calculated by Takahashi et al. [29] in six different isolated cells.
Fig 5
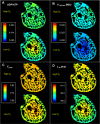
Fig 5. Spatial variation in model predicted cytosolic phosphagen levels and reaction rates represented using colour spectrum.
All the figures were generated by using the same range of colour spectrum for a particular phosphagen. (A-C): EM images of sections 1–3 (D-F): Distribution of ADP and ATP in the cross-sections represented using the ADP/ATP ratio. The ADP/ATP ratio remains uniform throughout the cross-sections (G-I): Inorganic phosphate (Pi) shows large spatial variation at the order of 1 mM. (J-L): Spatial variation in the ATP hydrolysis rate in the myofibrils corresponding to XATPase = 0.05 μM/sec.
Fig 6
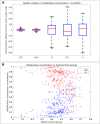
Fig 6. Spatial variation in phosphagens concentration in cross section 1.
(A): Phosphagen concentrations were calculated at all the myofibril points in the mesh and subtracted from the spatially averaged concentration of each phosphagen (Phosgave). Box plots represent the statistical distribution of the difference between phosphagen concentration at each point and Phosgave value of each phosphagen. The zero value corresponds to the Phosgave. (B): Normalized concentration of PCr and Cr displayed as a function of local mitochondrial density at various points in the cell. PCr and Cr concentrations were normalized by a factor equivalent to the difference of PCr and Cr maximum and minimum concentrations in cross section 1.
Fig 7
Fig 7. Force dynamics of the cell corresponding to the model predicted phosphagens distribution.
(A-C): Fpeak is uniform across section 1 and exhibits slight spatial variation in section 2 and 3. (D-F): t95 shows similar spatial gradients across the cross sections.
Fig 8
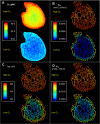
Fig 8. Spatial variation in model predicted mitochondrial reaction rates and O2 profiles for cross section 1.
All the figures were generated by using same colour spectrum range. (A): Steady state O2 profiles showing steep O2 gradients in the vicinity of the sarcolemma. In the hypoxic case, it also leads to the formation of an anoxic core with negligible O2 level (B): The reduction of oxygen at complex IV is inhibited in hypoxia, while it is uniform across the section in normoxia. (C): Hypoxia leads to a steep gradient in the model predictions for mitochondrial membrane potential (D): Under normoxia Complex V (F1-F0 ATP synthase) reaction rate is nearly uniform across the cell with slight variation near the larger mitochondrial clusters. However, ATP synthesis at Complex V is inhibited in the anoxic core under hypoxia.
Fig 9
Fig 9. Spatial variation in rates of CK enzymatic reactions involved in phosphocreatine shuttle under normoxia and hypoxia.
All the figures were generated by using same colour spectrum range. (A): Steady state profiles of reaction rates of mitochondrial mtCK in forward direction (ATP + Cr → PCr + ADP) (B): Steady state profiles showing reaction rates of myofibrilar MCK in reverse direction (PCr + ADP → ATP + Cr).
Fig 10
Fig 10. Spatial variation in cytosolic metabolite concertation and force dynamics under normoxia and hypoxia.
(A): Steady state profiles of ADP/ATP ratio. ADP/ATP is significantly higher in the anoxic cell core under low O2 supply (B): ATP hydrolysis rate is similarly lower in the cell core under hypoxic condition (C): Peak twitch force (Fpeak) is significantly higher in the cell core under hypoxia (D): Increased Fpeak is complemented by increased twitch duration in the cell core, which can lead to loss of energy in the form of shear strain.

References

    1. Bittl JA, Ingwall JS. Reaction rates of creatine kinase and ATP synthesis in the isolated rat heart. A 31P NMR magnetization transfer study. Journal of Biological Chemistry. 1985;260(6):3512–7. - PubMed
    1. Katz LA, Swain JA, Portman MA, Balaban RS. Relation between phosphate metabolites and oxygen consumption of heart in vivo. American Journal of Physiology-Heart and Circulatory Physiology. 1989;256(1):H265–H74. 10.1152/ajpheart.1989.256.1.H265 . - DOI - PubMed
    1. Williamson JR, Ford C, Illingworth J, Safer B. Coordination of citric acid cycle activity with electron transport flux. Circulation research. 1976;38(5 Suppl 1):I39–I51. - PubMed
    1. Vendelin M, Béraud N, Guerrero K, Andrienko T, Kuznetsov AV, Olivares J, et al. Mitochondrial regular arrangement in muscle cells: a “crystal-like” pattern. American Journal of Physiology—Cell Physiology. 2005;288(3):C757–C67. 10.1152/ajpcell.00281.2004 - DOI - PubMed
    1. Birkedal R, Shiels HA, Vendelin M. Three-dimensional mitochondrial arrangement in ventricular myocytes: from chaos to order. American Journal of Physiology—Cell Physiology. 2006;291(6):C1148–C58. 10.1152/ajpcell.00236.2006 - DOI - PubMed

Publication types

MeSH terms