Base composition is the primary factor responsible for the variation of amino acid usage in zebra finch (Taeniopygia guttata)
- PMID: 30517105
- PMCID: PMC6281210
- DOI: 10.1371/journal.pone.0204796
Base composition is the primary factor responsible for the variation of amino acid usage in zebra finch (Taeniopygia guttata)
Abstract
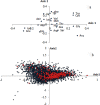
In the present study, we carried out an examination of the amino acid usage in the zebra finch (Taeniopygia guttata) proteome. We found that tRNA abundance, base composition, hydrophobicity and aromaticity, protein second structure, cysteine residue (Cys) content and protein molecular weight had significant impact on the amino acid usage of the zebra finch. The above factors explained the total variability of 22.85%, 25.37%, 10.91%, 5.06%, 4.21%, and 3.14%, respectively. Altogether, approximately 70% of the total variability in zebra finch could be explained by such factors. Comparison of the amino acid usage between zebra finch, chicken (Gallus gallus) and human (Homo sapiens) suggested that the average frequency of various amino acid usage is generally consistent among them. Correspondence analysis indicated that base composition was the primary factor affecting the amino acid usage in zebra finch. This trend was different from chicken, but similar to human. Other factors affecting the amino acid usage in zebra finch, such as isochore structure, protein second structure, Cys frequency and protein molecular weight also showed the similar trends with human. We do not know whether the similar amino acid usage trend between human and zebra finch is related to the distinctive neural and behavioral traits, but it is worth studying in depth.
Conflict of interest statement
The authors have declared that no competing interests exist.
Figures


Similar articles
-
Identification and characterization of the zebra finch (Taeniopygia guttata) sperm proteome.J Proteomics. 2019 Feb 20;193:192-204. doi: 10.1016/j.jprot.2018.10.009. Epub 2018 Oct 23. J Proteomics. 2019. PMID: 30366121
-
Molecular phylogenetic analysis of zebra finch basic helix-loop-helix transcription factors.Biochem Genet. 2011 Apr;49(3-4):226-41. doi: 10.1007/s10528-010-9401-9. Epub 2010 Dec 17. Biochem Genet. 2011. PMID: 21165766
-
Accelerated evolution of PAK3- and PIM1-like kinase gene families in the zebra finch, Taeniopygia guttata.Mol Biol Evol. 2010 Aug;27(8):1923-34. doi: 10.1093/molbev/msq080. Epub 2010 Mar 17. Mol Biol Evol. 2010. PMID: 20237222 Free PMC article.
-
Discovery of the First Germline-Restricted Gene by Subtractive Transcriptomic Analysis in the Zebra Finch, Taeniopygia guttata.Curr Biol. 2018 May 21;28(10):1620-1627.e5. doi: 10.1016/j.cub.2018.03.067. Epub 2018 May 3. Curr Biol. 2018. PMID: 29731307 Free PMC article.
-
Neuroendocrine regulation of long-term pair maintenance in the monogamous zebra finch.Horm Behav. 2015 Nov;76:11-22. doi: 10.1016/j.yhbeh.2015.04.014. Epub 2015 Apr 29. Horm Behav. 2015. PMID: 25935729 Review.
Cited by
-
Molecular Spatiomics by Proximity Labeling.Acc Chem Res. 2022 May 17;55(10):1411-1422. doi: 10.1021/acs.accounts.2c00061. Epub 2022 May 5. Acc Chem Res. 2022. PMID: 35512328 Free PMC article.
References
-
- Rispe C, Delmotte F, van Ham RC and Moya A (2004) Mutational and selective pressures on codon and amino acid usage in Buchnera, endosymbiotic bacteria of aphids. Genome Res. 14(1): 44–53. 10.1101/gr.1358104 - DOI - PMC - PubMed
-
- Rao YS, Wang ZF, Chai XW, Nie QH and Zhang XQ (2014) Hydrophobicity and aromaticity are primary factors shaping variation in amino acid usage of chicken proteome. PLoS One 9(10):e110381 10.1371/journal.pone.0110381 - DOI - PMC - PubMed
-
- Palacios C and Wernegreen J J (2002) A strong effect of AT mutational bias on amino acid usage in Buchnera is mitigated at high-expression genes. Mol. Biol. Evol. 19(9): 1575–84. 10.1093/oxfordjournals.molbev.a004219 - DOI - PubMed
-
- Lightfield J, Fram NR and Ely B (2011) Across bacterial phyla, distantly-related genomes with similar genomic GC content have similar patterns of amino acid usage. PLoS One 6(3): e17677 10.1371/journal.pone.0017677 - DOI - PMC - PubMed
Publication types
MeSH terms
Substances
LinkOut - more resources
Full Text Sources

