. 2018 Dec 5;13(12):e0206817.
doi: 10.1371/journal.pone.0206817. eCollection 2018.

Traveling pulse emerges from coupled intermittent walks: A case study in sheep

Affiliations

Traveling pulse emerges from coupled intermittent walks: A case study in sheep

Manon Azaïs et al. PLoS One. .

Abstract

Monitoring small groups of sheep in spontaneous evolution in the field, we decipher behavioural rules that sheep follow at the individual scale in order to sustain collective motion. Individuals alternate grazing mode at null speed and moving mode at walking speed, so cohesive motion stems from synchronising when they decide to switch between the two modes. We propose a model for the individual decision making process, based on switching rates between stopped / walking states that depend on behind / ahead locations and states of the others. We parametrize this model from data. Next, we translate this (microscopic) individual-based model into its density-flow (macroscopic) equations counterpart. Numerical solving these equations display a traveling pulse propagating at constant speed even though each individual is at any moment either stopped or walking. Considering the minimal model embedded in these equations, we derive analytically the steady shape of the pulse (sech square). The parameters of the pulse (shape and speed) are expressed as functions of individual parameters. This pulse emerges from the non linear coupling of start/stop individual decisions which compensate exactly for diffusion and promotes a steady ratio of walking / stopped individuals, which in turn determines the traveling speed of the pulse. The system seems to converge to this pulse from any initial condition, and to recover the pulse after perturbation. This gives a high robustness to this coordination mechanism.


Conflict of interest statement

The authors have declared that no competing interests exist.

Figures

Fig 1
Fig 1. Coordination of motion illustrated in one experimental group of 3 sheep.
The position and behaviour of each individual is monitored every 1s during 1800 s. The collective behaviour can be categorised as periods of collective grazing (individuals are about motionless) interspersed by periods of collective walking (high speed motion). (a) An extract of 70 s shows a typical event of collective transition from grazing to walking, leading to a spatial shift of the group to a new location where individuals resume grazing. (b) The data are idealised by binarizing individual speed (0,1) and the motion is projected in 1D along the axis of collective motion. (c) The same event reported in time shows that the collective starts and stops are triggered by sheep synchronising their transition from grazing to walking (and back) within time windows by far shorter than typical duration of grazing / walking periods. (d) Time-space representation of group evolution in 1D. Alternating synchronously grazing/walking/grazing over large time (1800 s) lead to a collective intermittent progression along the curvilinear abscissa S of the group trajectory. The extracted event of 70 s is highlighted.
Fig 2
Fig 2. Mimetic amplification governs individual transition rates.
(a) For each group size (2,3,4,8), we report the individual transition rate from stopped to moving as a function of the number of individuals moving ahead. This rate increases, indicating that individuals moving ahead have a positive feedback effect upon the propensity to follow them (stimulating effect). Note that, for a given number of departed individuals (e.g. 1), the rate decreases with group size, indicating an inhibitory effect of other individuals. Open circles: data, crosses: fitted rates. (b) For each group size, simulating collective departures using the fitted transition rates yields a correct prediction of the average event duration, from first start to last start, as a function of group size (10000 simulated events, dotted lines indicate 95% CI of the mean). (c) Same kind of data and fitted rates, but for the moving-to-stopped rates. While en route, stopping rates are positively enhanced by the number of individuals stopped behind (stimulating effect), together with a inhibitory effect of the others. (d) Events simulations also confirm that the fitted stopping rates yield correct predicted average event duration, from first stop to last stop, as a function of group size. Fitted parameters are indicated in Table 1.
Fig 3
Fig 3. Individual-based model (IBM) prediction for 1D-propagation.
(a) The evolution of one experimental group of 4 sheep is reported for illustration (same time-space representation as Fig 1d). (b) A typical evolution of a simulated 4-sheep group is reported for visual comparison with (a). This evolution is one stochastic realisation of the IBM, computed with an exact Monte Carlo (Gillespie algorithm was used), using the fitted rates and μA = 0.0055 (s−1). (c) Average distance walked by experimental groups over 1800 s, for each group size separately (thiner line: N = 2, thicker line: N = 8). (d) Corresponding IBM predictions, averaging over 100 simulations per group size, like the one reported in (b).
Fig 4
Fig 4. Predicted packing as a function of the intensity of the stimulating effect.
To examine the transition from mostly diffusive regime to mostly advective regime, we varied the stimulation parameters αA and αI by a multiplying factor spanning from 10−4 to 102 (keeping the spontaneous parameters μA and μI constant). For each value, we collected the average dispersal of the groups from 1000 Monte Carlo simulations with N = 4 individuals at time t = 1000 s. The dispersion was estimated from the range of the positions divided by N − 1, giving the average distance between two neighbours (meters/sheep). To the left of abcissa (μ/α → ∞), spontaneous switching dominates over imitation while to the right (μ/α → 0), imitation is dominant. Group dispersion shows a smooth transition (over the log scale of the modulation factor) from the left where diffusion is completely dominant and saturating to the right where the packing of the group tends to 0. We note that in the latter limit, crowding effects should be taken into account. The biological values (modulation factor = 1) appears to favor maximally the cohesion (about one sheep every meter).
Fig 5
Fig 5. Density Model prediction for 1D-propagation.
(a) The predicted evolution of a group of 4 sheep is the formation of a traveling pulse, which travels at constant speed, and with no dispersion (the leftmost profile is the initial condition, the rightmost profile is at time 1800 s, intermediate profiles are every 100 s; numerical solution of Eqs 5 and 6, with Δt = 10−2 s). (b) The stabilised profile (black line, at time 1800 s) is zoomed out to show the density distribution around the group center of mass (0 abscissa). It displays a slight asymmetry (vertical line through the distribution peak for visual guidance), with an excess of density in the left tail (at the rear of the group). The underlying densities of stopped (blue) and moving (red) appear homogeneously proportional to the total.
Fig 6
Fig 6. Density Model predictions vs. IBM predictions.
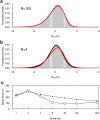
(a) Histogram: statistics of presence around the center of mass of the group for N = 100, predicted from 300 IBM realisations; red line: numerical solution of Eqs 5 and 6 (Δt = 10−2 s). (b) Histogram: statistics of presence around the center of mass of the group for N = 4, predicted from 106 IBM realisations; red line: numerical solution of Eqs 5 and 6 (Δt = 10−2 s); black line: statistics of presence around the center of mass for groups of 4 positions sampled from the red curve, and applying the same procedure than the one used to obtain the histogram from IBM realisations (106 samples). (c) Predicted propagation speed depending on group size. Open dots: IBM predictions (error bars lie within the point size). Black dots: Density Model predictions.
Fig 7
Fig 7. Moving fraction as a function of group size, varying individual parameters.
(a) The symmetrical imitations case is reported in black, with αA = αI = α = 0.5, μA*=0.02 and μI*=0.08. Blue curves: αA = 1.001α and αA = 1.01α keeping αI = α, and red curves: same variations for αI keeping αA = α. (b) Setting αA = 1.001 α, μI is varied from lower (blue) to higher (red) values than μI* (black). Variations correspond respectively to division or multiplication by 2, 10 and 100. (c) Setting αI = 1.001α, μI is similarly varied from lower (blue) to higher (red) values than μI* (black). (d) Setting αI = 1.001α, μA is similarly varied from lower (blue) to higher (red) values than μA* (black).
Fig 8
Fig 8. Moving fraction as a function of group size, varying individual parameters (Variant Model).
Same legend as Fig 7 (same parameters, same parameter variations). Note the expanded scale in (d) to clearly show the effect; the upper red curve starts to decrease around N = 8000.

Similar articles

Cited by

References

    1. Sumpter DJT. The principles of collective animal behaviour. Philos Trans R Soc Lond B Biol Sci. 2006;361(1465):5–22. 10.1098/rstb.2005.1733 - DOI - PMC - PubMed
    1. Eftimie R, de Vries G, Lewis Ma. Complex spatial group patterns result from different animal communication mechanisms. Proc Natl Acad Sci U S A. 2007;104(17):6974–6979. 10.1073/pnas.0611483104 - DOI - PMC - PubMed
    1. Tindall MJ, Maini PK, Porter SL, Armitage JP. Overview of mathematical approaches used to model bacterial chemotaxis II: Bacterial populations. Bulletin of Mathematical Biology. 2008;70(6):1570–1607. 10.1007/s11538-008-9322-5 - DOI - PubMed
    1. Saragosti J, Calvez V, Bournaveas N, Buguin A, Silberzan P, Perthame B. Mathematical description of bacterial traveling pulses. PLoS Comput Biol. 2010;6(8). 10.1371/journal.pcbi.1000890 - DOI - PMC - PubMed
    1. Sumpter DJT. Collective Animal Behavior. Princeton, NJ: Princeton University Press; 2010.

Publication types