

The Portuguese version of the European Deprivation Index: Development and association with all-cause mortality
- PMID: 30517185
- PMCID: PMC6281298
- DOI: 10.1371/journal.pone.0208320
The Portuguese version of the European Deprivation Index: Development and association with all-cause mortality
Abstract
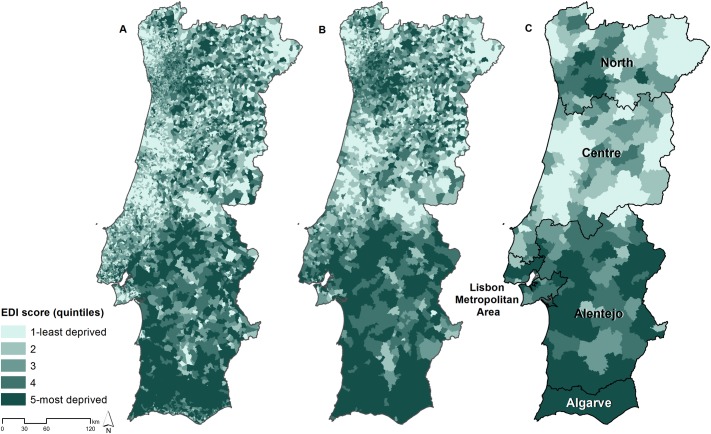
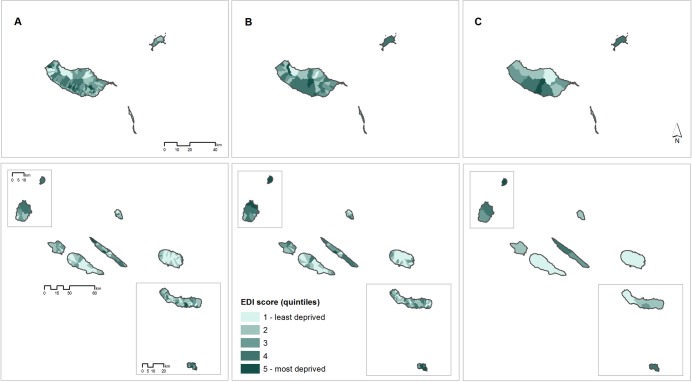
Socioeconomic inequalities are major health determinants. To monitor and understand them at local level, ecological indexes of socioeconomic deprivation constitute essential tools. In this study, we describe the development of the updated version of the European Deprivation Index for Portuguese small-areas (EDI-PT), describe its spatial distribution and evaluate its association with a general health indicator-all-cause mortality in the period 2009-2012. Using data from the 2011 European Union-Statistics on Income and Living Conditions Survey (EU-SILC), we obtained an indicator of individual deprivation. After identifying variables that were common to both the EU-SILC and the census, we used the indicator of individual deprivation to test if these variables were associated with individual-level deprivation, and to compute weights. Accordingly, eight variables were included. The EDI-PT was produced for the smallest area unit possible (n = 18084 census block groups, mean/area = 584 inhabitants) and resulted from the weighted sum of the eight selected variables. It was then categorized into quintiles (Q1-least deprived to Q5-most deprived). To estimate the association with mortality we fitted Bayesian spatial models. The EDI-PT was unevenly distributed across Portugal-most deprived areas concentrated in the South and in the inner North and Centre of the country, and the least deprived in the coastal North and Centre. The EDI-PT was positively and significantly associated with overall mortality, and this relation followed a rather clear dose-response relation of increasing mortality as deprivation increases (Relative Risk Q2 = 1.012, 95% Credible Interval 0.991-1.033; Q3 = 1.026, 1.004-1.048; Q4 = 1.053, 1.029-1.077; Q5 = 1.068, 1.042-1.095). Summing up, we updated the index of socioeconomic deprivation for Portuguese small-areas, and we showed that the EDI-PT constitutes a sensitive measure to capture health inequalities, since it was consistently associated with a key measure of population health/development, all-cause mortality. We strongly believe this updated version will be widely employed by social and medical researchers and regional planners.
Conflict of interest statement
The authors have declared that no competing interests exist.
Figures
References
-
- Stringhini S, Carmeli C, Jokela M, Avendaño M, Muennig P, Guida F, et al. Socioeconomic status and the 25 × 25 risk factors as determinants of premature mortality: a multicohort study and meta-analysis of 1·7 million men and women. The Lancet. 2017;389(10075):1229–37. 10.1016/S0140-6736(16)32380-7 - DOI - PMC - PubMed
-
- Marmot M, Allen J, Bell R, Bloomer E, Goldblatt P. WHO European review of social determinants of health and the health divide. The Lancet. 2012;380(9846):1011–29. 10.1016/s0140-6736(12)61228-8 - DOI - PubMed
-
- Cabrera-Barona P, Ghorbanzadeh O. Comparing Classic and Interval Analytical Hierarchy Process Methodologies for Measuring Area-Level Deprivation to Analyze Health Inequalities. International Journal of Environmental Research and Public Health. 2018;15(1). 10.3390/ijerph15010140 - DOI - PMC - PubMed
-
- Spatial Aggregation and the Ecological Fallacy. Chapman & Hall/CRC handbooks of modern statistical methods. 2010;2010:541–58. 10.1201/9781420072884-c30 PMC4209486. - DOI - PMC - PubMed
