. 2019 Apr 15;28(8):1227-1243.
doi: 10.1093/hmg/ddy416.

TUBA1A mutations identified in lissencephaly patients dominantly disrupt neuronal migration and impair dynein activity

Affiliations

TUBA1A mutations identified in lissencephaly patients dominantly disrupt neuronal migration and impair dynein activity

Jayne Aiken et al. Hum Mol Genet. .

Abstract

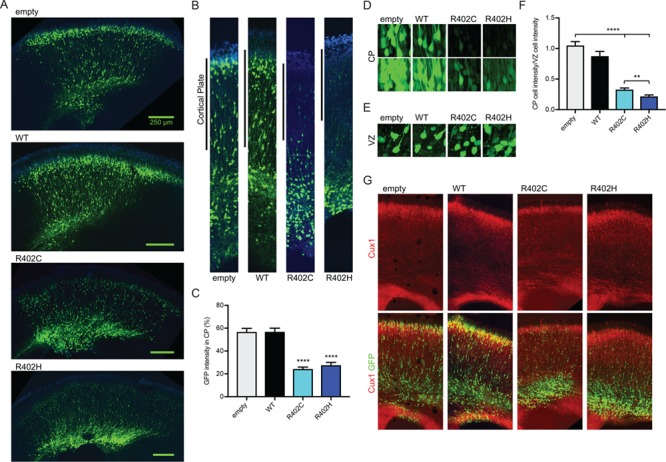
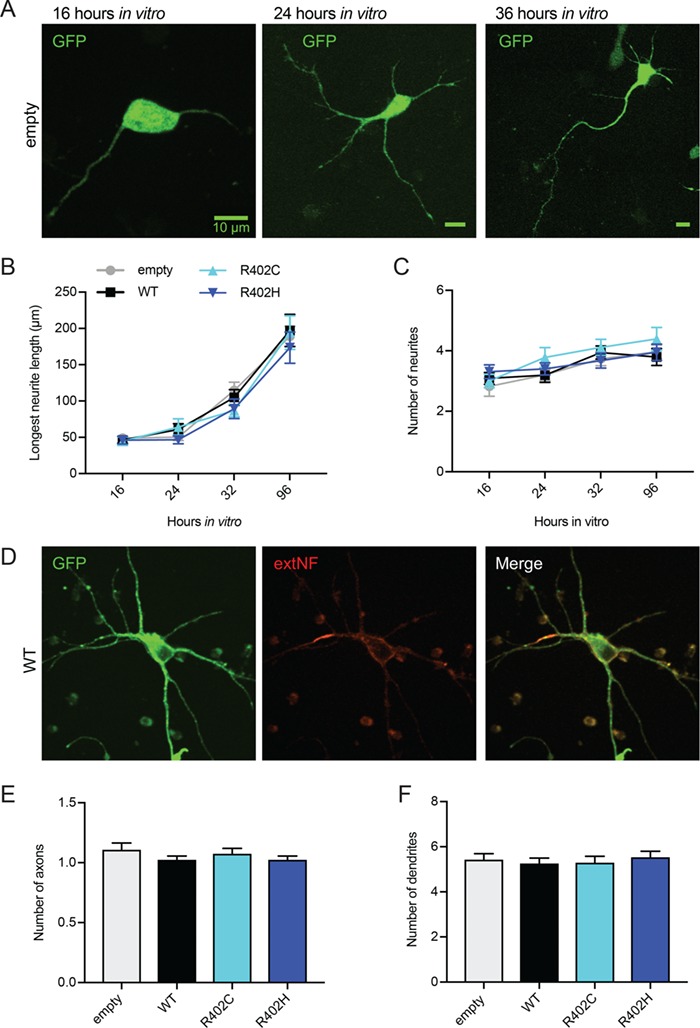
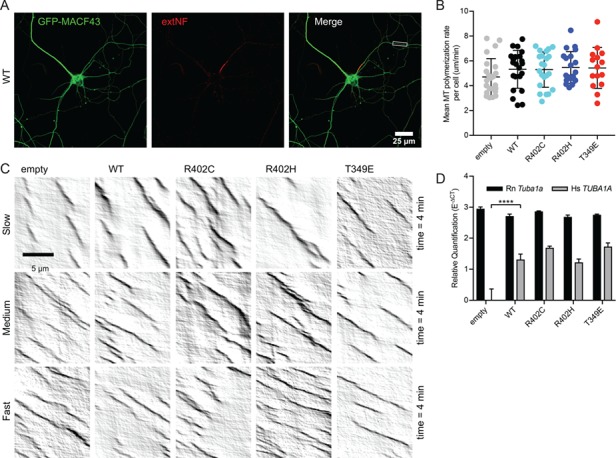
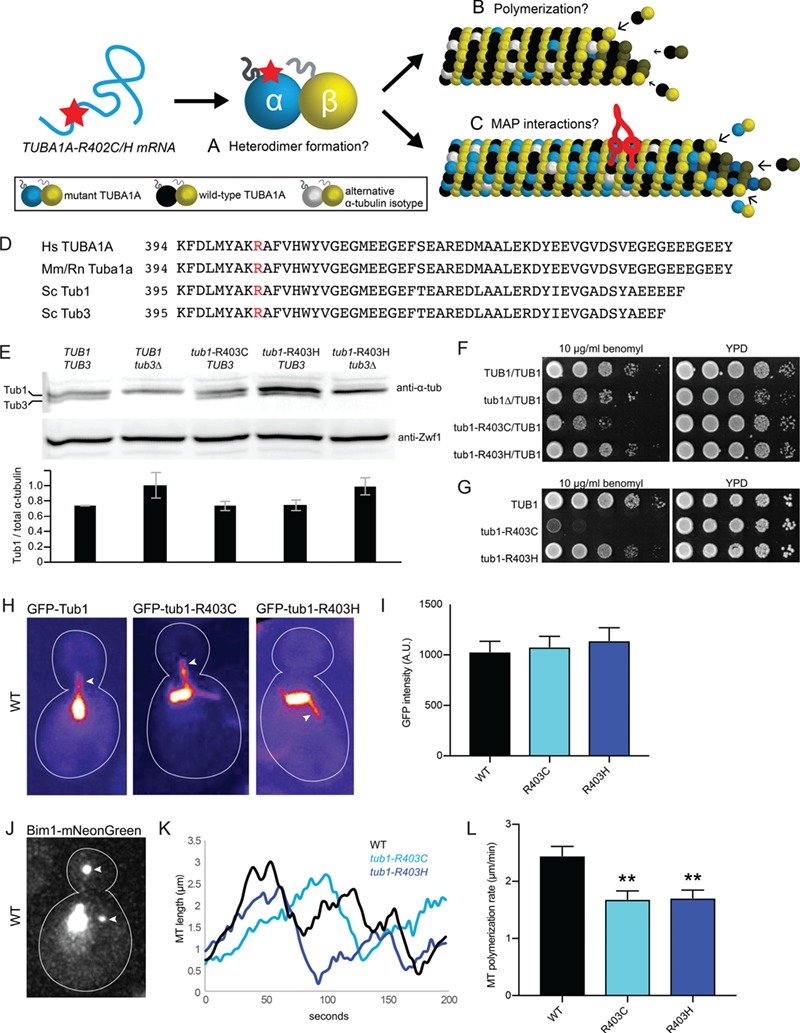
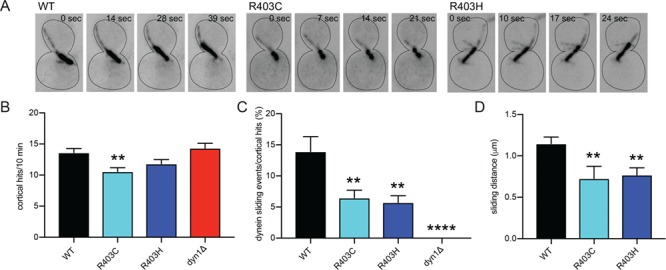
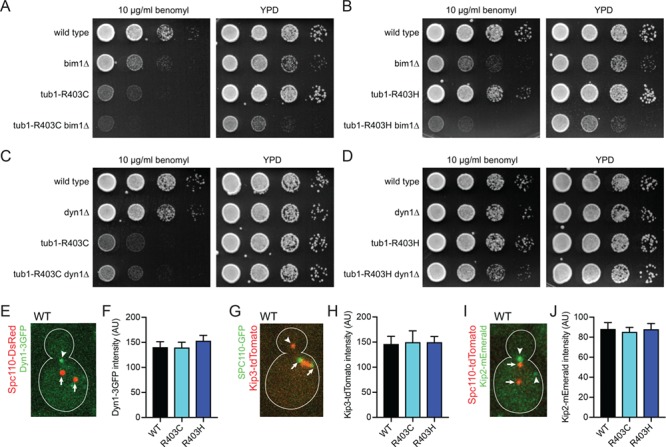
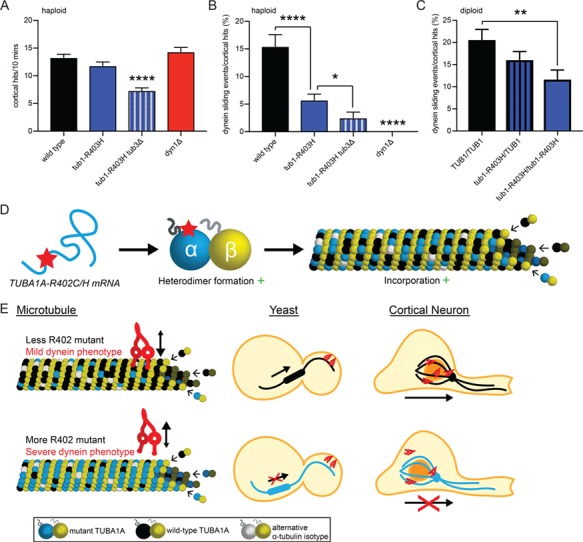
The microtubule cytoskeleton supports diverse cellular morphogenesis and migration processes during brain development. Mutations in tubulin genes are associated with severe human brain malformations known as 'tubulinopathies'; however, it is not understood how molecular-level changes in microtubule subunits lead to brain malformations. In this study, we demonstrate that missense mutations affecting arginine at position 402 (R402) of TUBA1A α-tubulin selectively impair dynein motor activity and severely and dominantly disrupt cortical neuronal migration. TUBA1A is the most commonly affected tubulin gene in tubulinopathy patients, and mutations altering R402 account for 30% of all reported TUBA1A mutations. We show for the first time that ectopic expression of TUBA1A-R402C and TUBA1A-R402H patient alleles is sufficient to dominantly disrupt cortical neuronal migration in the developing mouse brain, strongly supporting a causal role in the pathology of brain malformation. To isolate the precise molecular impact of R402 mutations, we generated analogous R402C and R402H mutations in budding yeast α-tubulin, which exhibit a simplified microtubule cytoskeleton. We find that R402 mutant tubulins assemble into microtubules that support normal kinesin motor activity but fail to support the activity of dynein motors. Importantly, the level of dynein impairment scales with the expression level of the mutant in the cell, suggesting a 'poisoning' mechanism in which R402 mutant α-tubulin acts dominantly by populating microtubules with defective binding sites for dynein. Based on our results, we propose a new model for the molecular pathology of tubulinopathies that may also extend to other tubulin-related neuropathies.


Figures

Figure 1
Figure 1
Tuba1a-R402C/H mutants dominantly disrupt neuronal migration in the developing mouse cortex. (A) Coronal sections from E18.5 mouse brain electroporated at E14.5 with pCIG2 vectors: empty vector (empty), WT TUBA1A (WT), TUBA1A-R402C (R402C) or TUBA1A-R402H (R402H). (B) Representative regions of cortex analyzed for cortical plate fluorescence. (C) Percentage of GFP signal in the cortical plate. For each condition, three coronal sections from at least four separate animals were analyzed. Data are represented as mean ± SEM. Quadruple asterisks indicate significant difference compared to WT, by t-test (P < 0.0001). (D) Representative images of cortical plate neurons for each condition, at two different exposures. (E) Representative images ventricular zone neurons for each condition. (F) Quantification of mean GFP intensity of cortical plate neurons normalized GFP intensity of ventricular zone neurons. Data are represented as mean ± SEM. At least 45 neurons for each condition were measured (Region of interest (ROI) = 200 μm2). Quadruple asterisks indicate significant difference compared to WT, by t-test (P < 0.0001). Double asterisks indicate significant difference compared to WT, by t-test (P < 0.01). (G) Cux1 staining of electroporated sections reveals position of upper layer cortical neurons.
Figure 2
Figure 2
Neuron morphology is not significantly altered by ectopic expression of TUBA1A-R402C/H mutants. (A) Representative images of primary rat cortical neurons expressing pCIG2-ires-GFP at 16, 24 and 36 h in vitro. (B and C) Longest neurite length (B) or neurite number (C) tracked over 16 to 96 h in vitro from neurons expressing pCIG2 vectors. (D) DIV11 neuron expressing pCIG2-Tuba1a(WT)-ires-GFP stained with extNF to mark the AIS. (E and F) Number of axons (E) or dendrites (F) in neurons expressing pCIG2 vectors.
Figure 3
Figure 3
Ectopic expression of TUBA1A mutant alleles is not sufficient to disrupt axonal microtubule polymerization in primary neuronal culture. (A) Representative image of DIV11 primary rat cortical neuron expressing pCIG2-Tuba1a(WT)-ires-GFP-MACF43 and live-stained with extNF to reveal AIS. Inset reveals axonal segment selected for kymograph analysis. (B) Microtubule polymerization rate. Each data point represents cellular mean microtubule polymerization rate, with bars displaying mean ± SEM. No significant differences to empty vector or WT control, with significance determined as P < 0.05. (C) Representative kymographs from each condition displaying variation in microtubule polymerization rates observed across cells. (D) Relative quantification of endogenous, rat Tuba1a (Rn Tuba1a) and ectopic, human TUBA1A (Hs TUBA1A) mRNA levels using RT-qPCR on RNA isolated from GFP-positive neuron population after FACS. Data are represented as mean ± standard deviation. Quadruple asterisks indicate significant difference compared to WT, by t-test (P < 0.0001).
Figure 4
Figure 4
α-tubulin R402C/H mutants form polymerization-competent tubulin heterodimers in Saccharomyces cerevisiae. (AC) Possible consequences of α-tubulin R402C/H mutants on tubulin function. R402C/H mutants may disrupt tubulin heterodimer formation (A), polymerization into microtubule lattice (B) and/or microtubule-associated-protein interactions (C). (D) Amino acid alignment of α-tubulin protein C-terminal region with conserved arginine of interest in red. Hs, Homo sapiens; Mm, Mus musculus; Rn, R. norvegicus; Sc, S. cerevisiae. (E) Western blot of α-tubulin protein in lysates from the indicated strains. Blots were also probed for Zwf1/G6PD as a loading control. Intensity of α-tubulin bands from three separate experiments, normalized to Zwf1 loading control. Data are represented as mean ± SEM. Strains: WT, yJM596; tub3∆, yJM0103; tub1-R403C, yJM2240, yJM2245; tub1-R403H, yJM2121, yJM2263; tub1-R403H tub3∆, yJM2533. (F) Growth assay for heterozygous diploid tub1-R403 mutants on rich media or rich media supplemented with the microtubule-destabilizing drug, benomyl, (10 μg/ml), incubated at 30°C. Strains: WT, yJM0091; tub1∆/TUB1, 0591; tub1-R403C/TUB1, yJM2364, yJM2365; tub1-R403H, yJM2366, yJM2367. (G) Growth assay for haploid tub1-R403 mutants grown on rich media or benomyl-supplemented rich media (10 μg/ml), incubated at 30°C. Strains: WT, yJM1839, yJM1840; tub1-R403C, yJM2120, yJM2239; tub1-R403H, yJM2121, yJM2122. (H) Images of microtubules labeled with GFP-Tub1, GFP-tub1-R403C or GFP-tub1-R403H. Arrows point to astral microtubules. (I) Quantification of GFP signal per micron of astral microtubule. At least 29 microtubules were measured for each strain. Data are represented as mean ± SEM. Strains: WT GFP-TUB1, yJM1237, yJM1887, yJM0562; GFP-tub1-R403C, yJM1872, yJM2112, yJM2113; GFP-tub1-R403H, yJM1873, yJM2114, yJM2115. (J) Image of a WT cell expressing Bim1-mNeonGreen. Arrows point to astral microtubule plus ends. (K) Representative life plots of astral microtubule dynamics in WT, tub1-R403C and tub1-R403H mutants. Astral microtubule length was measured over time as the distance between Bim1-mNeonGreen at the microtubule plus end and the minus end at the proximal spindle pole. (L) Mean polymerization rates. Data are represented as mean ± SEM. Double asterisks indicate significant difference compared to WT, by t-test (P < 0.01). Strains: WT, yJM2188, yJM2189; tub1-R403C, yJM2190, yJM2191; tub1-R403H, yJM2192, yJM2193.
Figure 5
Figure 5
α-tubulin R402C/H mutants disrupt dynein activity in S. cerevisiae. (A) Time-lapse images of WT, tub1-R403C or tub1-R403H cells labeled with GFP-Tub1, GFP-tub1-R403C or GFP-tub1-R403H, respectively, to illustrate representative dynein sliding events. Dynein sliding is defined by spindle translocation initiated by a microtubule–cortex interaction. (B) Quantification of microtubule–cortical hits in a 10 min period. (C) Percent of microtubule–cortex hits that become dynein sliding events in a 10 min period. (D) Quantification of average sliding distance, measured by spindle translocation during sliding event (μm). At least 34 cells were analyzed for each strain. Data are represented as mean ± SEM. Double asterisks indicate significant difference compared to WT, by t-test (P < 0.01). Quadruple asterisks indicate significant difference compared to WT, by t-test (P < 0.0001). Strains: WT, yJM1887; dyn1∆, 1023; tub1-R403C, yJM2216; tub1-R403H, yJM2218.
Figure 6
Figure 6
α-tubulin R402C/H mutants in S. cerevisiae act in the dynein spindle positioning pathway. (A and B) Genetic interaction test of tub1-R403C (A) and tub1-R403H (B) mutants with bim1∆, a member of the compensatory spindle positioning pathway. Indicated strains were grown on rich media or rich media supplemented with benomyl (10 μg/ml), incubated at 30°C. Strains: WT, yJM2243, yJM2252; bim1∆, yJM2246, yJM2249; tub1-R403C, yJM2245; tub1-R403C bim1∆, yJM2244; tub1-R403H, yJM2251; tub1-R403H bim1∆, yJM2250. (C and D) Genetic interaction test of tub1-R403C (C) and tub1-R403H (D) mutants with dyn1∆. Indicated strains were grown on rich media or rich media supplemented with benomyl (10 μg/ml), incubated at 30°C. Strains: WT, yJM2256, yJM2261; dyn1∆, yJM2255, yJM2264; tub1-R403C, yJM2258; tub1-R403C dyn1∆, yJM2257; tub1-R403H, yJM2263; tub1-R403H dyn1∆, yJM2262. (E) Image of a WT cell expressing Dyn1-3GFP and spindle pole marker Spc110-DsRed. Arrowhead points to dynein localized to astral microtubule plus end. Arrows point to spindle pole bodies. (F) Quantification of GFP signal at microtubule plus ends. At least 39 dynein-plus-end foci were measured for each strain. Error bars are SEM. Strains: WT, yJM0307, yJM0308; tub1-R403C, yJM2202, yJM2203; tub1-R403H, yJM2204. (G) Image of a WT cell expressing Kip3-tdTomato and Spc110-GFP. Arrowhead points to Kip3 accumulated at astral microtubule plus end. Arrows point to spindle pole bodies. (H) Quantification of tdTomato signal at plus ends. At least 20 Kip3-plus-end foci were measured for each strain. Data are represented as mean ± SEM. Strains: WT, yJM2696, yJM2716; tub1-R403C, yJM2698, yJM2718; tub1-R403H, yJM2697, yJM2717. (I) Image of a WT cell expressing Kip2-mEmerald and Spc110-tdTomato. Arrowheads point to Kip2 accumulated at astral microtubule plus end. Arrows point to spindle pole bodies. (J) Quantification of mEmerald signal at plus ends. 40 Kip2-plus-end foci were measured for each strain. Data are represented as mean ± SEM. Strains: WT, yJM2693, yJM3177; tub1-R403C, yJM2694, yJM3178; tub1-R403H, yJM2695, yJM2715.
Figure 7
Figure 7
Dynein activity disruption scales with abundance of α-tubulin R402 mutant. (A) Quantification of microtubule–cortical hits in a 10 min period for the indicated strains. (B) Quantification of dynein sliding events normalized to microtubule–cortical hits in haploid cells with varying levels of tub1-R403H mutant, displayed as percentage. At least 27 cells were analyzed for each strain. Data are represented as mean ± SEM. Single asterisks indicate significant difference compared to WT, by t-test (P < 0.05). Quadruple asterisks indicate significant difference compared to WT, by t-test (P < 0.0001). Strains: WT, yJM1887, yJM1237; tub1-R403H, yJM2218; tub1-R403H tub3∆, yJM2654; dyn1∆, 1023. (C) Quantification of dynein sliding events normalized to microtubule–cortical hits in diploid cells with varying levels of tub1-R403H mutant, displayed as percentage. At least 30 cells were analyzed for each strain. Data are represented as mean ± SEM. Strains: WT, yJM2711; tub1-R403H/TUB1, yJM2655, yJM2656; tub1-R403H/tub1-R403H, yJM2712. (DF) Model of α-tubulin R402C and R402H mechanism of action. (D) R402C/H mutants form appropriate tubulin heterodimers that incorporate into microtubules. (E) Disruption of dynein–microtubule interaction scales with abundance of R402C/H mutant in the microtubule. With less R402C/H mutant incorporation, dynein actively slides microtubules to orient the mitotic spindle in yeast cells and neurons can migrate in the developing cortex. With more R402C/H mutant incorporation, dynein cannot appropriately orient the mitotic spindle in yeast cells and neurons fail to migrate out of the ventricular zone.

References

    1. Bahi-Buisson N., Poirier K., Fourniol F., Saillour Y., Valence S., Lebrun N., Hully M., Bianco C.F., Boddaert N., Elie C. et al. (2014) The wide spectrum of tubulinopathies: what are the key features for the diagnosis. Brain, 137, 1676–1700. - PubMed
    1. Fallet-Bianco C., Laquerrière A., Poirier K., Razavi F., Guimiot F., Dias P., Loeuillet L., Lascelles K., Beldjord C., Carion N. et al. (2014) Mutations in tubulin genes are frequent causes of various foetal malformations of cortical development including microlissencephaly. Acta Neuropathol. Commun., 2, 69. - PMC - PubMed
    1. Gloster A., Wu W., Speelman A., Weiss S., Causing C., Pozniak C., Reynolds B., Chang E., Toma J.G. and Miller F.D. (1994) The T alpha 1 alpha-tubulin promoter specifies gene expression as a function of neuronal growth and regeneration in transgenic mice. J. Neurosci., 14, 7319–7330. - PMC - PubMed
    1. Coksaygan T., Magnus T., Cai J., Mughal M., Lepore A., Xue H., Fischer I. and Rao M.S. (2006) Neurogenesis in Talpha-1 tubulin transgenic mice during development and after injury. Exp. Neurol., 197, 475–485. - PubMed
    1. Lewis S.A., Lee M.G.S. and Cowan N.J. (1985) Five mouse tubulin isotypes and their regulated expression during development. J. Cell Biol., 101, 852–861. - PMC - PubMed

Publication types