. 2019 Mar 1;168(1):209-224.
doi: 10.1093/toxsci/kfy294.

The Isoniazid Metabolites Hydrazine and Pyridoxal Isonicotinoyl Hydrazone Modulate Heme Biosynthesis

Affiliations

The Isoniazid Metabolites Hydrazine and Pyridoxal Isonicotinoyl Hydrazone Modulate Heme Biosynthesis

Christopher Trent Brewer et al. Toxicol Sci. .

Abstract

In a mouse model, rifampicin and isoniazid combination treatment results in cholestatic liver injury that is associated with an increase in protoporphyrin IX, the penultimate heme precursor. Both ferrochelatase (FECH/Fech) and aminolevulinic acid synthase 1 (ALAS1/Alas1) are crucial enzymes in regulating heme biosynthesis. Isoniazid has recently been reported to upregulate Alas1 but downregulate Fech protein levels in mice; however, the mechanism by which isoniazid mediates disruption of heme synthesis has been unclear. Two metabolites of isoniazid, pyridoxal isonicotinoyl hydrazone (PIH, the isoniazid-vitamin B6 conjugate) and hydrazine, have been detected in the urine of humans treated with isoniazid. Here we show that, in primary human hepatocytes and the human hepatocellular carcinoma cell line HepG2/C3A, (1) isoniazid treatment increases Alas1 protein levels but decreases Fech levels; (2) hydrazine treatment upregulates Alas1 protein and Alas1 mRNA levels; (3) PIH treatment decreases Fech protein levels, but not Fech mRNA levels; and (4) PIH is detected after isoniazid treatment, with levels increasing further when exogenous vitamin B6 analogs are coadministered. In addition, the PIH-mediated downregulation of human FECH is associated with iron chelation. Together, these data demonstrate that hydrazine upregulates ALAS1, whereas PIH downregulates FECH, suggesting that the metabolites of isoniazid mediate its disruption of heme biosynthesis by contributing to protoporphyrin IX accumulation.

Keywords: aminolevulinic acid synthase 1; antitubercular therapy; ferrochelatase; protoporphyrin IX; vitamin B6.


Figures

Figure 1.
Figure 1.
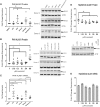
Isoniazid decreases human FECH protein levels, but not mRNA levels. Western blot analysis of FECH in primary human hepatocytes (PHHs) treated with 10 µM rifampicin (RIF), 10 µM SPA70, 200 µM isoniazid (INH), or a combination of these drugs (A) and a dose-response assay of isoniazid for 72 h (B). C, Quantitative Real-time Polymerase Chain Reaction (qRT-PCR) analysis of FECH expression in (A). Western blot analysis (D) and qRT-PCR analysis (E) of FECH expression in HepG2/C3A cells treated with isoniazid for 72 h. For PHHS, the results are presented as the mean fold change in expression±SEM. For HepG2/C3A cells, the results are presented as the mean fold change in expression for 3 biological repeats, each with 3 technical repeats. Two-way ANOVA followed by Tukey’s post hoc analysis was used to compare group means for qRT-PCR analysis. One-way ANOVA followed by Dunnett’s post hoc analysis was used to compare group means for Western blot analysis. **p < .01; *p < .05.
Figure 2.
Figure 2.
Isoniazid increases human aminolevulinic acid synthase (ALAS1) protein levels. Western blot analysis of ALAS1 in primary human hepatocytes (PHHs) treated with 10 µM rifampicin (RIF), 10 µM SPA70, 200 µM isoniazid (INH), or a combination of these drugs (A) and a dose-response assay of isoniazid for 72 h (B). (C) qRT-PCR analysis of ALAS1 expression in (A). Western blot analysis (D) and qRT-PCR analysis (E) of ALAS1 in HepG2/C3A cells treated with isoniazid for 72 h. For PHHs, the results are presented as the mean fold change in expression±SEM. For HepG2/C3A cells, the results are presented as the mean fold change in expression for 3 biological repeats. Two-way ANOVA followed by Tukey’s post hoc analysis was used to compare group means for qRT-PCR analysis. One-way ANOVA followed by Dunnett’s post hoc analysis was used to compare group means for Western blot analysis. ***p < .0001; **p < .01.
Figure 3.
Figure 3.
Iron levels affect FECH protein levels. Western blot analysis of FECH in HepG2/C3A cells treated for 24 h with deferoxamine mesylate in 10% fetal bovine serum (FBS)-containing medium (A), with FeCl3 in 1% FBS (B), and with FeCl3 in 10% FBS in the presence or absence of 4.7 µM deferoxamine (C). The results are presented as the mean fold change in expression±SEM for 3 biological repeats, each with 3 technical repeats. One-way ANOVA followed by Dunnett’s post hoc analysis was used to compare group means for Western blot analysis. ****p < .0001; **p < .01; *p < .05.
Figure 4.
Figure 4.
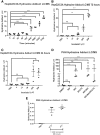
The effect of isoniazid metabolites on FECH and aminolevulinic acid synthase (ALAS1) levels. Western blot analysis of FECH (A) and ALAS1 (B) in HepG2/C3A cells treated for 16 h with the indicated compound at a concentration of 100 µM. Western blot analysis (C) and qRT-PCR analysis (D) of FECH in HepG2/C3A cells treated for 24 h with the indicated dose of pyridoxal isonicotinoyl hydrazone. Western blot analysis (E) and qRT-PCR analysis (F) of ALAS1 in HepG2/C3A cells treated for 24 h with the indicated dose of hydrazine. Western blot analysis (G) and qRT-PCR analysis (H) of ALAS1 in primary human hepatocytes (PHHs) treated for 24 h with the indicated dose of hydrazine. For qRT-PCR analysis and Western blot analysis of FECH, the results are presented as the mean fold change in expression±SEM for 3 biological repeats, each with 3 technical repeats. For Western blot analysis of ALAS1, the results are presented as the mean fold change in expression±SEM for 3 biological repeats. Two-way ANOVA followed by Tukey’s post hoc analysis was used to compare group means for qRT-PCR analysis. One-way ANOVA followed by Dunnett’s post hoc analysis was used to compare group means for Western blot analysis. ****p < .0001; ***p < .001; **p < .01; *p < .05. DEF, Deferoxamine mesylate; INA, isonicotinic acid; A-INH, acetyl-isoniazid; Ac-HZ, acetyl-hydrazine; DiacHZ, diacetylhydrazine; HZ, hydazine; PIH, pyridoxal isonicotinoyl hydrazone.
Figure 5.
Figure 5.
Detection of pyridoxal isonicotinoyl hydrazone (PIH) after isoniazid (INH) application. (A) Pyridoxal isonicotinoyl hydrazone is formed from isoniazid and pyridoxal. The LC/MS/MS analysis of pyridoxal isonicotinoyl hydrazone in the livers of mPxr−/−-C57BL/6 mouse with (hPXR) and without (Pxr-/-) hPXR-transgene, treated for 6 weeks with control chow, control water, chow containing 100 mg/kg rifampicin, and/or water containing 400 mg/l isoniazid (B); in primary human hepatocyte (PHH) cell culture medium treated for 72 h with DMSO, 10 µM rifampicin, 200 µM isoniazid, 10 µM SPA70, or a combination of these drugs (C); and in HepG2/C3A cell culture medium in a time-dependent (D) and a dose-dependent (E) manner after treatment with isoniazid or other compounds as indicated. The LC/MS/MS analysis of pyridoxal isonicotinoyl hydrazone in HepG2/C3A cell culture medium treated for 24 h with various concentrations of pyridoxal 5′-phosphate (F), pyridoxal HCl (G), or pyridoxine HCl (H). The LC/MS/MS analysis of pyridoxal isonicotinoyl hydrazone in phosphate-buffered saline treated with the indicated vitamin B6 analog (1 mM) at the indicated times and temperatures in the presence (I) or absence (J) of 1 mM isoniazid. Western blot analysis of FECH in HepG2/C3A cells treated for 24 h with pyridoxal 5′-phosphate (K) or pyridoxal HCl (L) in the presence or absence of 200 µM isoniazid. The results for PIH levels are presented as the mean fold change for 3 biological replicates±SEM for the in vitro data and as the mean (n = 4–5 per group)±SEM for the in vivo data. The results for Western blot analysis of FECH are presented as the mean fold change in expression±SEM for 3 biological repeats, each with 3 technical repeats. One-way ANOVA followed by Dunnett’s post hoc analysis was used to compare group means for Western blot analysis and LC/MS/MS analysis. ****p < .0001; ***p < .001; **p < .01; *p < .05.
Figure 6.
Figure 6.
Detection of hydrazine after isoniazid administration. The LC/MS analysis of hydrazine adduct in HepG2/C3A cell culture medium at various times after treatment with a single dose of 200 µM isoniazid (A) and at 72 h (B) and 24 h (C) after treatment with various single isoniazid doses after 3 daily isoniazid doses. D, LC/MS analysis of hydrazine adduct in primary human hepatocyte (PHH) cell culture medium at 72 h after 3 daily doses of 200 µM isoniazid. E, LC/MS analysis of phosphate-buffered saline (PBS) after a 96-h incubation with 1 mM isoniazid at the indicated temperature. Hydrazine-adduct levels in HepG2/C3A cells and PBS are presented as the mean±SEM for 3 biological replicates. Hydrazine-adduct levels in PHHs are presented as the mean±SEM for 3 biological and 3 technical replicates. Two-way ANOVA followed by Tukey’s post hoc analysis was used to compare group means for LC/MS analysis of PHHs. One-way ANOVA followed by Dunnett’s post hoc analysis was used to compare group means for LC/MS analysis of HepG2/C3A cells and PBS. ****p < .0001; ***p < .001, *p < .05.
Figure 7.
Figure 7.
Pyridoxal isonicotinoyl hydrazone decreases FECH levels by decreasing iron availability in EMEM containing 10% fetal bovine serum. Western blot analysis of HepG2/C3A cells (A) and primary human hepatocytes (PHHs) (B) treated with increasing doses of FeCl3 in the presence or absence of pyridoxal isonicotinoyl hydrazone (PIH) (in HepG2/C3A cells) and in the presence or absence of PIH and isoniazid (in PHHs). Spectrophotometric analysis of CAS shuttle assays of deferoxamine (C), PIH (D), biochemical reaction products of pyridoxal HCl and isoniazid (E), and HepG2/C3A cell culture medium (F) treated with pyridoxal in the presence or absence of isoniazid (100 µM). For Western blot analysis of FECH in HepG2/C3A cells, the results are presented as the mean fold change in expression±SEM for 3 biological repeats, each with 3 technical repeats. For Western blot analysis of FECH in PHHs from donors, the results are presented as the mean fold change in expression±SEM. The results of spectrophotometric analysis of the background-subtracted absorbance (630 nm) of the CAS shuttle solution are presented as the mean±SEM of 3 repeats for deferoxamine and PIH dilutions and biochemical reaction products and as the mean±SEM for 3 biological repeats, each with 3 technical repeats, for the HepG2/C3A cell culture medium. One-way ANOVA followed by Dunnett’s post hoc analysis was used to compare group means for Western blot analysis and spectrophotometric analysis. ****p < .0001; ***p < .001; **p < .01; *p < .05.
Figure 8.
Figure 8.
The proposed mechanism of regulation of heme biosynthesis. Vitamin B6 analogs form pyridoxal isonicotinoyl hydrazone (PIH) in the presence of isoniazid. Pyridoxal isonicotinoyl hydrazone chelates iron and prevents the stabilization of FECH. Isoniazid breaks down to hydrazine, and hydrazine upregulates aminolevulinic acid synthase at the transcription level. Both effects may be expected to increase the levels of liver protoporphyrin IX and lead to cholestatic liver injury. ALA, aminolevulinic acid.

References

    1. Aarnoutse R. E., Kibiki G. S., Reither K., Semvua H. H., Haraka F., Mtabho C. M., Mpagama S. G., van den Boogaard J., Sumari-de Boer I. M., Magis-Escurra C. (2017). Pharmacokinetics, tolerability, and bacteriological response of rifampin administered at 600, 900, and 1,200 milligrams daily in patients with pulmonary tuberculosis. Antimicrob. Agents Chemother. 61, e01054–e01017. - PMC - PubMed
    1. Aït Moussa L., El Bouazzi O., Serragui S., Soussi Tanani D., Soulaymani A., Soulaymani R. (2016). Rifampicin and isoniazid plasma concentrations in relation to adverse reactions in tuberculosis patients: A retrospective analysis. Ther. Adv. Drug Saf. 7, 239–247. - PMC - PubMed
    1. Aita J. F., Calame T. R. (1972). Peripheral neuropathy secondary to isoniazid-induced pyridoxine deficiency. Md. State Med. J. 21, 68–70. - PubMed
    1. Bhadauria S., Mishra R., Kanchan R., Tripathi C., Srivastava A., Tiwari A., Sharma S. (2010). Isoniazid-induced apoptosis in HepG2 cells: Generation of oxidative stress and Bcl-2 down-regulation. Toxicol. Mech. Methods 20, 242–251. - PubMed
    1. Blair I. A., Mansilla Tinoco R., Brodie M. J., Clare R. A., Dollery C. T., Timbrell J. A., Beever I. A. (1985). Plasma hydrazine concentrations in man after isoniazid and hydralazine administration. Hum. Toxicol. 4, 195–202. - PubMed

Publication types

MeSH terms