. 2018 Dec 4;25(10):2755-2765.e5.
doi: 10.1016/j.celrep.2018.11.045.

HDAC3 Regulates the Transition to the Homeostatic Myelinating Schwann Cell State

Affiliations

HDAC3 Regulates the Transition to the Homeostatic Myelinating Schwann Cell State

Laura H Rosenberg et al. Cell Rep. .

Abstract

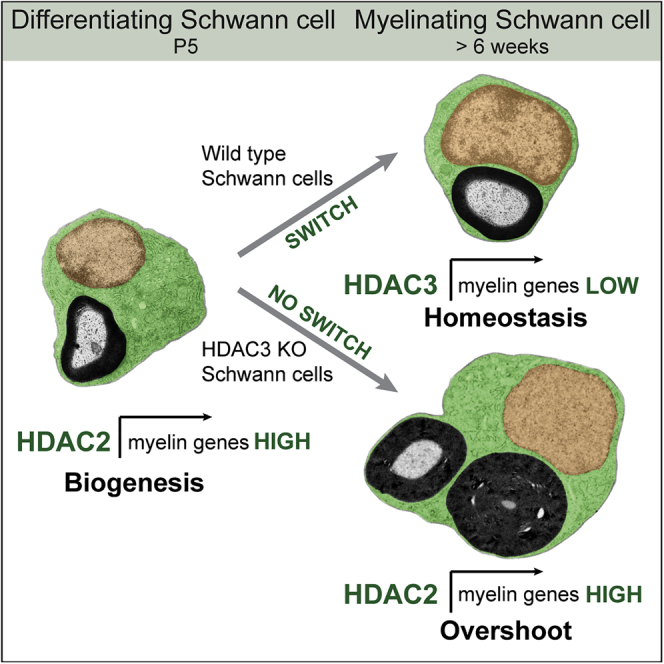
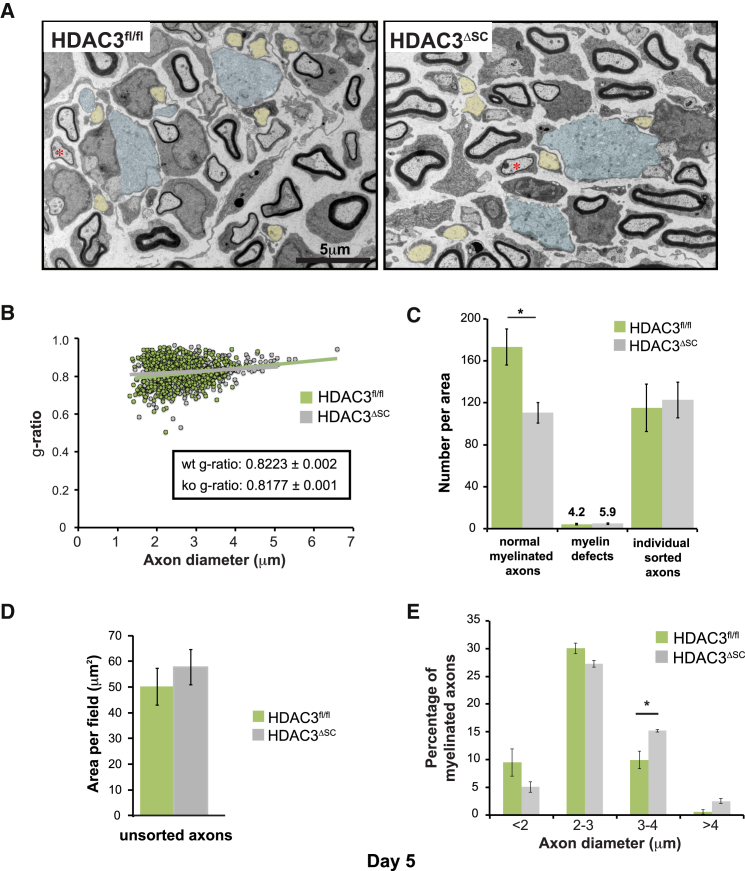
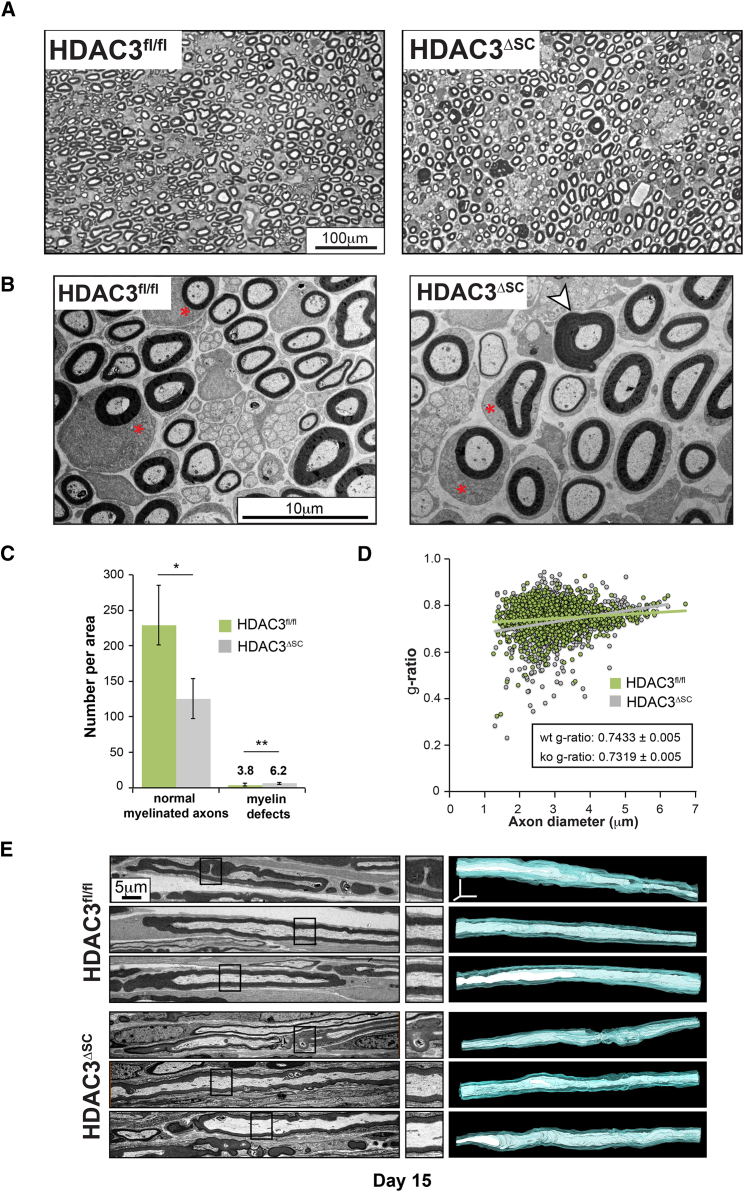
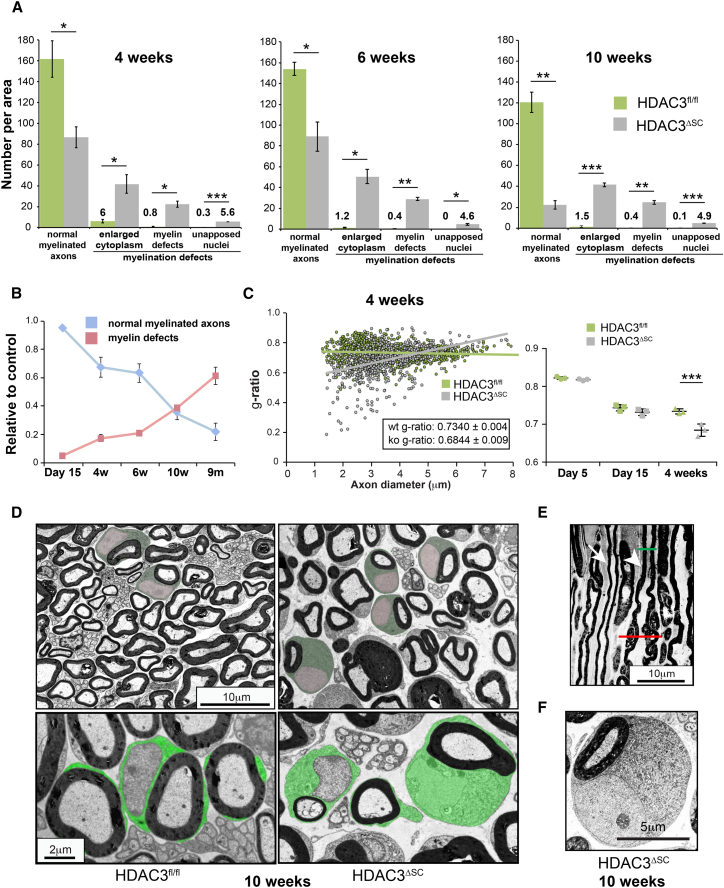
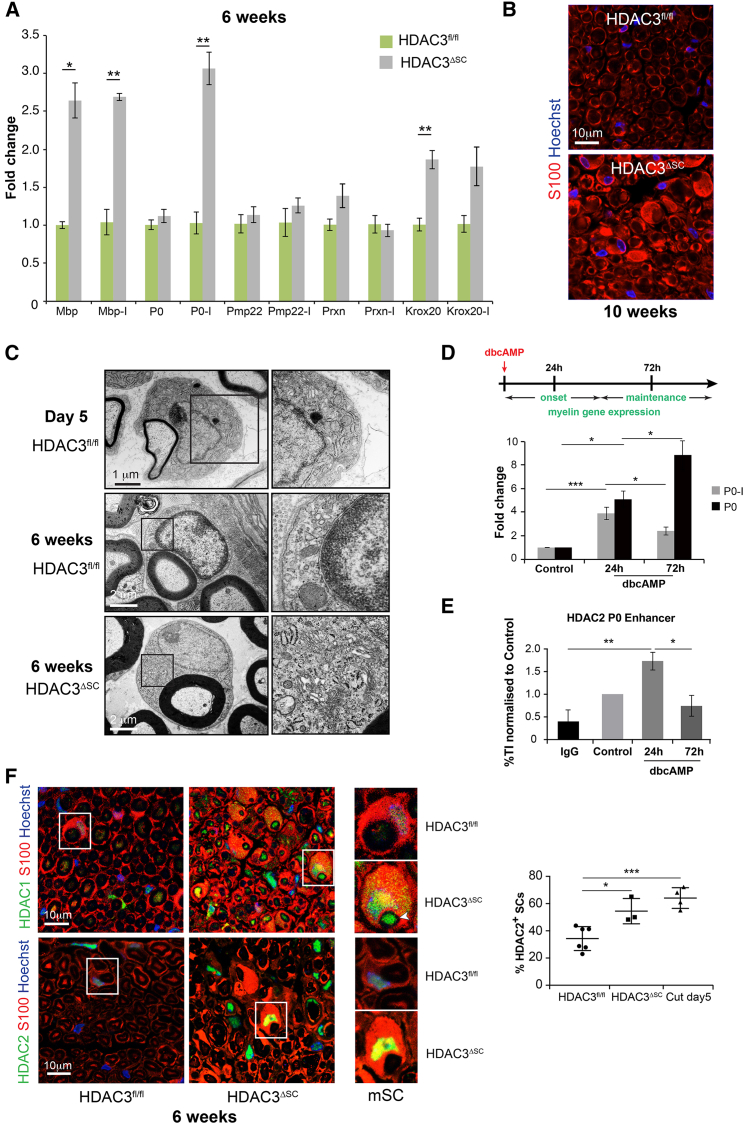
The formation of myelinating Schwann cells (mSCs) involves the remarkable biogenic process, which rapidly generates the myelin sheath. Once formed, the mSC transitions to a stable homeostatic state, with loss of this stability associated with neuropathies. The histone deacetylases histone deacetylase 1 (HDAC1) and HDAC2 are required for the myelination transcriptional program. Here, we show a distinct role for HDAC3, in that, while dispensable for the formation of mSCs, it is essential for the stability of the myelin sheath once formed-with loss resulting in progressive severe neuropathy in adulthood. This is associated with the prior failure to downregulate the biogenic program upon entering the homeostatic state leading to hypertrophy and hypermyelination of the mSCs, progressing to the development of severe myelination defects. Our results highlight distinct roles of HDAC1/2 and HDAC3 in controlling the differentiation and homeostatic states of a cell with broad implications for the understanding of this important cell-state transition.

Keywords: HDACs; Schwann cells; biogenesis; homeostasis; neuropathy; peripheral nerve.


Figures

None
Graphical abstract
Figure 1
Figure 1
HDAC3 Regulates Myelin Gene Transcription and Is Expressed in Adult Myelinating Schwann Cells (A) Relative luciferase activity of the regulatory elements of the P0 gene (promoter plus enhancer; see STAR Methods for further details) in the absence (control) or presence (dbcAMP) of dbcAMP for 24 hr following the transfection of scrambled (Scr) or two independent siRNAs (siRNA1 and siRNA2) (n = 3, mean ± SEM). (B) ChIP analysis to detect HDAC3 binding to the P0 promoter. SCs expressing a tamoxifen (TMX)-inducible Raf kinase construct (NSΔRafER cells) were cultured in the absence of presence of dbcAMP for 72 hr and then for a further 24 hr in the absence or presence (−/+) of TMX to induce the dedifferentiation of the cells (n = 3, mean ± SEM). (C) Relative endogeneous P0 mRNA levels following transfection of scrambled (Scr) or two independent siRNAs (siRNA1 and siRNA2) in the absence (control) or presence (dbcAMP) of dbcAMP (n = 3, mean ± SEM). (D) Representative confocal images of mouse sciatic nerve of postnatal P5, 6-week-old animals, and 6-week-old animals, 5 days following transection stained for HDAC3 or HDAC2 (green) as indicated with SCs labeled for S100 (red). Note that whereas HDAC2 expression in adulthood is at low levels in myelinating Schwann cells (mSCs) (arrowheads), it is re-induced upon injury (arrowheads). Conversely, nuclear HDAC3 expression is maintained in adult mSCs (arrowheads), whereas it decreases upon injury in myelinating-derived SCs (arrowheads). Other cell types express high levels of HDAC3 after injury (arrows). p < 0.05, ∗∗p < 0.01, ∗∗∗p < 0.001. See also Figure S1.
Figure 2
Figure 2
Loss of HDAC3 in Schwann Cells Results in Progressive Adult Neuropathy (A) Immunofluorescence of representative transverse sciatic nerve sections from control (HDAC3fl/fl) mice at postnatal day 15 or mutant mice (HDAC3ΔSC) showing efficient loss of nuclear HDAC3 staining (green) in S100-labeled SCs (red). Nuclei were counterstained with Hoechst (blue). Arrows point to mSCs and arrowheads to other cell types that also express HDAC3. (B) Images of 6-month-old HDAC3fl/fl and HDAC3ΔSC animals showing hind limb clasping and muscle wastage. (C) Rotarod behavioral tests showing average latency to fall of control HDAC3fl/fl and mutant HDAC3ΔSC animals from 1 to 9 months after birth (n = 4–19 mean ± SEM). ∗∗p < 0.01, ∗∗∗p < 0.001. See also Figure S2 and Video S1.
Figure 3
Figure 3
HDAC3 Loss in Schwann Cells Results in Gross Myelinating Abnormalities (A) Representative EM images of transverse ultrathin sections of sciatic nerves from 9-month-old HDAC3fl/fl and HDAC3ΔSC animals, when the mutant animals exhibit profound neuropathies. The two images from the mutant animals represent areas of less severe and severe myelination defects. (B) Quantification of myelination defects in 9-month-old animals (n = 3 mean ± SEM). (C) Selected images of myelination abnormalities including myelin outfoldings (top left), focal hypermyelination (top right), the myelination of two axons by a single SC (bottom left), and redundant loop formation (bottom right). p < 0.05, ∗∗∗p < 0.001. See also Figure S3.
Figure 4
Figure 4
Myelination Initiates Normally in Schwann Cells Lacking HDAC3 (A) Representative colored EM images of sciatic nerve sections from postnatal day 5 animals. Unsorted axons are shown in blue, single sorted axons prior to myelination are shown in yellow, and sorted axons that have just initiated myelination are indicated with a red asterisk. (B) Graph shows the g-ratio as a function of axon diameter of sciatic nerves from HDAC3fl/fl and HDAC3ΔSC postnatal day 5 mice (n = 3 > 600 axons/genotype). (C–E) Graphs show (C) quantification of the myelination process as indicated, (D) the overall area of unsorted axons, and (E) the axon diameters of mSCs in the sciatic nerves of postnatal day 5 HDAC3fl/fl and HDAC3ΔSC mice (n = 3 mean ± SEM). p < 0.05. See also Figure S4.
Figure 5
Figure 5
Myelination Defects Become Apparent in Schwann Cells Lacking HDAC3 as Myelination Reaches Completion (A and B) Representative low- (A) and high- (B) magnification EM images of sciatic nerve sections from postnatal day 15 control (HDAC3fl/fl) and mutant (HDAC3ΔSC) mice. Note, while mostly normal, a low percentage of axons show hyper-myelination (white arrowhead). In addition, both control and mutant animals show mSCs with an enlarged cytoplasm (red ) indicating that myelination is not complete. (C) Quantification of normal myelination and the number of axons with myelination defects in HDAC3fl/fl and HDAC3ΔSC mice (n = 3 mean ± SEM). (D) Graph shows the g-ratio as a function of axon diameter of the sciatic nerves from postnatal day 15 HDAC3fl/fl and HDAC3ΔSC mice (n = 3 > 600 axons/genotype). (E) Representative EM images of longitudinal ultrathin sections (left panel), higher magnification (middle panel), and 3D reconstructions displaying axons (white) and their myelin sheath (blue) (right panel) of sciatic nerves from postnatal day 15 control (HDAC3fl/fl) and mutant (HDAC3ΔSC) mice showing, in both cases, one mSC with myelin outfoldings (top) and 2 normal mSCs (bottom). p < 0.05, ∗∗p < 0.01. See also Video S2.
Figure 6
Figure 6
Schwann Cells Lacking HDAC3 Fail to Enter the Homeostatic State (A) Quantification of myelination defects in the sciatic nerves of HDAC3fl/fl and HDAC3ΔSC mice at the indicated times (n = 3 mean ± SEM). Note that the graphs in the top panel show that the density of normal mSCs in control animals decreases as the animal ages due to an increase in the overall size of the nerve with age. (B) Graph shows the accumulation of myelin defects with age observable by normalizing to control levels (n = 3 mean ± SEM). (C) Graphs show the g-ratio as a function of axon diameter of sciatic nerves from HDAC3fl/fl and HDAC3ΔSC 4-week-old mice (n = 3 > 600 axons/genotype) (left panel) and the average g-ratio of postnatal day 5, day 15, and 4-week-old HDAC3fl/fl and HDAC3ΔSC mice (n = 3 mean ± SEM). (D) Representative colored EM images of control (HDAC3fl/fl) and mutant (HDAC3ΔSC) mice. The cytoplasm is colored green with nuclei colored pink. Note the nuclei remain unapposed to the axon in the mutant mice. (E) Representative EM image of a longitudinal ultrathin sections of a sciatic nerve from 10-week-old mutant HDAC3ΔSC animals showing one normal (arrow) and one abnormal (arrowhead) mSC displaying regions where the myelin sheath looks normal (green line) and some with outfoldings of myelin (red line). (F) High-magnification EM image showing the enlarged cytoplasm and unapposed nuclei in the adult mutant mouse (10-week-old mouse). p < 0.05, ∗∗p < 0.01, ∗∗∗p < 0.001. See also Figure S5.
Figure 7
Figure 7
mSCs Lacking HDAC3 Remain in the Biogenic State (A) RT-qPCR analysis of key myelin genes and the Krox-20 transcription factor at 6 weeks of age. Primers that detect total mRNA or specific primer pairs (-I) that detect only nascent pre-mRNA were used. Prxn, periaxin (n = 4, mean ± SEM). (B) S100 staining to detect the cytoplasm of SCs shows the enlarged cytoplasm of the mSCs lacking HDAC3. Nuclei are labeled with Hoechst (blue). (C) Representative EM images showing that the enlarged cytoplasm of mSCs lacking HDAC3 (HDAC3ΔSC) is packed with organelles such as rough endoplasmic reticulum (RER) and mitochondria as seen in normal mSCS during their most biogenic phase (day 5). (D) RT-qPCR analysis of P0 mRNA (P0) and pre-mRNA (P0-I) of SCs differentiated by the addition of 1mM dbcAMP for the indicated times (n = 4 mean ± SEM). (E) Graph shows ChIP analysis to detect HDAC2 bound to the P0 enhancer in SCs differentiated by the addition of 1 mM dbcAMP for the indicated times (n = 4 mean ± SEM). (F) Representative immunofluorescence images showing the expression of HDAC1 and HDAC2 in transverse sections of sciatic nerves of 6-week-old control (HDAC3fl/fl) and mutant (HDAC3ΔSC) mice. Graph shows the average percentage of HDAC2+ mSCs in sciatic nerves from control (HDAC3fl/fl) and mutant (HDAC3ΔSC) mice and in injured sciatic nerves (mean ± SEM). Each dot represents an individual animal. p < 0.05, ∗∗p < 0.01, ∗∗∗p < 0.001. See also Figure S6.

References

    1. Adlkofer K., Frei R., Neuberg D.H., Zielasek J., Toyka K.V., Suter U. Heterozygous peripheral myelin protein 22-deficient mice are affected by a progressive demyelinating tomaculous neuropathy. J. Neurosci. 1997;17:4662–4671. - PMC - PubMed
    1. Bolis A., Coviello S., Bussini S., Dina G., Pardini C., Previtali S.C., Malaguti M., Morana P., Del Carro U., Feltri M.L. Loss of Mtmr2 phosphatase in Schwann cells but not in motor neurons causes Charcot-Marie-Tooth type 4B1 neuropathy with myelin outfoldings. J. Neurosci. 2005;25:8567–8577. - PMC - PubMed
    1. Brügger V., Engler S., Pereira J.A., Ruff S., Horn M., Welzl H., Münger E., Vaquié A., Sidiropoulos P.N., Egger B. HDAC1/2-dependent P0 expression maintains paranodal and nodal integrity independently of myelin stability through interactions with neurofascins. PLoS Biol. 2015;13:e1002258. - PMC - PubMed
    1. Brügger V., Duman M., Bochud M., Münger E., Heller M., Ruff S., Jacob C. Delaying histone deacetylase response to injury accelerates conversion into repair Schwann cells and nerve regeneration. Nat. Commun. 2017;8:14272. - PMC - PubMed
    1. Camargo N., Smit A.B., Verheijen M.H.G. SREBPs: SREBP function in glia-neuron interactions. FEBS J. 2009;276:628–636. - PubMed

Publication types

LinkOut - more resources