. 2018 Dec 4;25(10):2784-2796.e3.
doi: 10.1016/j.celrep.2018.11.030.

ISRE-Reporter Mouse Reveals High Basal and Induced Type I IFN Responses in Inflammatory Monocytes

Affiliations

ISRE-Reporter Mouse Reveals High Basal and Induced Type I IFN Responses in Inflammatory Monocytes

Melissa B Uccellini et al. Cell Rep. .

Abstract

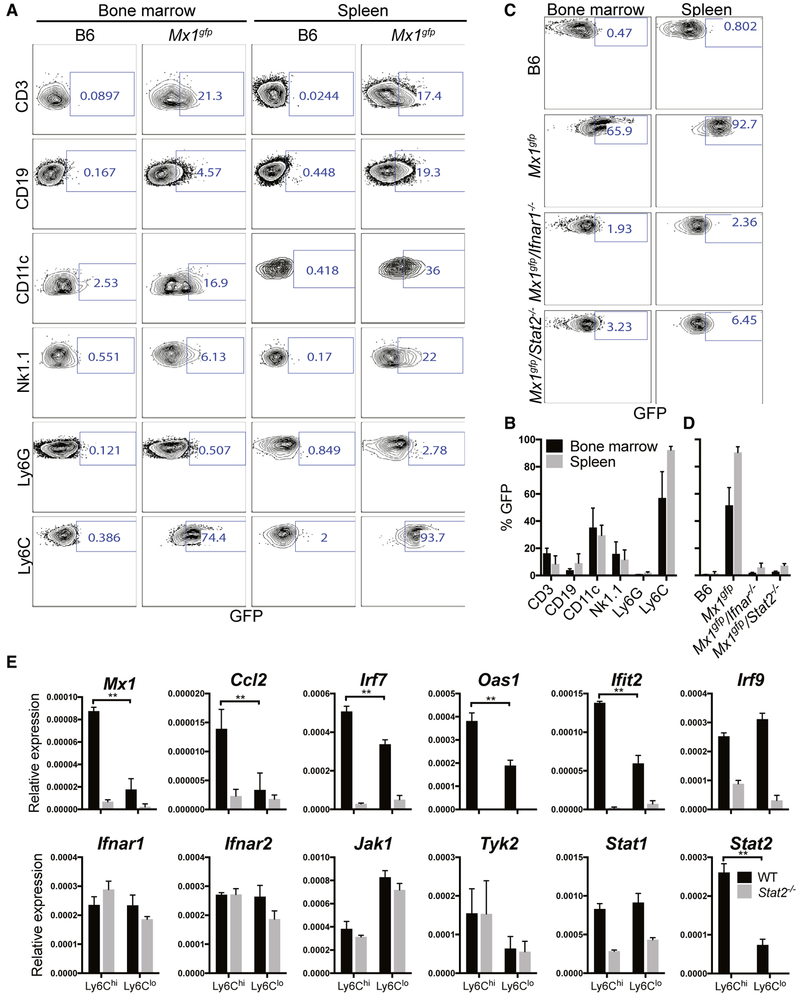
Type I and type III interferons (IFNs) are critical for controlling viral infections. However, the precise dynamics of the IFN response have been difficult to define in vivo. Signaling through type I IFN receptors leads to interferon-stimulated response element (ISRE)-dependent gene expression and an antiviral state. As an alternative to tracking IFN, we used an ISRE-dependent reporter mouse to define the cell types, localization, and kinetics of IFN responding cells during influenza virus infection. We find that measurable IFN responses are largely limited to hematopoietic cells, which show a high sensitivity to IFN. Inflammatory monocytes display high basal IFN responses, which are enhanced upon infection and correlate with infection of these cells. We find that inflammatory monocyte development is independent of IFN signaling; however, IFN is critical for chemokine production and recruitment following infection. The data reveal a role for inflammatory monocytes in both basal IFN responses and responses to infection.

Keywords: influenza; innate immunity; interferon; monocytes.


Figures

Figure 1.
Figure 1.. The Mx1gfp Allele Functions As a Reporter for Type I and Type III IFN Responses
(A and B) Mx1gfp, Mx1gfp/Ifnar1−/−, and Mx1gfp/Stat2−/− mice were i.v. injected with 100 μg of PIC, and GFP expression in the spleen was measured at 24 hr. (C and D) Mx1gfp, Mx1gfp/Ifnar1−/−, and Mx1gfp/ Stat2−/− mice were i.n. injected with 50 μg of PIC, and GFP expression was measured at 24 hr. Arrow indicates IFNAR1-independent reporter expression in epithelial cells. (A) and (C) show mean ± SD for n = 3 animals. (B) and (D) show representative FACs plots. See also Figure S1.
Figure 2.
Figure 2.. Basal IFN Responses Are Present at High Levels in Ly6Chi Monocytes
(A and B) Bone marrow and spleen cells from untreated B6 or Mx1gfp mice were stained for T cells (CD3+), B cells (CD19+), DCs (CD11c+), NK cells (NK1.1+), neutrophils (Ly6C+Ly6G+CD11b+), or monocytes (Ly6C+Ly6GCD11b+), and GFP expression was examined. (C and D) Bone marrow or spleen was harvested from the indicated untreated mice, and GFP expression on Ly6ChiLy6GCD11b+ monocytes was analyzed. (E) qPCR on sorted spleen Ly6ChiLy6GCD11b+ and Ly6CloLy6GCD11b+ monocytes from untreated Mx1gfp and Mx1gfp/Stat2−/− mice. (B) shows mean ± SD for n = 4 animals. (D) shows mean ± SD for n = 3 animals. (E) shows mean ± SD for n = 3 animals. **indicates significance of p< 0.01 using unpaired t test. (A) and (C) show representative FACs plots. See also Figure S2.
Figure 3.
Figure 3.. Exposure to PIC Induces a Systemic IFN Response
(A–C) Mx1gfp mice were i.v. injected with 100 μg of PIC, and GFP expression in the spleen was measured at days 0–5 post-treatment (A and B) or 2, 4, or 6 hr post-treatment (C). (D and E) Mx1gfp mice were i.v. injected with 100 μg of PIC, and GFP expression was measured in T cells (CD3+), B cells (CD19+), DCs (CD11c+), NK cells (NK1.1+), neutrophils (Ly6C+Ly6G+CD11b+), and monocytes (Ly6C+Ly6GCD11b+) in the spleen at 24 hr. Inset histogram shows basal and induced GFP expression in Ly6Chi monocytes. (F and G) Mx1gfp mice were i.v. or i.n. injected with 50 μg of PIC, and GFP expression in organs was measured at 24 hr. (B), (C), (E), and (G) show mean ± SD for n = 2–3 animals. (A), (D), and (F) show representative FACs plots. See also Figure S3.
Figure 4.
Figure 4.. The IFN Response to Influenza Virus Is Confined to the Lung and Draining Lymph Node
(A and B) Mx1gfp mice were infected with 102 pfu of PR8 (A) or HALo (B), and GFP expression in organs was examined at days 0–10 post-infection. (C) Mx1gfp mice were infected with 102 pfu of Cal09, and GFP expression in the lungs was examined. (D) Mx1gfp mice were infected with increasing doses of PR8, and GFP expression was measured in the lung. (E) Mx1gfp mice were infected with PR8 or the PR8-NS1 RNA-binding mutant virus (R38A/K41A), and GFP expression was measured in the lung. The bar represents the mean for n = 2 animals for all panels. Data from (A) are shown shaded in (B) and (C) for comparison.
Figure 5.
Figure 5.. The IFN Response to Influenza Virus Is Largely Restricted to Hematopoietic Cells in the Lung
(A and B) Mx1gfp mice were stained for hematopoietic cells (CD45+), epithelial cells (EpCAM+CD45−), or endothelial cells (CD31+) in the lung at day 7 post-infection with 102 pfu of PR8 or at day 1 post-treatment with 50 μg of i.n. PIC. (C and D) Mx1gfp mice were infected with 106 pfu of PR8 or PR8-NS1 R38A/K41A or treated i.n. with the indicated amount of PIC, and GFP expression was measured in hematopoietic and epithelial cells at day 1. (E and F) Macrophages and MEFs were stimulated with universal type I IFN or infected with PR8 or PR8ΔNS1 at different MOIs, and GFP was measured (E) or viral gene expression was determined (F) at 24 hr post-infection. (B) and (D) show the mean ± SD for n = 3 animals. (A), (C), and (E) show representative FACs plots. See also Figure S4.
Figure 6.
Figure 6.. GFPhi Cells during Influenza Virus Infection Are Infected Ly6Chi Monocytes
(A and B) Mx1gfp mice were infected with 102 pfu of PR8, and GFP expression was measured in T cells (CD3+), B cells (B220+), NK cells (NK1.1 +), alveolar macrophages (CD11c+SiglecF+), CD11b DCs (CD11chiMHCIIhiCD11b+CD103), CD103 DCs (CD11chiMHCIIhiCD103+CD11b), neutrophils (Ly6C+Ly6G+CD11b+), and Ly6Chi monocytes (Ly6ChiLy6GCD11b+) at day 7 post-infection. (C and D) Mx1gfp mice were infected with 104 pfu of PR8 and stained for surface M2 protein in T cells, B cells, Ly6Chi monocytes, or epithelial cells at day 3. (B) shows the mean ± SD for n = 4–6 animals. (D) shows the mean ± SD for 3 animals. (A) and (C) show representative FACs plots. See also Figure S5.
Figure 7.
Figure 7.. Ly6Chi Monocyte Recruitment, but Not Development, Is Dependent on IFN Signaling
(A) Mx1gfp and Mx1gfp/Stat2−/− mice were mock infected or infected with 102 pfu of HALo, and Ly6hl (Ly6ChiCD11b+Ly6G) and Ly6Clo (Ly6CloCD11b+ Ly6G) monocytes in the lung were measured by flow cytometry at day 2 post-infection. (B) Mice were infected as in (A), and Ly6Chi monocyte and neutrophil (Ly6CloLy6G+CD11b+) influx was measured by flow cytometry at day 2 post-infection. (C) Mice were infected as in (A), and viral titer in the lung was determined by plaque assay at day 3 post-infection. Titers were below the limit of detection at day 2. (D) Gene expression in the lung of animals from (B) was determined by qPCR at day 2 post-infection. (B) and (D) show mean ± SD for n = 3 animals. (C) shows mean ± SD for n = 5 animals. (A) shows a representative FACs plot. **indicates significance of p < 0.01 using unpaired t test.

References

    1. Asano A, Jin HK, and Watanabe T (2003). Mouse Mx2 gene: organization, mRNA expression and the role of the interferon-response promoter in its regulation. Gene 306, 105–113. - PubMed
    1. Barbalat R, Lau L, Locksley RM, and Barton GM (2009). Toll-like receptor 2 on inflammatory monocytes induces type I interferon in response to viral but not bacterial ligands. Nat. Immunol. 10, 1200–1207. - PMC - PubMed
    1. Bauer JW, Baechler EC, Petri M, Batliwalla FM, Crawford D, Ortmann WA, Espe KJ, Li W, Patel DD, Gregersen PK, and Behrens TW (2006). Elevated serum levels of interferon-regulated chemokines are biomarkers for active human systemic lupus erythematosus. PLoS Med. 3, e491. - PMC - PubMed
    1. Bourmakina SV, and García-Sastre A (2005). The morphology and composition of influenza A virus particles are not affected by low levels of M1 and M2 proteins in infected cells. J. Virol. 79, 7926–7932. - PMC - PubMed
    1. Ciancanelli MJ, Abel L, Zhang SY, and Casanova JL (2016). Host genetics of severe influenza: from mouse Mx1 to human IRF7. Curr. Opin. Immunol. 38, 109–120. - PMC - PubMed

Publication types