. 2018 Dec 4;25(10):2808-2820.e4.
doi: 10.1016/j.celrep.2018.11.035.

Polycomb- and Methylation-Independent Roles of EZH2 as a Transcription Activator

Affiliations

Polycomb- and Methylation-Independent Roles of EZH2 as a Transcription Activator

Jung Kim et al. Cell Rep. .

Abstract

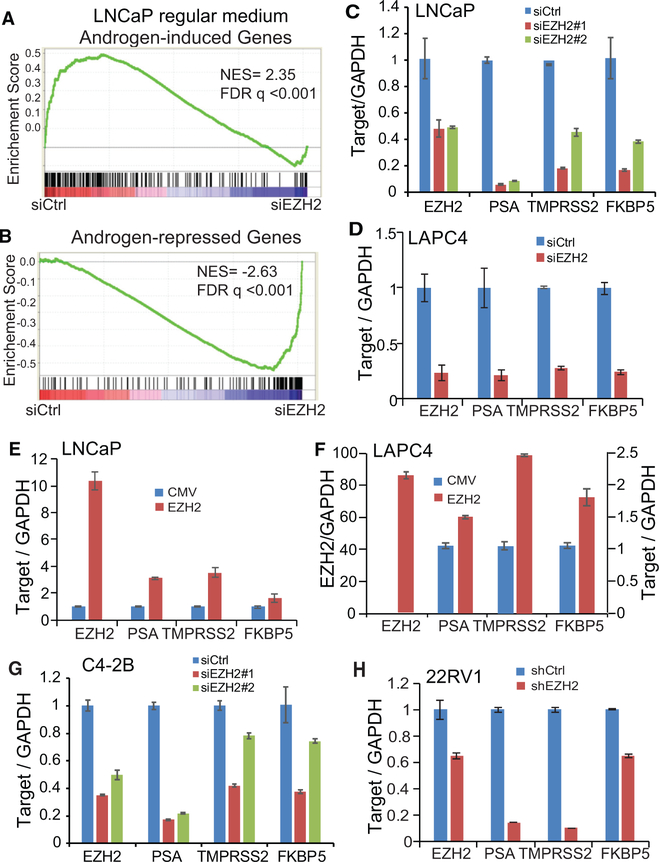
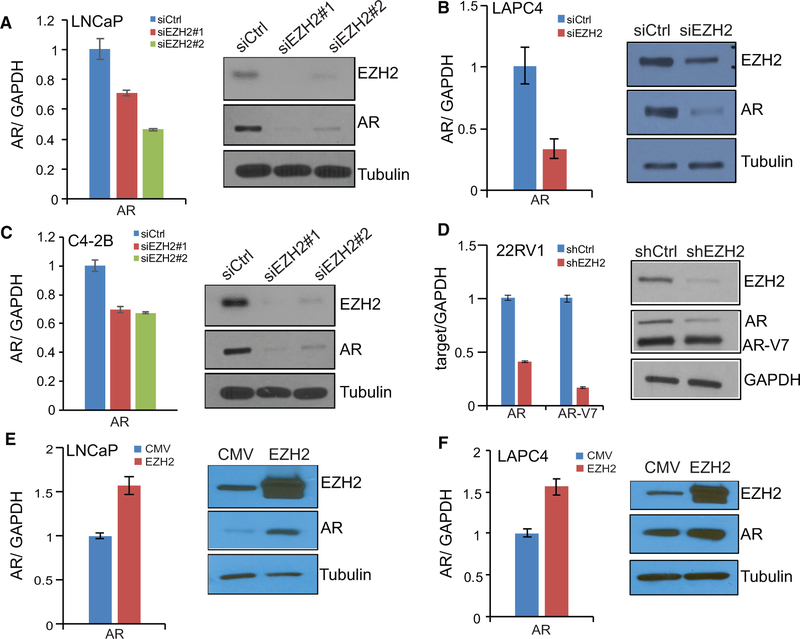
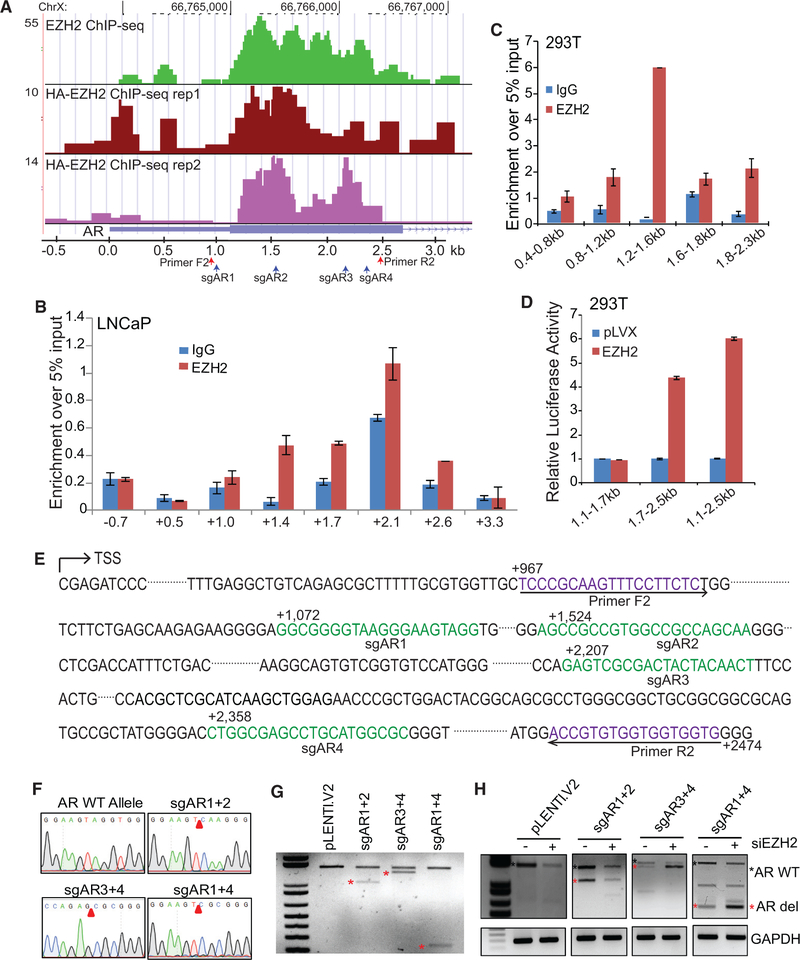
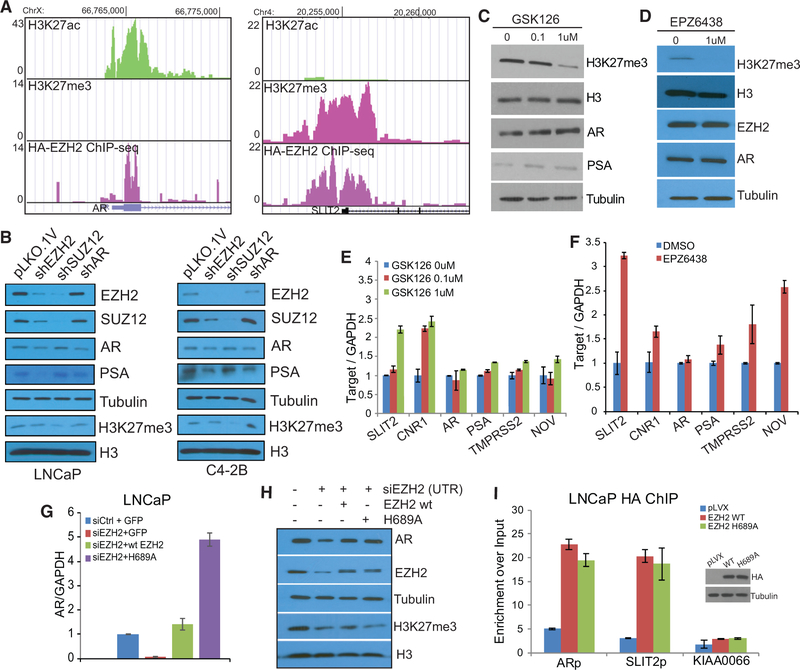
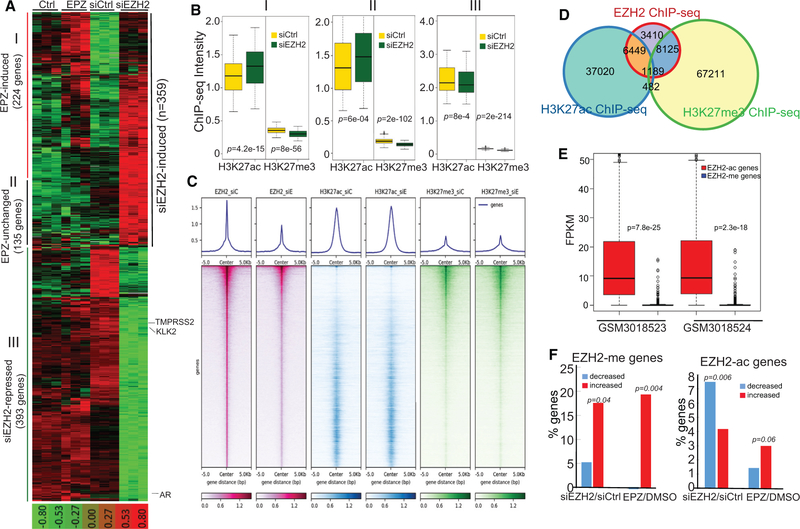
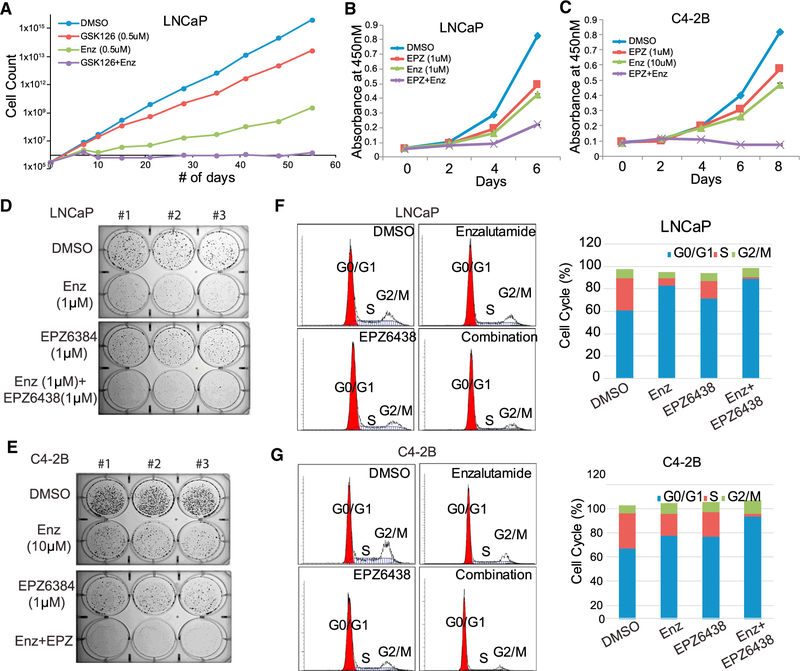
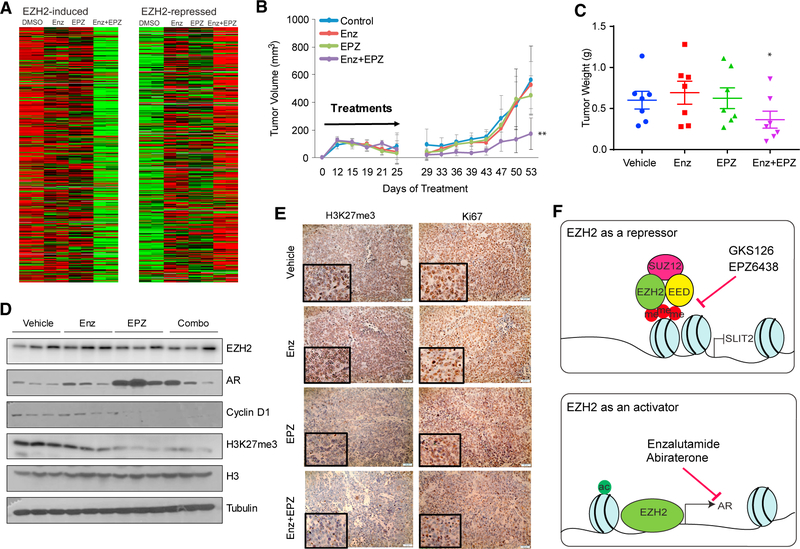
Enhancer of Zeste 2 (EZH2) is the enzymatic subunit of Polycomb Repressive Complex 2 (PRC2), which catalyzes histone H3 lysine 27 trimethylation (H3K27me3) at target promoters for gene silencing. Here, we report that EZH2 activates androgen receptor (AR) gene transcription through direct occupancy at its promoter. Importantly, this activating role of EZH2 is independent of PRC2 and its methyltransferase activities. Genome-wide assays revealed extensive EZH2 occupancy at promoters marked by either H3K27ac or H3K27me3, leading to gene activation or repression, respectively. Last, we demonstrate enhanced efficacy of enzymatic EZH2 inhibitors when used in combination with AR antagonists in blocking the dual roles of EZH2 and suppressing prostate cancer progression in vitro and in vivo. Taken together, our study reports EZH2 as a transcriptional activator, a key target of which is AR, and suggests a drug-combinatory approach to treat advanced prostate cancer.

Keywords: AR antagonist enzalutamide; ChIP-seq; EPZ-6438; GSK126; androgen receptor inhibitor; enzymatic EZH2 inhibitor; epigenetic silencing; transcription activator.


Conflict of interest statement

DECLARATION OF INTERESTS

The authors declare no competing interests.

Figures

Figure 1.
Figure 1.. EZH2 Enhances Androgen Signaling in Both ADPC and CRPC Cells
(A and B) Androgen-induced genes (A) are enriched for downregulation upon EZH2 knockdown (false discovery rate [FDR] q < 0.001), whereas androgen-repressed genes (B) are enriched for upregulation upon EZH2 knockdown (FDR q < 0.001). GSEA was utilized to examine the expression of androgen (R1881)-induced and -repressed gene sets, obtained from a previous study (Zhao et al., 2012), in LNCaP cells treated with control (siCtrl) and EZH2 knockdown (siEZH2), as profiled by microarrays. (C and D) EZH2 knockdown inhibits AR-induced genes. LNCaP cells (C) were transfected with siCtrl or two different siEZH2s, and LAPC4 (D) cells were transfected with siCtrl or a representative siEZH2. Cells were then analyzed by qRT-PCR. Data were normalized to GAPDH. Data shown are mean (±SEM) of technical replicates from one representative experiment of three. (E and F) EZH2 overexpression increases AR-induced genes. LNCaP (E) and LAPC4 (F) cells were infected with cytomegalovirus (CMV) control or an EZH2-expressing adenovirus and analyzed by qRTPCR. Data were normalized to GAPDH. Data shown are mean (±SEM) of technical replicates from one representative experiment of three. (G and H) EZH2 knockdown reduces AR-induced genes in CRPC cells. (G) 22Rv1 and (H) C4–2B cells were infected with control shRNA or shEZH2 or transfected with either siCtrl or two different siEZH2s and then subjected to qRT-PCR analysis. Data were normalized to GAPDH. Data shown are mean (±SEM) of technical replicates from one representative experiment of three.
Figure 2.
Figure 2.. EZH2 Increases AR mRNA and Protein Levels
(A–D) EZH2 knockdown decreases AR mRNA and protein levels. LNCaP (A), LAPC4 (B), C4–2B (C), and 22RV1 (D) cells were transfected with control or siEZH2s or infected with control shRNA or shEZH2, followed by qRT-PCR (left) and western blot analysis (right). Data shown are mean (±SEM) of technical replicates from one representative experiment of three. (E and F) EZH2 overexpression increases AR mRNA and protein levels. LNCaP (E) and LAPC4 (F) cells were infected with CMV or an EZH2-expressing adenovirus for 48 hr, followed by qRT-PCR (left) and western blot analysis (right). Data shown are mean (±SEM) of technical replicates from one representative experiment of three.
Figure 3.
Figure 3.. EZH2 Directly Activates AR Gene Transcription
(A) EZH2 protein occupies the AR gene promoter. EZH2 ChIP-seq was performed in LNCaP cells with an antibody targeting endogenous EZH2 (top). HA ChIP-seq was performed using an anti-HA antibody in LNCaP cells with ectopic HA-EZH2 overexpression. Two biological replicates are shown (center and bottom). (B) ChIP-qPCR showing EZH2 binding along the AR gene promoter. ChIP was performed in LNCaP cells using anti-EZH2 and IgG antibodies and then subjected to qPCR using primer pairs targeting ~60-bp sliding windows within −1 kb to +3 kb of the AR gene. The x axis indicates the central location of the PCR products relative to the AR TSS. Data shown are mean (±SEM) of technical replicates from one representative experiment of three. (C) Different regions (of 400 bp) of the AR promoter (from 0 to +3 kb) were cloned into the pRetroX-Tight-Pur-Luc vector and transfected into 293T cells, which were then subjected to ChIP by anti-EZH2 or IgG. EZH2 occupancy at the ectopically expressed AR promoter was determined by qPCR using a common forward primer targeting the vector sequence and a reverse primer specific to each fragment. Data shown are mean (±SEM) of technical replicates from one representative experiment of two. (D) Various AR promoter regions were cloned into the pGL4.10 vector and transfected into 293T cells with either control pLVX or HA-EZH2 overexpression. Cells were then subjected to luciferase reporter assays. Results were normalized to the Renilla internal control. Data shown are mean (±SEM) of technical replicates from one representative experiment of three. (E) Schematic view of the AR promoter sequence starting from the transcription start site (TSS). The sgRNAs were labeled sgAR1 to 4, their sequences are shown in green font, and their distances to the AR TSS are marked as numbers. The primers (F2 and R2) for PCR validation are shown in purple. (F and G) The distal AR promoter region is required for EZH2 activation of AR transcription. LNCaP cells were infected with lentiCRISPR-Cas9 containing the pLENTI.V2 control, sgAR1+2, sgAR3+4, or sgAR1+4 for 48 hr. CRISPR-Cas9-mediated genome editing was confirmed by Sanger sequencing (F) and genomic DNA PCR (G) using primers F2 and R2 (indicated in A and E). (H) CRISPR-Cas9-edited LNCaP cells were transfected with control or EZH2-targeting siRNA for 48 hr. Total RNA was harvested and subjected to RT-PCR analysis using F2 and R2, which are expected to yield a wild-type (AR WT, top band with black asterisk) and a CRISPR-Cas9-deleted (AR del, bottom bands with red asterisk) AR mRNA.
Figure 4.
Figure 4.. EZH2 Activates the AR Independently of Its Histone Methyltransferase Activity
(A) The AR promoter is occupied by EZH2 and H3K27ac but not H3K27me3, whereas the promoter of SLIT2, an epigenetic target of EZH2, is occupied with EZH2 and H3K27me3 but not H3K27ac. HA-EZH2 ChIP-seq was performed using anti-HA in LNCaP cells with HA-EZH2 overexpression. H3K27me3 and H3K27ac ChIP-seq was performed in LNCaP cells. (B) EZH2, but not SUZ12, decreased AR expression levels. LNCaP or C4–2B cells were infected with pLKO.1V, shEZH2, shSUZ12, or shAR for 48 hr, and cell lysates were subjected to western blot analysis. (C–F) EZH2 methyltransferase inhibitors failed to abolish AR expression. LNCaP cells were treated with EZH2 inhibitors GSK126 (C and D) or EPZ (E) for 72 hr, and the cell lysates were subjected to western blot (C and D) and qRT-PCR (E and F) analyses. The data shown in (E) and (F) are mean (±SEM) of technical replicates from one representative experiment of three. (G and H) Both WT and the catalytically dead mutant H689A of EZH2 rescued AR expression. LNCaP cells were subjected to EZH2 knockdown (siEZH2), followed by re-introduction of WT or mutant (H689A) EZH2 for 72 hr. Cell lysates were then collected and analyzed by qRT-PCR (G) or western blotting (H). (I) Both WT and H689A EZH2 are able to bind to the AR promoter. LNCaP cells were infected with pLVX control, HA-EZH2 WT, or HA-EZH2 H689A for 48 hr and then subjected to HA ChIP-qPCR. SLIT2 was used as a positive control and KIAA0066 as a negative control. Data shown are mean (±SEM) of technical replicates from one representative experiment of three. Overexpression of the HA-tagged WT and H689A EZH2 were validated by western blot (inset).
Figure 5.
Figure 5.. Methylation-Dependent and -Independent Transcriptional Programs of EZH2 in Prostate Cancer
(A) Dual EZH2 transcriptional programs in prostate cancer (PCa). LNCaP cells were treated with either EPZ versus vehicle control or siEZH2 versus siCtrl and then profiled in triplicate microarray experiments. Genes that were significantly up- or downregulated by siEZH2 compared with the control were clustered across all samples and are shown as heatmaps. Each row represents one gene and each column one sample. The siEZH2-induce genes that were also induced by EPZ were termed class I genes and those unchanged by EPZ class II genes. Genes that were activated by EZH2 were defined as class III genes. (B) EZH2-regulated genes that contain at least one EZH2 ChIP-seq binding site at their promoter regions (±5 kb) were defined as direct targets of EZH2. H3K27ac and H3K27me3 ChIP-seq was performed in LNCaP cells with siCtrl or siEZH2, and their intensities around the three classes of direct EZH2-target genes were analyzed by boxplots. The p values evaluate the differences of ChIP-seq signals in siEZH2 versus siCtrl cells. (C) All EZH2 binding sites identified in control LNCaP cells were rank-ordered based on EZH2 ChIP-seq intensities. Shown at the top are average intensities, and at the bottom are heatmaps of EZH2, H3K27ac, and H3K27me3 ChIP-seq around all EZH2 binding sites. (D) Venn diagram showing overlap among EZH2, H3K27ac, and HEK27me3 binding sites. ChIP-seq was performed in control LNCaP cells. (E) EZH2 target genes marked with H3K27ac are abundantly expressed, whereas those marked by H3K27me3 are repressed. Genes whose promoters (±1 kb to the TSS) contain at least one EZH2 binding site with a peak score greater than 12 were selected. The subset (1,415) marked by H3K27ac, but not H3K27me3, was defined as EZH2-ac genes, whereas the subset (1,294) marked by H3K27me3, but not H3K27ac, was defined as EZH2-me genes. The expression levels (FPKM) of these genes in publicly available RNA-seq data (GSM3018523 and GSM3018524) that were performed in LNCaP cells are shown as boxplots. (F) EZH2-me genes are enriched for upregulation by EZH2 knockdown or EPZ treatment, whereas EZH2-ac genes are enriched for downregulation by EZH2 knockdown independently of EPZ. About 800 of 1,415 (57%) EZH2-ac genes, but only 60 of 1,294 (4.6%) EZH2-me genes, were detected in microarray experiments. The percentages of the genes that were significantly up- or downregulated by siEZH2 compared with siCtrl or by EPZ treatment compared with DMSO were calculated and plotted.
Figure 6.
Figure 6.. Simultaneous EZH2 and AR Targeting Remarkably Inhibited PCa Cell Growth
(A) Combinatorial GSK126 and enzalutamide (Enz) treatment significantly inhibited LNCaP cell growth and drug resistance. LNCaP cells were maintained in DMSO, GSK126 (0.5uM), Enz (0.5uM), or both for 55 days. Cells were counted and re-plated whenever needed, and accumulated cell numbers were determined. Data shown are for one representative experiment of two. (B and C) LNCaP (B) or C4–2B (C) cells were treated with DMSO, Enz (1 μM for LNCaP and10 μM for C4–2B), EPZ (1 μM), or both. Cell growth was measured with WST-1 reagent every 2 days. Data shown are mean ± SEM of technical replicates from one representative experiment of three. (D and E) LNCaP (D) or C4–2B (E) cells were treated with DMSO, Enz (1 μM for LNCaP and 10 μM for C4–2B), EPZ (1 μM), or both for 2 weeks, followed by 0.002% crystal violet staining to assay colony formation. Data shown are technical replicates from one representative experiment of three. (F and G) Combinatorial Enz and EPZ treatment induced cell cycle arrest. LNCaP (F) or C4–2B (G) cells were treated with DMSO, Enz (1 μM for LNCaP and 10 μM for C4–2B), EPZ (1 μM), or both for 3 days, followed by cell cycle analysis via flow cytometry with propidium iodide staining.
Figure 7.
Figure 7.. Combination of the Enzymatic EZH2 Inhibitor with Enz Markedly Reduced Xenograft Tumor Growth
(A) EZH2-mediated transcription activities were blocked by combinatorial EPZ and Enz treatment. C4–2B cells were treated with DMSO, EPZ (1 μM), Enz (10 μM), or both for 7 days and then subjected to RNA-seq. FPKM values of EZH2-induced and -repressed gene sets across all samples were clustered and visualized as heatmaps. (B and C) Enz and EPZ combination greatly reduced C4–2B xenograft tumor growth in vivo. C4–2B cells were implanted subcutaneously in surgically castrated NOD.SCID mice. Upon palpable tumor formation, the mice (n = 7/group) were randomized to receive vehicle (1% carboxymethylcellulose sodium [CMC-Na+] and 1% Tween 30), 10 mg/kg Enz (once a day), 250 mg/kg EPZ (twice a day), or both by oral gavage for 3 weeks. Tumor volume (B) and weight at the endpoint (C) were measured by a second person in a blinded fashion. Statistical differences in tumor volume and tumor weight among groups were determined using two-way repeated-measures ANOVA (p < 0.001) and one-way ANOVA (p < 0.02), respectively. (D) Western blotting of target genes in C4–2B xenograft tumors at the endpoint. (E) Representative H3K27me3 and Ki-67 immunohistochemistry images of tumor sections from each treatment group. (F) A model depicting dual roles of EZH2 as an epigenetic silencer, a function that can be blocked by enzymatic inhibitors such as GSK126 and EPZ, and as a transcriptional activator of AR, which can be blocked by AR antagonists such as enzalutamide.

References

    1. Ardehali MB, Anselmo A, Cochrane JC, Kundu S, Sadreyev RI, and Kingston RE (2017). Polycomb Repressive Complex 2 Methylates Elongin A to Regulate Transcription. Mol Cell 68, 872–884.e6. - PMC - PubMed
    1. Dardenne E, Beltran H, Benelli M, Gayvert K, Berger A, Puca L, Cyrta J, Sboner A, Noorzad Z, MacDonald T, et al. (2016). N-Myc Induces an EZH2-Mediated Transcriptional Program Driving Neuroendocrine Prostate Cancer. Cancer Cell 30, 563–577. - PMC - PubMed
    1. Gonzalez ME, DuPrie ML, Krueger H, Merajver SD, Ventura AC, Toy KA, and Kleer CG (2011). Histone methyltransferase EZH2 induces Akt-dependent genomic instability and BRCA1 inhibition in breast cancer. Cancer Res. 71, 2360–2370. - PMC - PubMed
    1. He A, Shen X, Ma Q, Cao J, von Gise A, Zhou P, Wang G, Marquez VE, Orkin SH, and Pu WT (2012). PRC2 directly methylates GATA4 and represses its transcriptional activity. Genes Dev. 26, 37–42. - PMC - PubMed
    1. Höller M, Westin G, Jiricny J, and Schaffner W (1988). Sp1 transcription factor binds DNA and activates transcription even when the binding site is CpG methylated. Genes Dev. 2, 1127–1135. - PubMed

Publication types

MeSH terms