

Nationwide school malaria parasitaemia survey in public primary schools, the United Republic of Tanzania
- PMID: 30518365
- PMCID: PMC6280377
- DOI: 10.1186/s12936-018-2601-1
Nationwide school malaria parasitaemia survey in public primary schools, the United Republic of Tanzania
Abstract
Background: A nationwide, school, malaria survey was implemented to assess the risk factors of malaria prevalence and bed net use among primary school children in mainland Tanzania. This allowed the mapping of malaria prevalence at council level and assessment of malaria risk factors among school children.
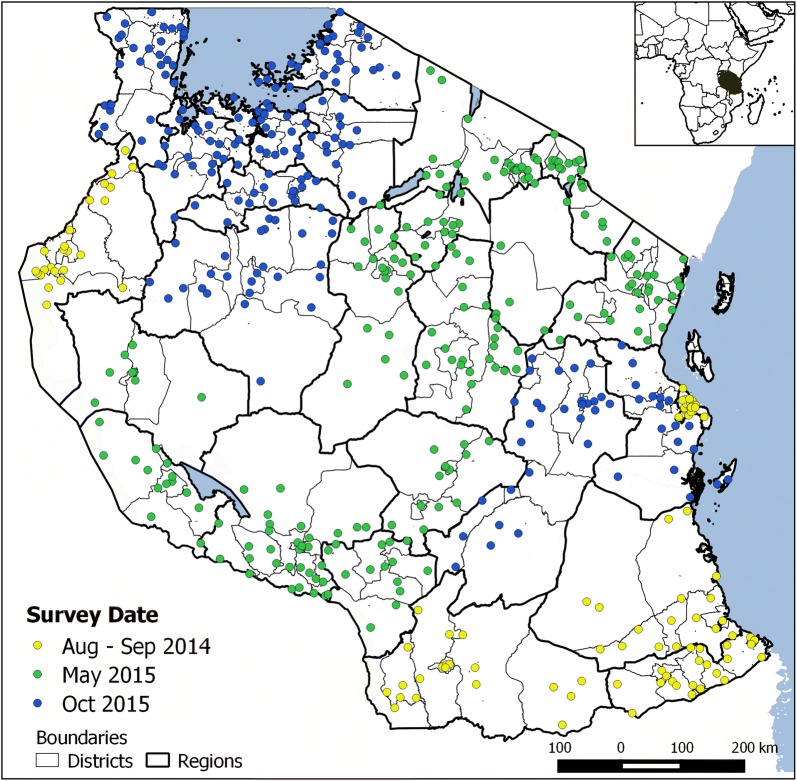
Methods: A cross-sectional, school, malaria parasitaemia survey was conducted in 25 regions, 166 councils and 357 schools in three phases: (1) August to September 2014; (2) May 2015; and, (3) October 2015. Children were tested for malaria parasites using rapid diagnostic tests and were interviewed about household information, parents' education, bed net indicators as well as recent history of fever. Multilevel mixed effects logistic regression models were fitted to estimate odds ratios of risk factors for malaria infection and for bed net use while adjusting for school effect.
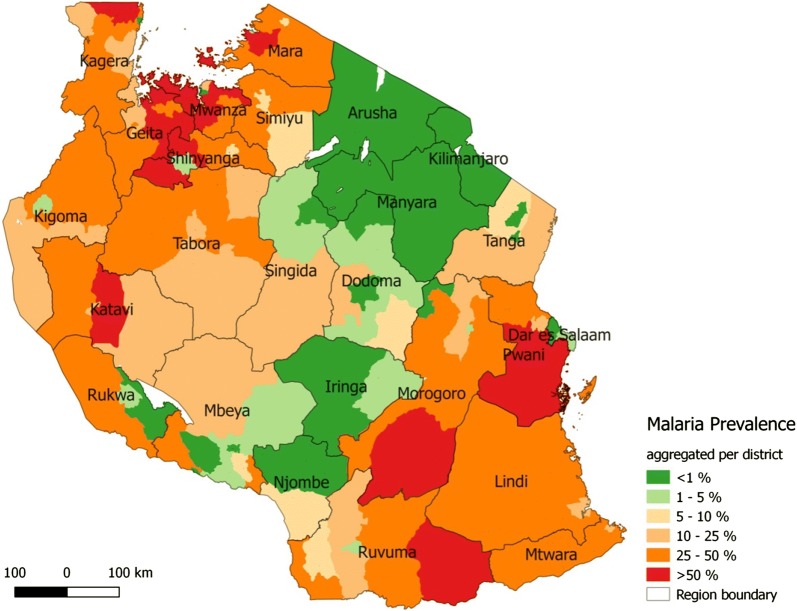
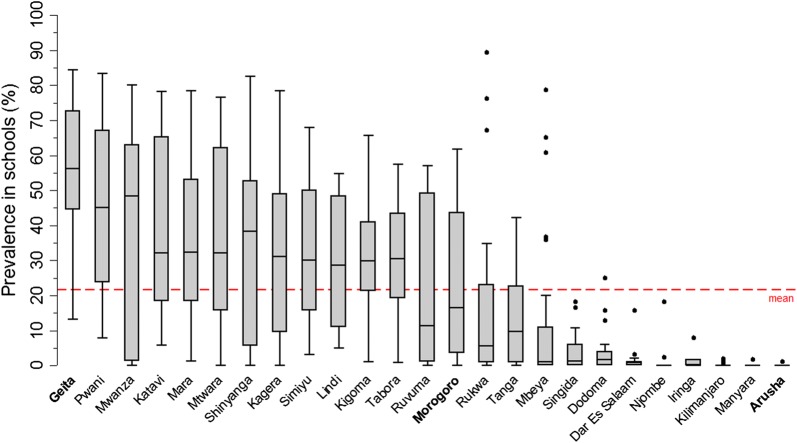
Results: In total, 49,113 children were interviewed and tested for malaria infection. The overall prevalence of malaria was 21.6%, ranging from < 0.1 to 53% among regions and from 0 to 76.4% among councils. The malaria prevalence was below 5% in 62 of the 166 councils and above 50% in 18 councils and between 5 and 50% in the other councils. The variation of malaria prevalence between schools was greatest in regions with a high mean prevalence, while the variation was marked by a few outlying schools in regions with a low mean prevalence. Overall, 70% of the children reported using mosquito nets, with the highest percentage observed among educated parents (80.7%), low land areas (82.7%) and those living in urban areas (82.2%).
Conclusions: The observed prevalence among school children showed marked variation at regional and sub-regional levels across the country. Findings of this survey are useful for updating the malaria epidemiological profile and for stratification of malaria transmission by region, council and age groups, which is essential for guiding resource allocation, evaluation and prioritization of malaria interventions.
Keywords: Malaria; Malaria prevalence; Malaria surveillance; Mosquito net use; School children; Tanzania.
Figures
References
-
- National Malaria Control Programme (Tanzania), WHO (Tanzania), Ifakara Health Institute (Tanzania), KEMRI-Wellcome Trust (Kenya). An epidemiological profile of malaria and its control in mainland Tanzania. Report funded by Roll Back Malaria and Department for International Development-UK; 2013. p. 152.
-
- WHO. World Malaria Report 2015. Geneva: World Health Organization; 2015.
MeSH terms
Grants and funding
LinkOut - more resources
Full Text Sources
Medical
