. 2018 Dec 5;37(1):304.
doi: 10.1186/s13046-018-0980-3.

IMPDH2 promotes colorectal cancer progression through activation of the PI3K/AKT/mTOR and PI3K/AKT/FOXO1 signaling pathways

Affiliations

IMPDH2 promotes colorectal cancer progression through activation of the PI3K/AKT/mTOR and PI3K/AKT/FOXO1 signaling pathways

Shiyu Duan et al. J Exp Clin Cancer Res. .

Abstract

Background: Inosine 5'-monophosphate dehydrogenase type II (IMPDH2) was originally identified as an oncogene in several human cancers. However, the clinical significance and biological role of IMPDH2 remain poorly understood in colorectal cancer (CRC).

Methods: Quantitative real-time polymerase chain reaction (qPCR), western blotting analysis, the Cancer Genome Atlas (TCGA) data mining and immunohistochemistry were employed to examine IMPDH2 expression in CRC cell lines and tissues. A series of in-vivo and in-vitro assays were performed to demonstrate the function of IMPDH2 and its possible mechanisms in CRC.

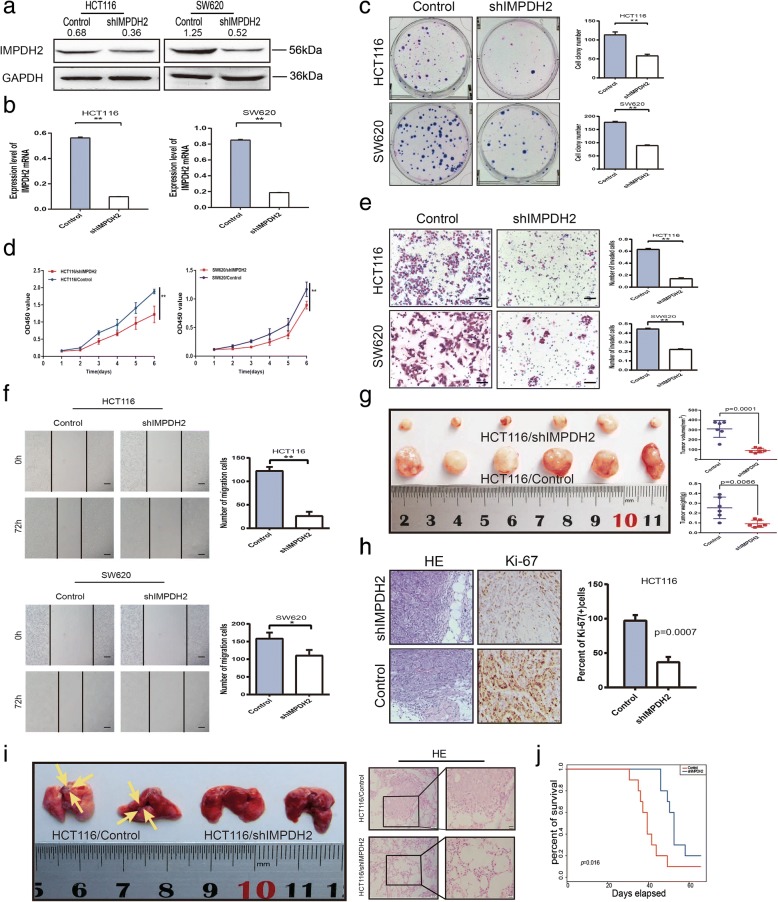
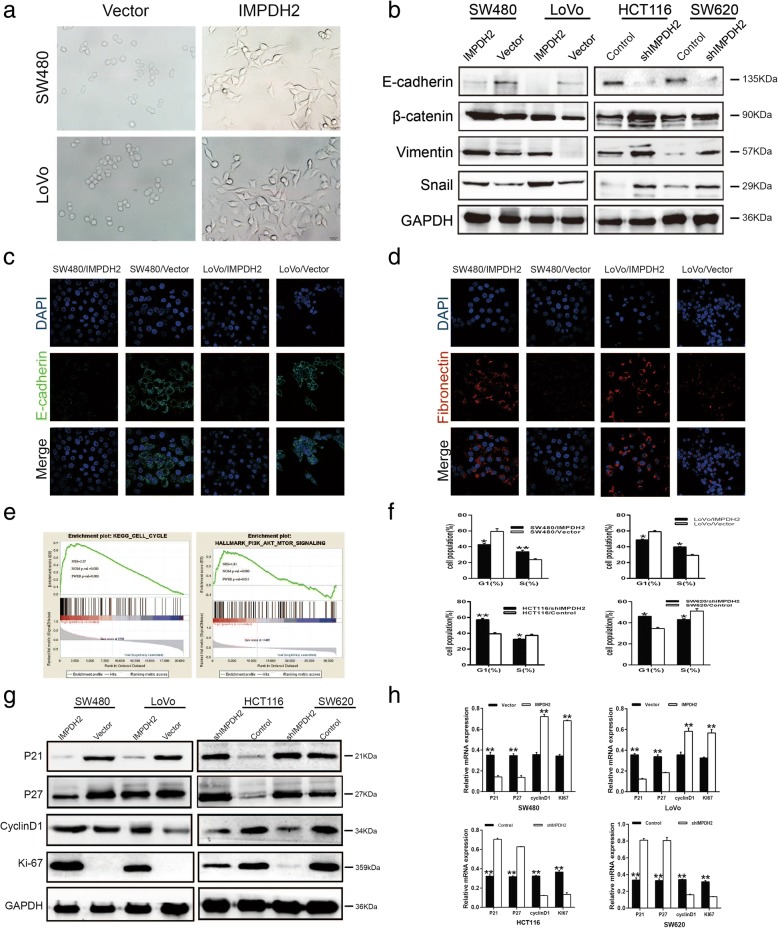
Results: IMPDH2 was upregulated in CRC cells and tissues at both mRNA and protein level. High IMPDH2 expression was closely associated with T stage, lymph node state, distant metastasis, lymphovascular invasion and clinical stage, and significantly correlated with poor survival of CRC patients. Further study revealed that overexpression of IMPDH2 significantly promoted the proliferation, invasion, migration and epithelial-mesenchymal transition (EMT) of CRC cells in vitro and accelerated xenograft tumour growth in nude mice. On the contrary, knockdown of IMPDH2 achieved the opposite effect. Gene set enrichment analysis (GSEA) showed that the gene set related to cell cycle was linked to upregulation of IMPDH2 expression. Our study verified that overexpressing IMPDH2 could promote G1/S phase cell cycle transition through activation of PI3K/AKT/mTOR and PI3K/AKT/FOXO1 pathways and facilitate cell invasion, migration and EMT by regulating PI3K/AKT/mTOR pathway.

Conclusions: These results suggest that IMPDH2 plays an important role in the development and progression of human CRC and may serve as a novel prognostic biomarker and therapeutic target for CRC.

Keywords: Cell cycle; Colorectal cancer; EMT; IMPDH2; Proliferation.


Conflict of interest statement

Ethics approval and consent to participate

This study was approved by the Ethics Committees of Nanfang Hospital, Southern Medical University. Written informed consent was obtained from all patients.

Consent for publication

Not applicable.

Competing interests

The authors declare that they have no competing interests.

Publisher’s Note

Springer Nature remains neutral with regard to jurisdictional claims in published maps and institutional affiliations.

Figures

Fig. 1
Fig. 1
The relationship between IMPDH2 expression and poor prognosis of CRC. (a and b) The relative expression of IMPDH2 protein and mRNA in normal human colon epithelial cells (FHC) and seven CRC cell lines (HCT116, SW620, M5, SW480, HT29, DLD-1 and LoVo) by western blotting and qPCR. Mean ± SD (n = 3). (c) The expression of IMPDH2 protein in 8 surgical CRC tissues and their paired adjacent normal tissues by western blotting. (d) The expression of IMPDH2 mRNA in 34 pairs of fresh CRC tissues and matched adjacent normal tissues using qPCR. (e) The IMPDH2 expression in CRC tissues with or without metastases. nmCRC denotes CRC tissues without metastases (n = 18); mCRC denotes CRC tissues with lymph node metastases (n = 16). (f) The expression of IMPDH2 mRNA in 97 paired human CRC tissues and their adjacent normal mucosa tissues from TCGA dataset. IMPDH2 expression was normalized to GAPDH and expressed relative to the match adjacent normal tissues. (g) Representative images of IMPDH2 expression in CRC tissues and paired adjacent normal tissues (NT) by immunohistochemistry, Scale bars, 200 μm and 50 μm, respectively. (h and i) Kaplan-Meier survival analysis of the association between IMPDH2 expression and overall survival or progression-free survival in 214 CRC patients
Fig. 2
Fig. 2
Overexpression of IMPDH2 promotes proliferation, migration and invasion of CRC cells and accelerates tumour growth in the nude mouse model. (a and b) Overexpression of IMPDH2 was confirmed at the protein and mRNA level in SW480 and LoVo cells by western blotting and qPCR. Mean ± SD (n = 3). (c and d) IMPDH2 overexpression promoted proliferation ability of SW480 and LoVo cells as determined by colony formation and CCK8 assays. Mean ± SD (n = 3). (e) IMPDH2 overexpression significantly promoted the invasion ability of SW480 and LoVo cells by the transwell assay. Representative photographs (left) and quantification (right) are shown. The number of cells that invaded through the extracellular matrix after 24 h was counted in five randomly selected microscopic fields. Mean ± SD (n = 3). Scale bars, 100 μm. (f) IMPDH2 overexpression significantly promoted the migration ability of SW480 and LoVo cells by cell wound healing assay. Images were taken at 0 h, 24 h, 48 h and 72 h. The number of migrated cells was counted (right). Mean ± SD (n = 3). Scale bars, 200 μm. (g) IMPDH2 overexpression promoted tumour growth in the nude mouse model by xenograft growth assay. Gross observation of xenograft tumour size (left). Plot of tumour volume and weight over time (right). (h) H&E and Ki-67 staining of a xenograft tumour. The percent of Ki-67 positive cells was shown (right). Each error bar represents the mean ± SD of three replicate samples. Scale bars, 50 μm and 20 μm. *P < 0.05; **P < 0.01
Fig. 3
Fig. 3
Downregulation of IMPDH2 inhibits proliferation, migration and invasion of CRC cells and suppresses tumour growth in the nude mouse model. (a and b) Knockdown of IMPDH2 was confirmed at the protein and mRNA level in HCT116 and SW620 cells by western blotting and qPCR. Mean ± SD (n = 3). (c and d) IMPDH2 knockdown inhibited proliferation ability of HCT116 and SW620 cells as determined by colony formation and CCK8 assays. Mean ± SD (n = 3). (e) IMPDH2 knockdown significantly suppressed the invasion ability of HCT116 and SW620 cells by the transwell assay. Representative photographs (left) and quantification (right) are shown. The number of cells that invaded through the extracellular matrix after 24 h was counted in five randomly selected microscopic fields. Mean ± SD (n = 3). Scale bars, 100 μm. (f) IMPDH2 knockdown significantly inhibited the migration ability of HCT116 and SW620 cells by cell wound healing assay. Images were taken at 0 h, 24 h, 48 h and 72 h. The number of migrated cells was counted (right). Mean ± SD (n = 3). Scale bars, 200 μm. (g) IMPDH2 silencing inhibited tumour growth in the nude mouse model by xenograft growth assay. Gross observation of xenograft tumour size (left). Statistical chart of a xenograft tumour volume and weight (right). (h) H&E and Ki-67 staining of a xenograft tumour. The percent of Ki-67 positive cells was shown (right). Scale bars, 50 μm and 20 μm. (i) Tumor cells were injected into nude mice through the tail vein to evaluate the lung homing potential of cells. Gross observation of lung metastases (left). H&E staining of lung metastatic nodules (right). Scale bars, 50 μm and 20 μm. (j) Kaplan-Meier survival analyses (log-rank) for the mice with HCT116/shIMPDH2 cells versus HCT116/Control cells were performed. Each error bar represents the mean ± SD of three replicate samples. *P < 0.05; **P < 0.01
Fig. 4
Fig. 4
The effect of IMPDH2 on EMT and cell-cycle transition of CRC cells. (a) The spindle cell phenotype of IMPDH2-overexpressed cells (SW480/IMPDH2 and LoVo/IMPDH2) and the epithelial phenotype of CRC cells from its control group (Vector) showing epithelial-to-mesenchymal transition (EMT) induced by IMPDH2 overexpression. (b) IMPDH2 overexpression induces hallmarks of the EMT, including loss of E-cadherin and accumulation of Vimentin and Snail in CRC cells. (c and d) Immunofluorescent staining of E-cadherin and Fibronectin in SW480/IMPDH2 and LoVo/IMPDH2 Cells. (e) GSEA showing a significant association between IMPDH2 expression and CELL_CYCLE and PI3K_AKT_MTOR_SIGNALING signaling pathway. The top portion of the figure plots the enrichment scores for each gene, whereas the bottom portion of the plot shows the value of the ranking metric moving down the list of ranked genes. Y-axis: value of the ranking metric; X-axis: the rank for all genes. NES, normalized enrichment score. (f) Cells proportion in various phases of the cell cycle. Cells were stained with Propidium Iodide (PI) and analyzed by flow cytometry. Mean ± SD (n = 3). (g) Western blotting analysis of p21Cip1, p27Kip1, cyclin D1, and Ki-67 proteins in IMPDH2-overexpressed cells or IMPDH2 shRNA-infected cells. GAPDH was used as a loading control. *P < 0.05; **P < 0.01. (h) Real-time qPCR analysis of p21Cip1, p27Kip1, Ki-67 and cyclin D1 mRNA expression in IMPDH2-overexpressed cells (upper panel) or IMPDH2 shRNA-infected cells (lower panel). Expression levels were normalized to GAPDH. Mean ± SD (n = 3)
Fig. 5
Fig. 5
IMPDH2 promoted CRC progression through the PI3K/AKT/mTOR and PI3K/AKT/FOXO1 signaling pathways. (a) Western blotting analysis of p-AKT, total AKT, p-GSK-3β, total GSK-3β, p-mTOR, total mTOR, p-FOXO1, and total FOXO1 in IMPDH2-overexpressed cells or IMPDH2 shRNA-infected cells. (b) SW480/IMPDH2 and LoVo/IMPDH2 cells were treated with the AKT inhibitor LY294002 (20IM) and DMSO for 24 h, then harvested to examine the expression levels of the indicated proteins by Western blotting. (c) Colony formation assay after treatment with LY294002 and DMSO. Mean ± SD (n = 3). (d) The proliferation ability of SW480/IMPDH2 and LoVo/IMPDH2 cells were determined by CCK8 assay. *P < 0.05; **P < 0.01. (e and f) The invasive and migratory abilities of SW480/IMPDH2 and LoVo/IMPDH2 cells were determined by transwell and wound healing assays after treatment with rapamycin and DMSO. Mean ± SD (n = 3). *P < 0.05; **P < 0.01. (g) Inhibition of the mTOR activity induced upregulation of E-cadherin and downregulation of Vimentin and Snail in IMPDH2-overexpressed CRC cells

References

    1. Torre LA, Bray F, Siegel RL, Ferlay J, Lortet-Tieulent J, Jemal A. Global cancer statistics, 2012. CA Cancer J Clin. 2015;65:87–108. doi: 10.3322/caac.21262. - DOI - PubMed
    1. Shu Q, Nair V. Inosine monophosphate dehydrogenase (IMPDH) as a target in drug discovery. Med Res Rev. 2008;28:219–232. doi: 10.1002/med.20104. - DOI - PubMed
    1. Sintchak MD, Nimmesgern E. The structure of inosine 5′-monophosphate dehydrogenase and the design of novel inhibitors. Immunopharmacology. 2000;47:163–184. doi: 10.1016/S0162-3109(00)00193-4. - DOI - PubMed
    1. Nagai M, Natsumeda Y, Konno Y, Hoffman R, Irino S, Weber G. Selective up-regulation of type II inosine 5′-monophosphate dehydrogenase messenger RNA expression in human leukemias. Cancer Res. 1991;51:3886–3890. - PubMed
    1. Colby TD, Vanderveen K, Strickler MD, Markham GD, Goldstein BM. Crystal structure of human type II inosine monophosphate dehydrogenase: implications for ligand binding and drug design. Proc Natl Acad Sci U S A. 1999;96:3531–3536. doi: 10.1073/pnas.96.7.3531. - DOI - PMC - PubMed

MeSH terms