. 2019 Feb 1;294(5):1554-1567.
doi: 10.1074/jbc.RA118.006128. Epub 2018 Dec 5.

Converter domain mutations in myosin alter structural kinetics and motor function

Affiliations

Converter domain mutations in myosin alter structural kinetics and motor function

Laura K Gunther et al. J Biol Chem. .

Abstract

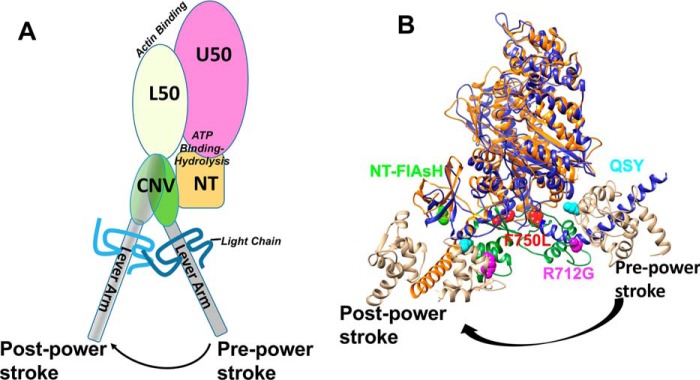
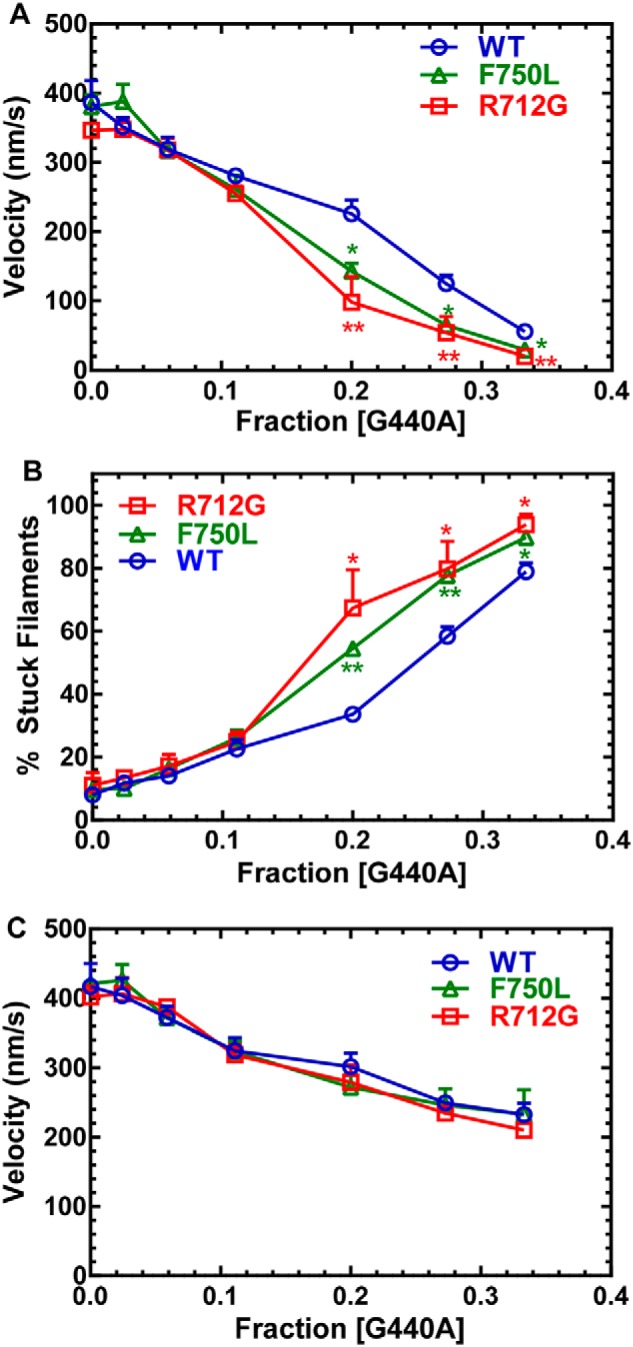
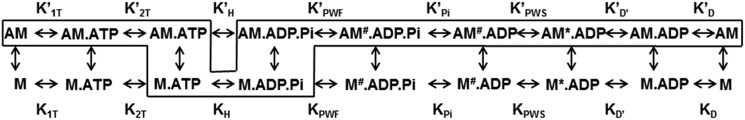
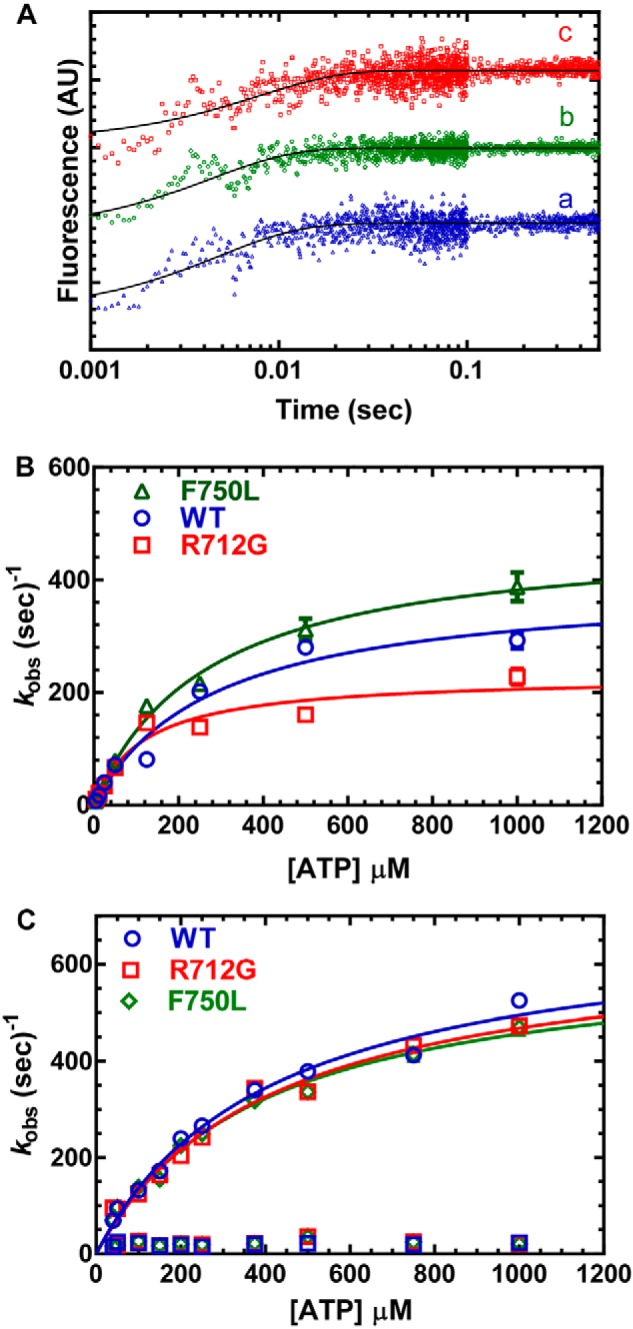
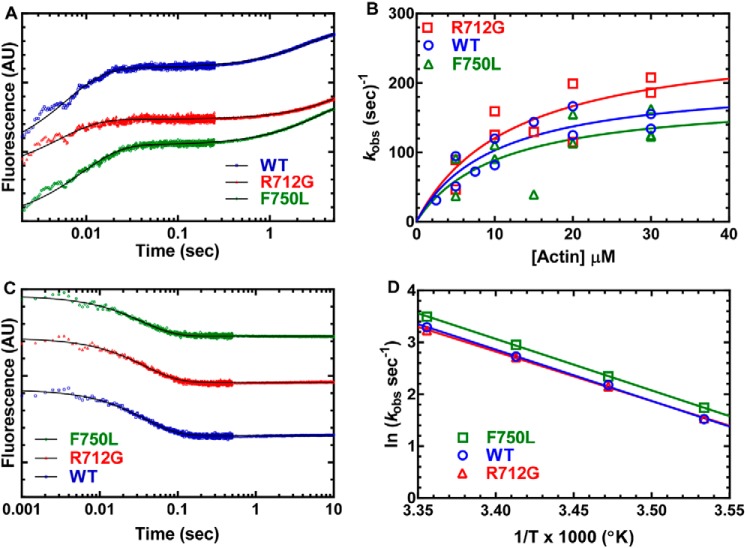
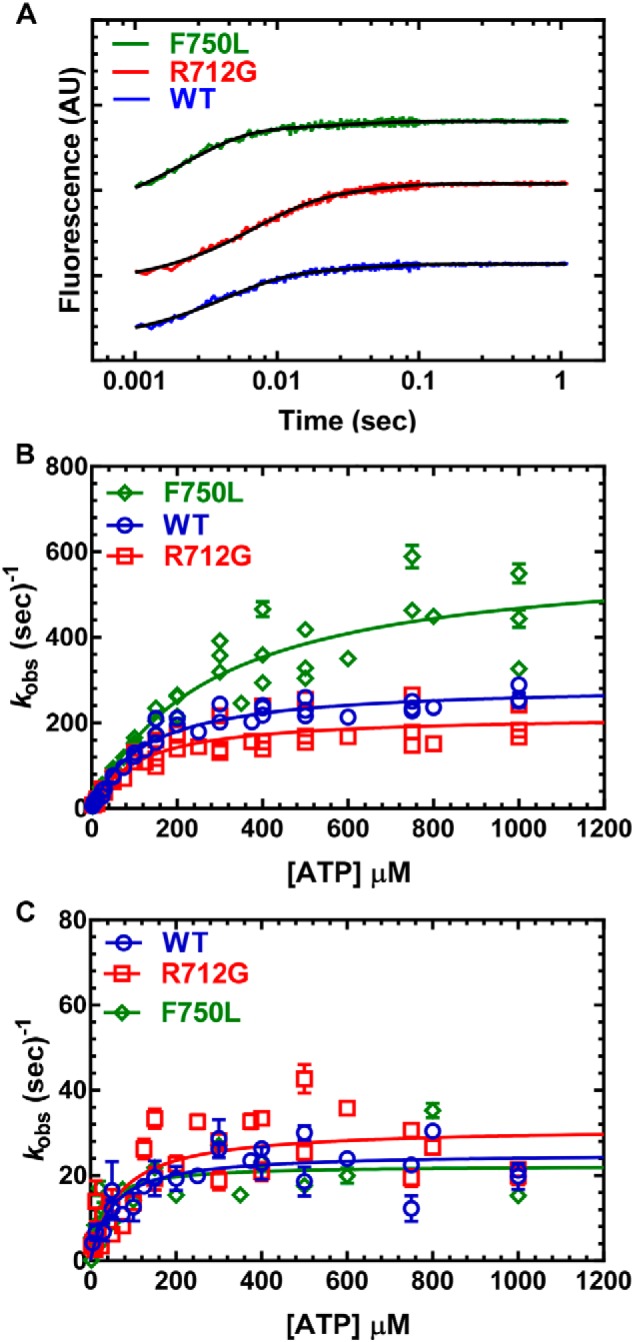
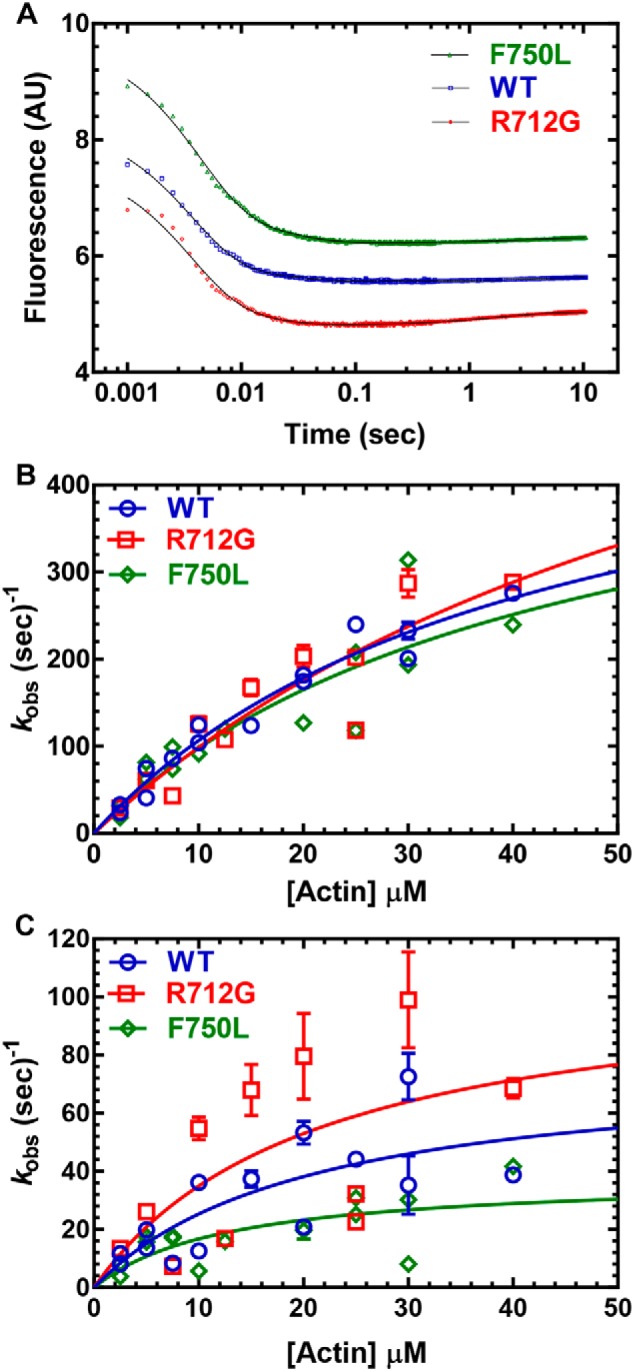
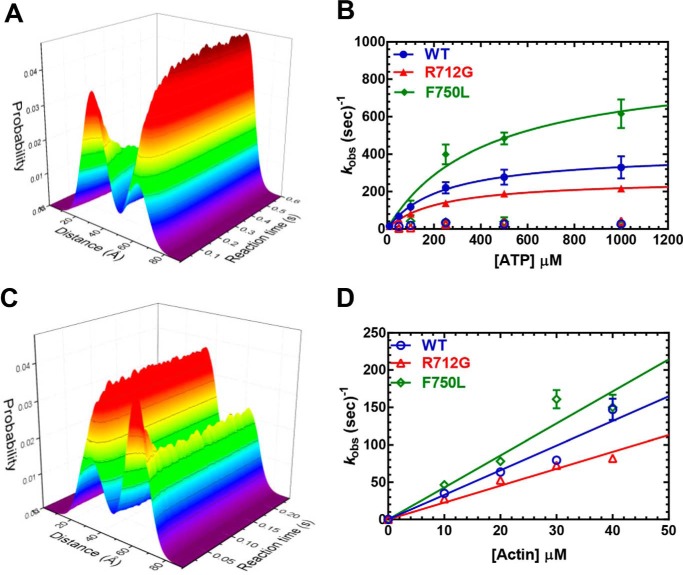
Myosins are molecular motors that use a conserved ATPase cycle to generate force. We investigated two mutations in the converter domain of myosin V (R712G and F750L) to examine how altering specific structural transitions in the motor ATPase cycle can impair myosin mechanochemistry. The corresponding mutations in the human β-cardiac myosin gene are associated with hypertrophic and dilated cardiomyopathy, respectively. Despite similar steady-state actin-activated ATPase and unloaded in vitro motility-sliding velocities, both R712G and F750L were less able to overcome frictional loads measured in the loaded motility assay. Transient kinetic analysis and stopped-flow FRET demonstrated that the R712G mutation slowed the maximum ATP hydrolysis and recovery-stroke rate constants, whereas the F750L mutation enhanced these steps. In both mutants, the fast and slow power-stroke as well as actin-activated phosphate release rate constants were not significantly different from WT. Time-resolved FRET experiments revealed that R712G and F750L populate the pre- and post-power-stroke states with similar FRET distance and distance distribution profiles. The R712G mutant increased the mole fraction in the post-power-stroke conformation in the strong actin-binding states, whereas the F750L decreased this population in the actomyosin ADP state. We conclude that mutations in key allosteric pathways can shift the equilibrium and/or alter the activation energy associated with key structural transitions without altering the overall conformation of the pre- and post-power-stroke states. Thus, therapies designed to alter the transition between structural states may be able to rescue the impaired motor function induced by disease mutations.

Keywords: ATPase; actin; cardiomyopathy; fluorescence resonance energy transfer (FRET); mechanochemistry; motor protein; muscle; myosin; structural kinetics.


Conflict of interest statement

The authors declare that they have no conflicts of interest with the contents of this article

Figures

Figure 1.
Figure 1.
Structural model of converter mutations in myosin V. A, diagram of the domain structure of myosin and the movement of the lever arm in the pre- and post-power–stroke states (L50, lower 50-kDa domain; U50, upper 50-kDa domain; CNV, converter domain; NT, N-terminal domain). B, an alignment of pre- and post-power–stroke state crystal structures showing the conformational change of the converter/lever arm. Navy, pre-power–stroke state structure (PDB code 1BR4); orange, post-power–stroke state structure (PDB code 1OE9); beige, light chain; green, converter domain.
Figure 2.
Figure 2.
In vitro motility–sliding velocity. The sliding velocity was similar to WT for both mutants in the absence of load. The presence of G440A MV (nonhydrolyzing mutant) was used as a tethering load in the loaded in vitro motility assay. A, the average velocity of all of the filaments (moving and nonmoving) was determined and plotted as a function of the fraction of G440A MV present relative to the total MV added to the assay. B, the number of stuck filaments was determined and plotted as a function of the fraction of G440A. C, the velocity of only the moving filaments was plotted as a function of G440A fraction. Significant differences of the mutants compared with the WT are indicated by asterisks (*, p < 0.05; **, p < 0.005; n = 4).
Scheme 1.
Scheme 1.
Conserved actomyosin ATPase pathway.
Figure 3.
Figure 3.
ATP binding and hydrolysis. A, MV (1 μm) was mixed with varying concentrations of ATP, and the tryptophan fluorescence increase was monitored as a function of time and fit to a single-exponential function. B, the observed rate constants were hyperbolically dependent on ATP concentration. C, the rate of ATP-induced dissociation from pyrene actin was examined by mixing MV:pyrene actin (0.25 μm) with varying concentrations of ATP. The fluorescence transients were fit to a two-exponential function with the fast phase being hyperbolically dependent on ATP concentration. The slow phase was a small component (5–10%) of the fluorescence signal and similar at each actin concentration (10–20 s−1). Fluorescence is reported in arbitrary units (AU).
Figure 4.
Figure 4.
Actin-activated product release. Sequential mix single-turnover experiments were performed by mixing MV with ATP, aging the reaction to form the M.ADP.Pi state (0.45 μm), and then mixing with different concentrations of actin in the presence of MDCC-PBP (5 μm). A, the fluorescence transients were fit to a single-exponential function (phosphate burst) followed by a linear or slow exponential rise. B, the phosphate release rate constants were plotted as a function of actin concentration and fit to a hyperbolic function to estimate the maximum rate of phosphate release. C, acto-MV (0.25 μm) in presence mantADP (5 μm) was mixed with saturating ATP (1 mm) at 25 °C to determine the ADP release rate constant. D, the mantADP release rate constant was examined as a function of temperature, and the associated Eyring plot (natural log of the ADP release rate constant as a function of inverse temperature) was fit to a linear regression. Fluorescence is reported in arbitrary units (AU).
Figure 5.
Figure 5.
Recovery stroke. 0.25 μm MV FlAsH.QSY-CaM was mixed with increasing concentrations of ATP, and the decrease in the FRET signal was monitored by following the increase in FlAsH fluorescence. A, the fluorescence transients were best fit by a two-exponential function at all ATP concentrations. B, the fast phase (recovery stroke) was the majority of the fluorescence signal (≥90%) and was hyperbolically dependent on ATP concentration. C, the slow phase was also hyperbolically dependent on ATP concentration. Fluorescence is reported in arbitrary units (AU).
Figure 6.
Figure 6.
Power stroke. Sequential mix single-turnover experiments were performed in which 0.25 μm MV FlAsH.QSY-CaM was mixed with ATP (0.2 μm), aged for 10 s, and then mixed with different concentrations of actin. A, the increase in FRET was monitored by the decrease in FlAsH fluorescence and was best fit by a three-exponential function. B, the fast phase of the fluorescence transients (fast power stroke) was plotted as a function of actin concentration and fit to a hyperbolic or linear function. C, the slow phase (slow power stroke) was hyperbolically dependent on actin concentration, whereas the very slow fluorescence increase was similar at all actin concentrations. Fluorescence is reported in arbitrary units (AU).
Figure 7.
Figure 7.
Transient time-resolved FRET: time-resolved fluorescence waveform acquisition of structural kinetics. A, (TR)2FRET of the recovery stroke. The fluorescence of 160 nm MV FlAsH.QSY-CaM changes upon rapid stopped-flow mixing with varying concentrations of ATP (0.01 mm shown). Both the peak fluorescence intensity and the waveform shape change over the reaction time. The three-dimensional plot depicts the nanosecond-resolved waveforms (xy-plane) evolving with reaction time (z axis). Each waveform was fit to a two-Gaussian distance distribution. The three-dimensional plot depicts each distance distribution (xy-plane) evolving with reaction time (z axis). B, the summary of rate constants from fitting the recovery-stroke (TR)2FRET data to a double-exponential function. C, (TR)2FRET of the power stroke. 160 nm MV and 10 μm ATP were mixed with 5.0 mm ADP and varying actin concentrations. D, summary of rate constants from fitting the power-stroke (TR)2FRET data to a single-exponential function.
Figure 8.
Figure 8.
Summary of allosteric interactions associated with the converter/relay helix/lever arm region. A, a diagram of the key structural elements that allow communication between the nucleotide-binding region and the lever arm (switch II, relay helix/loop, SH1-SH2 helix, converter domain; see “Discussion” for allosteric pathway description). B, graph representing the correlation between the ATP hydrolysis rate constant and potential interactions between the converter domain (Arg-712 site) and the light chain bound to the first IQ motif. C, an alignment of several myosin heavy chains demonstrating conservation of the Arg-712 (red box) and Phe-750 (green box) residues. D, an alignment of several myosin light chains demonstrating negatively charged residues in close proximity to the Arg-712 site. The red underlined residues were found to be in close proximity to the Arg-712 site in several crystal structures (PDB codes 1OE9, 1W7J, 4ZLK and 5N69). The following abbreviations were used for the myosin heavy chains: chicken MYO5A (cMVa), mouse MYO5A (mMVa), human MYO5A (hMVc), human MYH9 (hNMMIIa), human MYH10 (hNMMIIb), human MYH14 (hNMMIIc), chicken MYSS (cSkelMII), rabbit MYSS (rSkel), human MYH7 (hCardMIIb), porcine MYH7 (pCardiac). The following abbreviations were used for the myosin light chains: human MYL6B (hLC1sa), mouse CALM3 (mCaM), bovine ventricular MYL3 (bVELC), human ventricular MYL3 (hVELC), bovine non-muscle MYL6 (bLC17b), chicken skeletal MLRS (cSkelELC). The data in B were taken from the following references: cMVa:LC1sa (30), cMVa:CaM (51), mMVa:CaM (64), rSkel:ELC (65), pCardiac:vELC (66), hMVc:CaM (52), hNMMIIc:NoLC (67), hNMMIIb:17b (68), hNMMIIa:17b (69).

References

    1. De La Cruz E. M., and Ostap E. M. (2004) Relating biochemistry and function in the myosin superfamily. Curr. Opin. Cell Biol. 16, 61–67 10.1016/j.ceb.2003.11.011 - DOI - PubMed
    1. Syamaladevi D. P., Spudich J. A., and Sowdhamini R. (2012) Structural and functional insights on the Myosin superfamily. Bioinform. Biol. Insights 6, 11–21 - PMC - PubMed
    1. Heissler S. M., and Sellers J. R. (2014) Myosin light chains: Teaching old dogs new tricks. Bioarchitecture 4, 169–188 10.1080/19490992.2015.1054092 - DOI - PMC - PubMed
    1. Homburger J. R., Green E. M., Caleshu C., Sunitha M. S., Taylor R. E., Ruppel K. M., Metpally R. P., Colan S. D., Michels M., Day S. M., Olivotto I., Bustamante C. D., Dewey F. E., Ho C. Y., Spudich J. A., and Ashley E. A. (2016) Multidimensional structure-function relationships in human β-cardiac myosin from population-scale genetic variation. Proc. Natl. Acad. Sci. U.S.A. 113, 6701–6706 10.1073/pnas.1606950113 - DOI - PMC - PubMed
    1. Semsarian C., Ingles J., Maron M. S., and Maron B. J. (2015) New perspectives on the prevalence of hypertrophic cardiomyopathy. J. Am. Coll. Cardiol. 65, 1249–1254 10.1016/j.jacc.2015.01.019 - DOI - PubMed

Publication types

LinkOut - more resources