. 2018 Dec 18;115(51):13111-13116.
doi: 10.1073/pnas.1814928115. Epub 2018 Dec 5.

Fenestrations control resting-state block of a voltage-gated sodium channel

Affiliations

Fenestrations control resting-state block of a voltage-gated sodium channel

Tamer M Gamal El-Din et al. Proc Natl Acad Sci U S A. .

Abstract

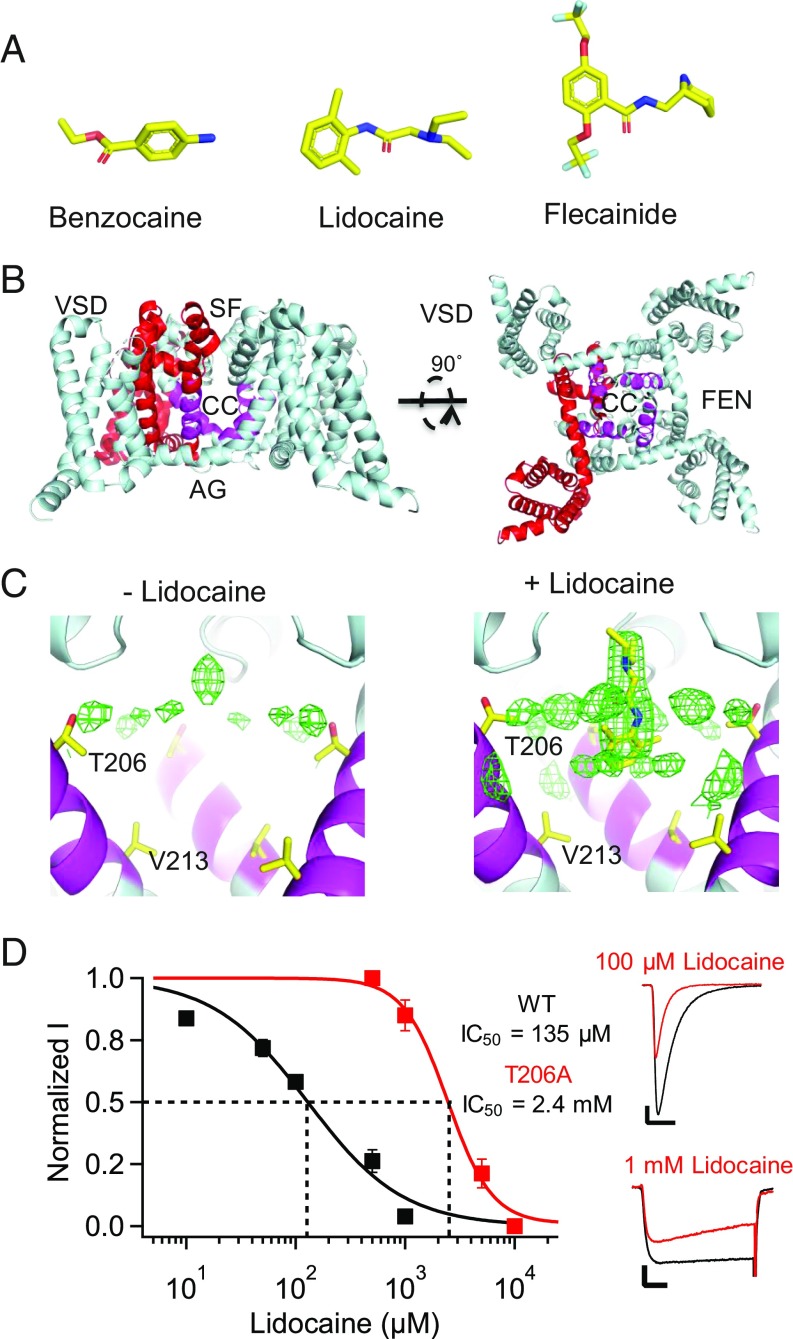
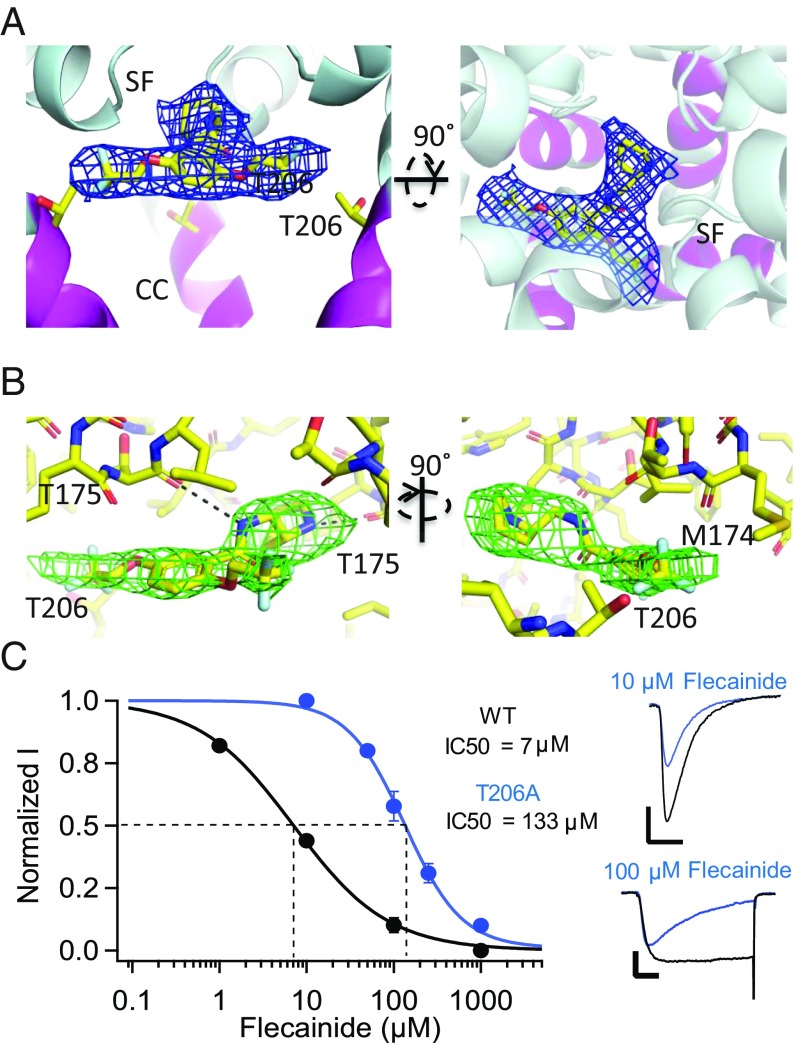
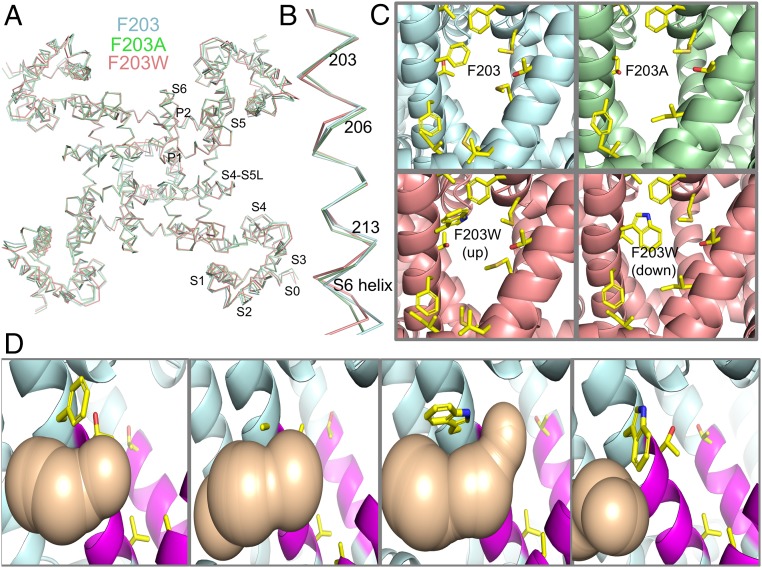
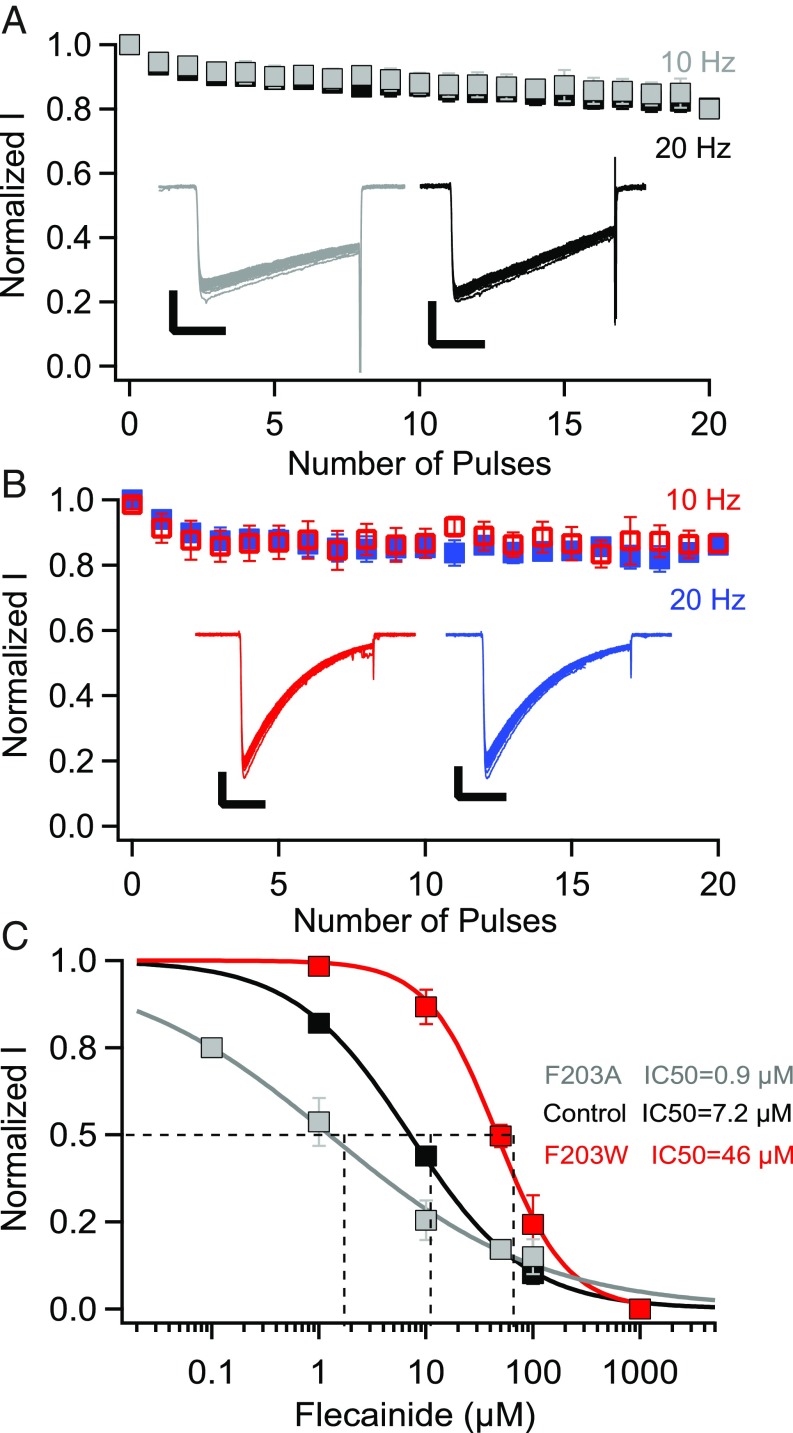
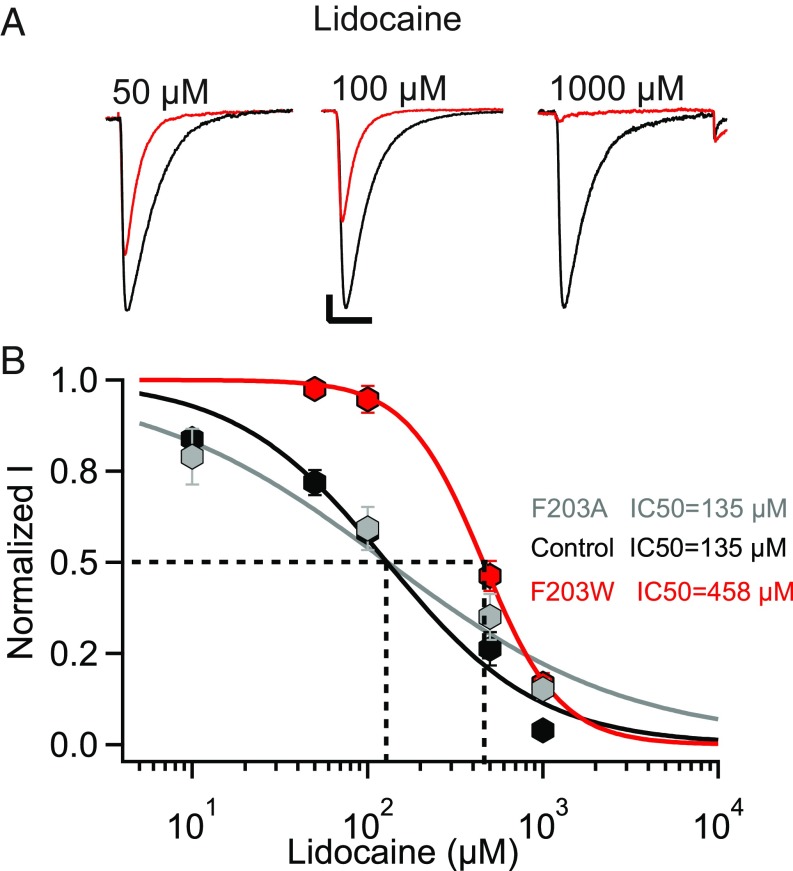
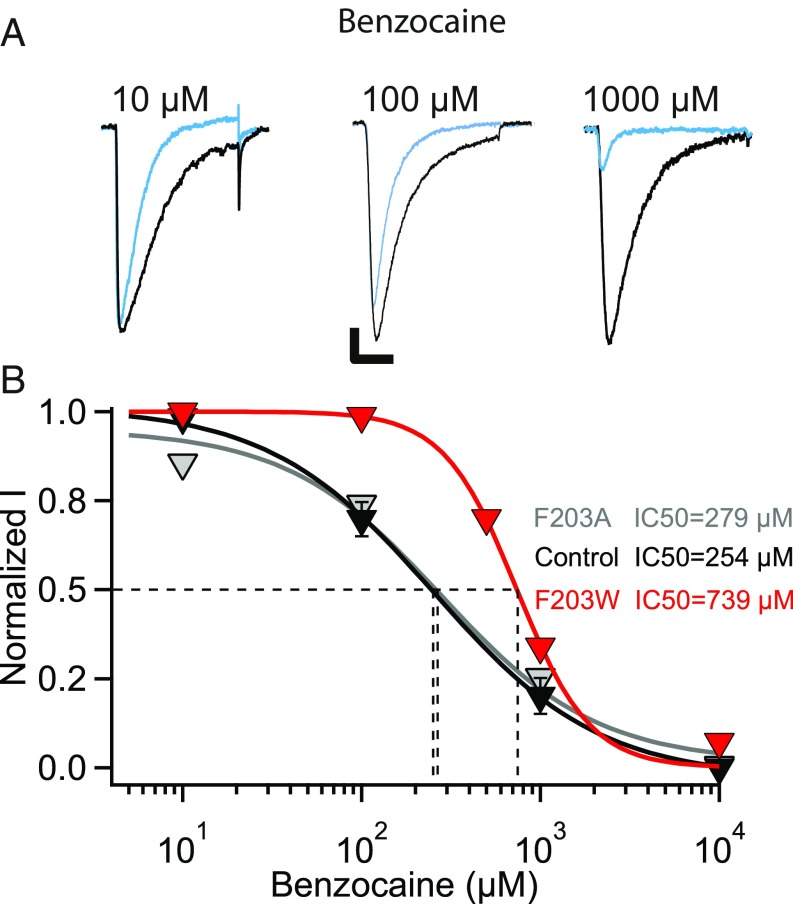
Potency of drug action is usually determined by binding to a specific receptor site on target proteins. In contrast to this conventional paradigm, we show here that potency of local anesthetics (LAs) and antiarrhythmic drugs (AADs) that block sodium channels is controlled by fenestrations that allow drug access to the receptor site directly from the membrane phase. Voltage-gated sodium channels initiate action potentials in nerve and cardiac muscle, where their hyperactivity causes pain and cardiac arrhythmia, respectively. LAs and AADs selectively block sodium channels in rapidly firing nerve and muscle cells to relieve these conditions. The structure of the ancestral bacterial sodium channel NaVAb, which is also blocked by LAs and AADs, revealed fenestrations connecting the lipid phase of the membrane to the central cavity of the pore. We cocrystallized lidocaine and flecainide with NavAb, which revealed strong drug-dependent electron density in the central cavity of the pore. Mutation of the contact residue T206 greatly reduced drug potency, confirming this site as the receptor for LAs and AADs. Strikingly, mutations of the fenestration cap residue F203 changed fenestration size and had graded effects on resting-state block by flecainide, lidocaine, and benzocaine, the potencies of which were altered from 51- to 2.6-fold in order of their molecular size. These results show that conserved fenestrations in the pores of sodium channels are crucial pharmacologically and determine the level of resting-state block by widely used drugs. Fine-tuning drug access through fenestrations provides an unexpected avenue for structure-based design of ion-channel-blocking drugs.

Keywords: antiarrhythmic drugs; fenestration; local anesthetics; sodium channel; voltage-gating.


Conflict of interest statement

The authors declare no conflict of interest.

Figures

Fig. 1.
Fig. 1.
Binding site for lidocaine on NaVAb. (A) LA/AADs used in this study: benzocaine, lidocaine, and flecainide. (B) The structure of NaVAb/I217C/Δ40 is shown in cartoon format. Residues homologous to those shown to be involved in LA/AAD binding are highlighted in magenta, and channel regions are labeled as VSD (voltage sensor), SF (selectivity filter), CC (central cavity), AG (activation gate), and FEN (fenestration). (C, Left) The structure of NaVAb/I217C/Δ40 when solved without any drugs in solution. The protein model is shown in cartoon format with the LA/AAD-binding site highlighted in magenta and sidechains of key residues (T206, V213) shown in stick format. Fo-Fc electron density contoured at 3σ is shown as green mesh, as calculated from data deposited as Protein Data Bank ID code 5vb8. (C, Right) The structure of NaVAb/I217C/Δ40 when solved with lidocaine in solution. The protein and electron density are displayed as on the Left. Lidocaine was manually placed into this model. (D) Effect of mutation of T206 on resting-state block of NaVAb by lidocaine. The peak current recorded during the first pulse after 2 min of drug perfusion was taken as a measure of drug inhibition of the resting state. (Left) Concentration-response curves for lidocaine inhibition of NavAb/WT (black, IC50 = 135 ± 20 μM), NaVAb/T206A (red, IC50 = 2.4 ± 0.3 mM) under conditions for resting-state block (SI Appendix, SI Materials and Methods). Each data point is an average of 5–10 cells. (Right) Sodium current recordings of NaVAb/WT and NaVAb/T206A in the absence (black) and presence (red) of 100 μM and 1 mM lidocaine, respectively. Pulses were applied from holding potentials of −160 or −140 mV to 0 mV. The vertical and horizontal scale bars represent 0.2 nA and 10 ms, respectively.
Fig. 2.
Fig. 2.
Binding site for flecainide on NaVAb. (A) Orthogonal views of flecainide in complex with NavAb/I217C. In each case the protein is displayed as cartoon helices, with the AAD binding site highlighted in magenta ribbon and sidechain sticks. Functional areas of the channel labeled as in Fig. 1. Flecainide is displayed as sticks, with yellow = carbon, red = oxygen, blue = nitrogen, and gray = fluoride. Electron density (2fo-fc) is displayed as a blue mesh, contoured at 1 σ. (B) Close-up, orthogonal views of flecainide in complex with NavAb/I217C. Flecainide and flecainide-associated residues are shown in stick format as in A, and potential hydrogen bonds are shown as black dashes. Omit map Fo-Fc electron density calculated from a model excluding flecainide is shown as a green mesh, contoured at 3 σ. (C) Effect of mutation of T206 on resting-state block of NaVAb by flecainide. The peak current recorded during the first pulse after 2 min of drug perfusion was taken as a measure of drug inhibition of the resting state. (Left) Concentration-response curves for flecainide inhibition of NavAb/WT (black circles, IC50 = 7 ± 0.38 μM), NavAb/T206A (blue circles, IC50 = 133 ± 6.5 μM). Each data point is an average of 5–10 cells. (Right) Sodium current recordings of NaVAb/WT and NaVAb/T206A in the absence (black) and presence of 10 or 100 μM flecainide (blue) under conditions for resting-state block (SI Appendix, SI Materials and Methods). Pulses were applied from holding potentials of −160 or −140 mV to 0 mV. The vertical and horizontal scale bars represent 0.5 nA and 10 ms, respectively.
Fig. 3.
Fig. 3.
Mutations of F203 alter the size of the fenestrations of NaVAb. (A) Overlay of ribbon diagrams of NaVAb/I217C (cyan), NaVAb/I217C/F203A (green), and NaVAb/I217C/F203W (salmon). (B) S6 segments displayed as in A. (C) The fenestration is shown in side view from the perspective of the membrane bilayer. The protein is displayed with cartoon representation of helices and select sidechains shown as sticks with the NaVAb constructs indicated. Two rotamers (‘up’ and ‘down’) are shown for NaVAb/I217C/F203W. (D) Analysis of solvent-accessible space in the fenestration (tan) computed by MOLE for the indicated NaVAb constructs. Each fenestration and associated solvent-accessible space is shown in side view, but with 90° rotation around the vertical axis with respect to C.
Fig. 4.
Fig. 4.
Resting-state block of NaVAb/WT, NaVAb/F203A, and NaVAb/F203W by flecainide. (A) Use-dependent inactivation of NavAb/WT in response to 30-ms repetitive pulses applied at 10 Hz (gray) or 20 Hz (black) from a holding potential of −160 mV to −20 mV. Insets, example sodium currents. (The vertical and horizontal scale bars represent 0.5 nA and 10 ms, respectively.) (B) Use-dependent block of NavAb/WT in response to 30-ms repetitive pulses applied at 10 Hz (red) or 20 Hz (blue) from a holding potential of −160 mV to −20 mV in the presence of 10 μM flecainide. Insets, example sodium currents. (The vertical and horizontal scale bars represent 0.5 nA and 10 ms, respectively.) (C) Concentration-response curves for flecainide inhibition of NavAb/WT (black, IC50 = 7.2 ± 0.4 μM), NavAb/F203W (red, IC50 = 46 ± 2 μM), and NaVAb/F203A (gray, IC50 = 0.9 ± 0.01 μM).
Fig. 5.
Fig. 5.
Resting-state block of NaVAb/WT, NaVAb/F203W, and NaVAb/F203A by lidocaine. (A) Sodium current recordings of NaVAb/WT in the absence (black) and presence of the indicated concentrations of lidocaine (red). Current traces resulted from pulses applied from a holding potential of −160 mV to a test pulse = 0 mV. The vertical and horizontal scale bars represent 0.2 nA and 10 ms, respectively. (B) Concentration-response curves for lidocaine inhibition of NavAb/WT (black, IC50 = 135 ± 20 μM), NavAb/F203W (red, IC50 = 458 ± 9 μM), and NaVAb/F203A (gray, IC50 = 135 ± 2 μM). Each data point is an average of 4–9 cells.
Fig. 6.
Fig. 6.
Resting-state block of NaVAb/WT, NaVAb/F203W, and NaVAb/F203A by benzocaine. (A) Sodium current recordings of NaVAb/WT in the absence (black) and presence of the indicated concentrations of benzocaine (blue). Current traces resulted from pulses applied from a holding potential of −160 mV to a test pulse of 0 mV. The vertical and horizontal scale bars represent 0.5 nA and 10 ms, respectively. (B) Concentration-response curves for benzocaine inhibition of NavAb/WT (black, IC50 = 254 ± 37 μM), NavAb/F203W (red, IC50 = 739 ± 38 μM), and NaVAb/F203A (gray, IC50 = 279 ± 3 μM), bottom. Each data point is an average of 4–9 cells.

References

    1. Hille B. Ionic Channels of Excitable Membranes. 3rd Ed Sinauer Associates Inc.; Sunderland, MA: 2001.
    1. Catterall WA. From ionic currents to molecular mechanisms: The structure and function of voltage-gated sodium channels. Neuron. 2000;26:13–25. - PubMed
    1. Catterall WA, Zheng N. Deciphering voltage-gated Na+ and Ca2+ channels by studying prokaryotic ancestors. Trends Biochem Sci. 2015;40:526–534. - PMC - PubMed
    1. Catterall WA. Sodium channels, inherited epilepsy, and antiepileptic drugs. Annu Rev Pharmacol Toxicol. 2014;54:317–338. - PubMed
    1. Dib-Hajj SD, Cummins TR, Black JA, Waxman SG. Sodium channels in normal and pathological pain. Annu Rev Neurosci. 2010;33:325–347. - PubMed

Publication types

MeSH terms

LinkOut - more resources