. 2019 Jan 23;39(4):758-772.
doi: 10.1523/JNEUROSCI.1873-18.2018. Epub 2018 Dec 5.

Alzheimer's Disease Risk Factor Pyk2 Mediates Amyloid-β-Induced Synaptic Dysfunction and Loss

Affiliations

Alzheimer's Disease Risk Factor Pyk2 Mediates Amyloid-β-Induced Synaptic Dysfunction and Loss

Santiago V Salazar et al. J Neurosci. .

Abstract

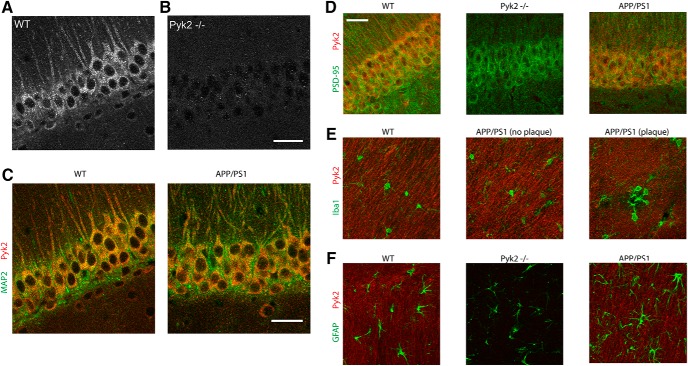
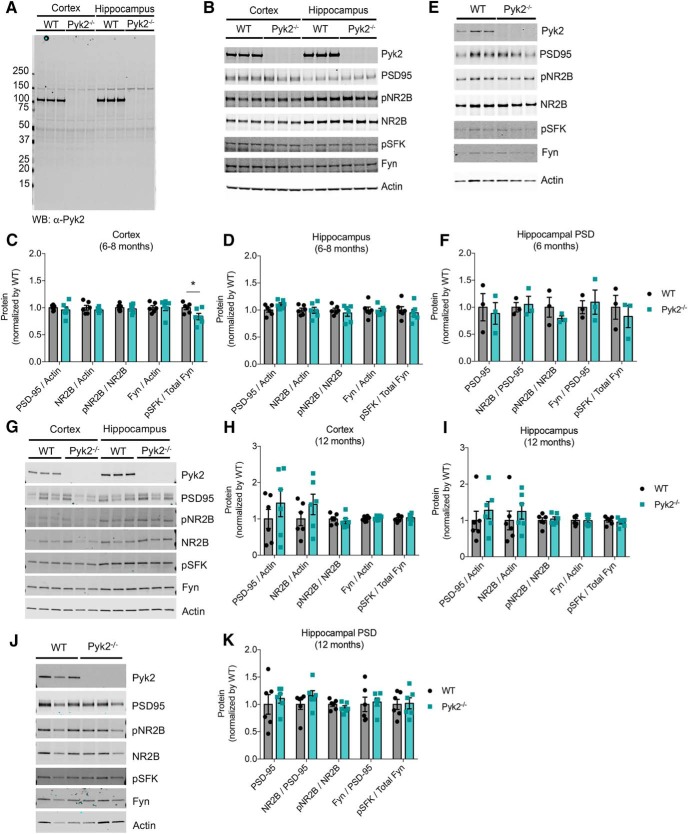
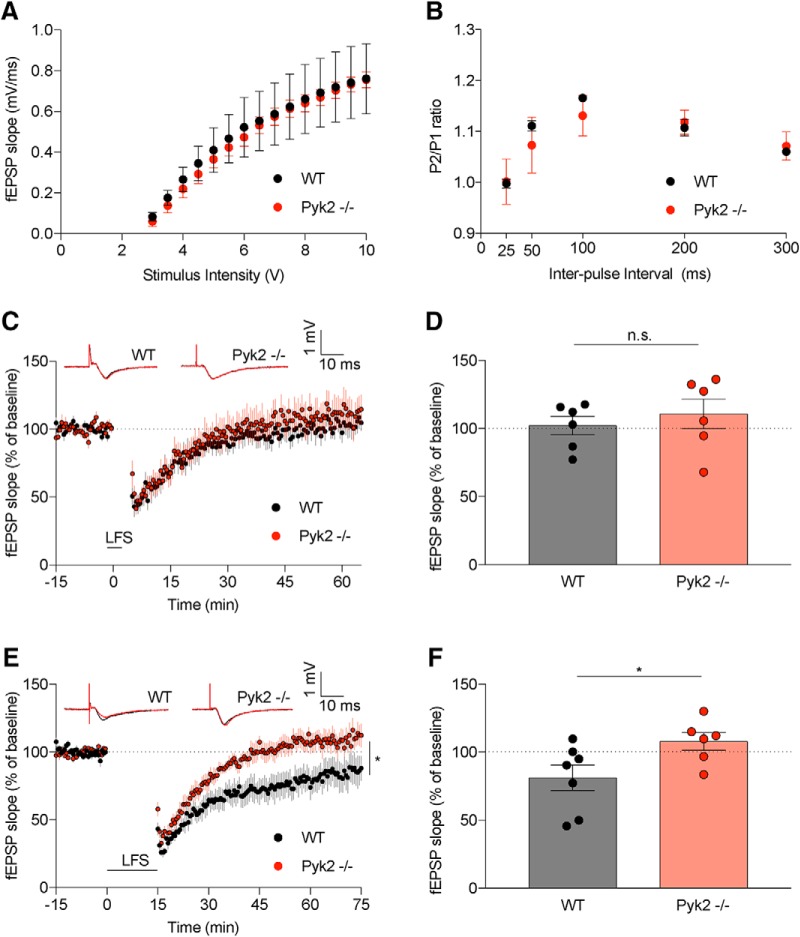
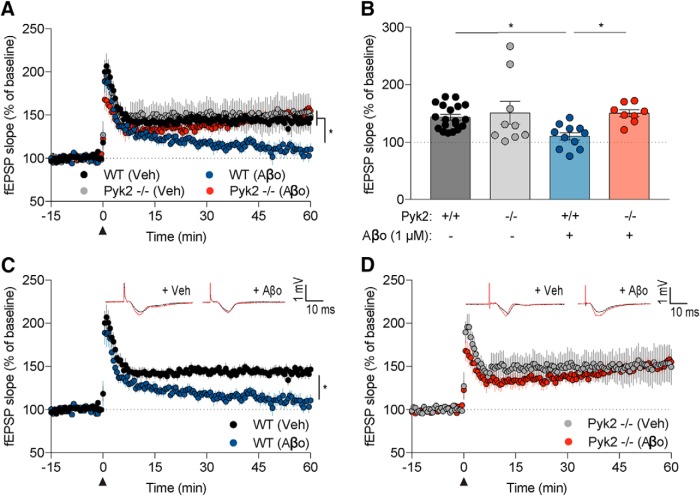
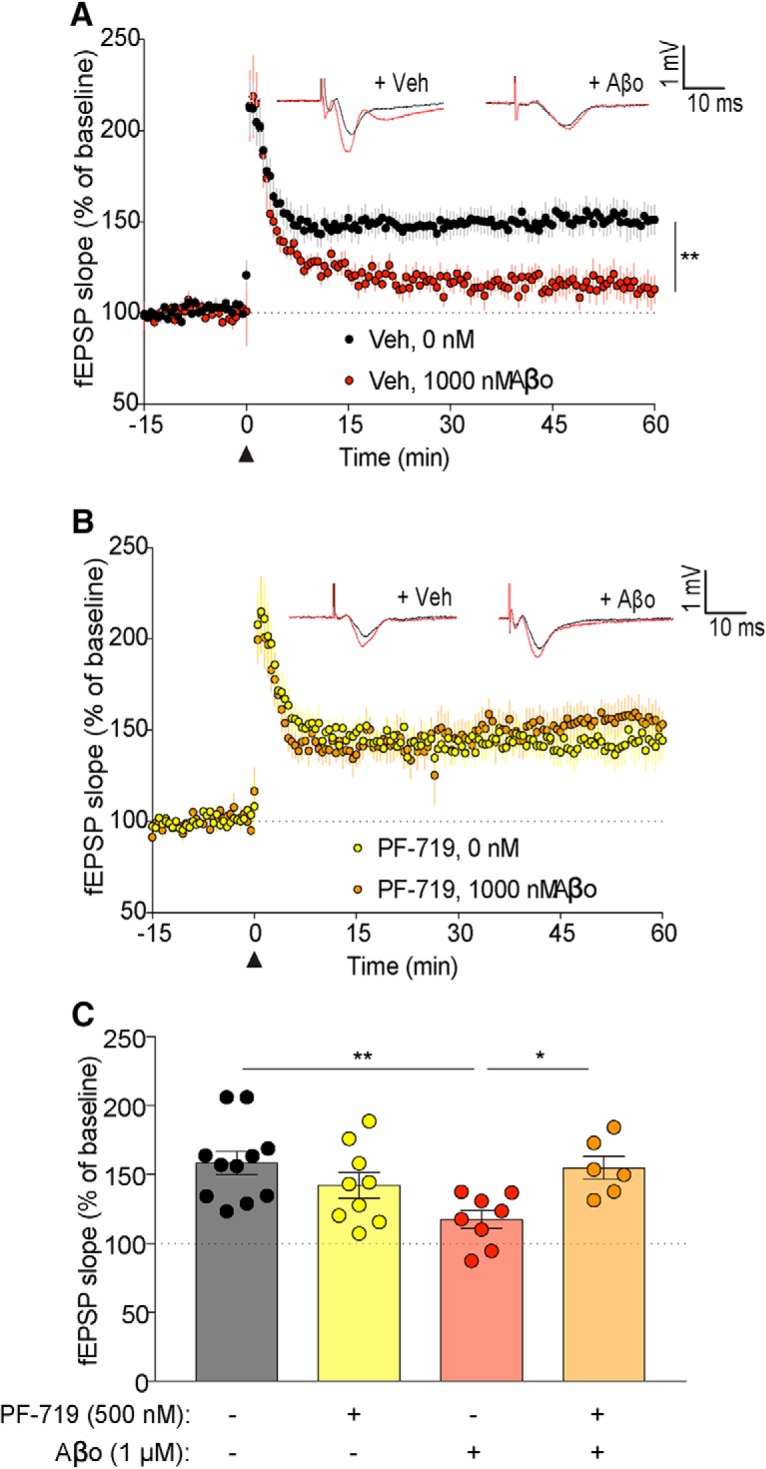
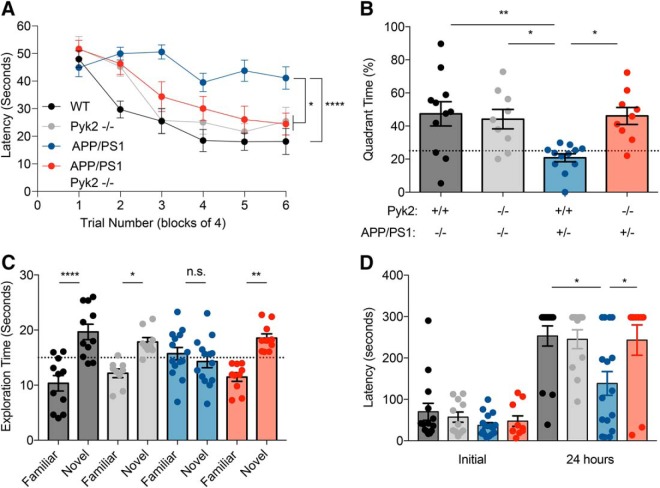
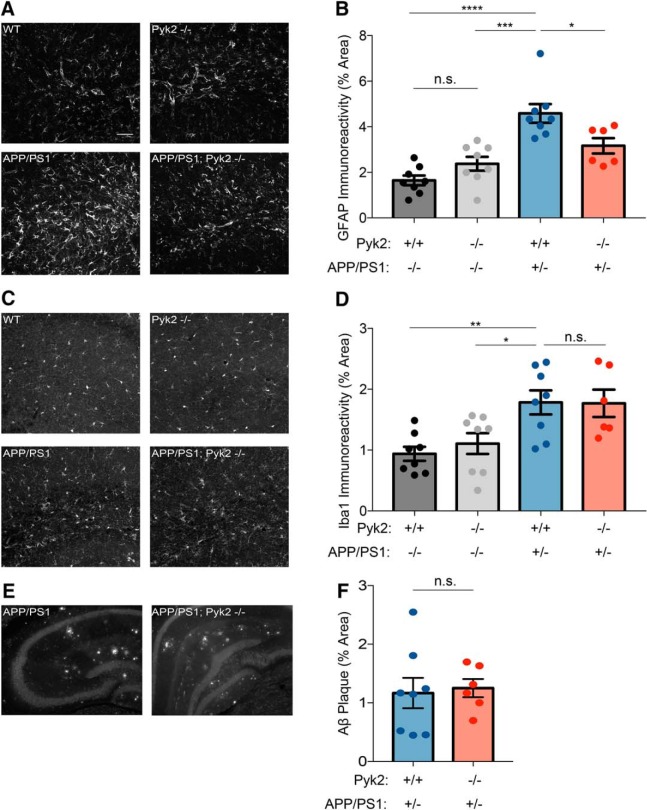
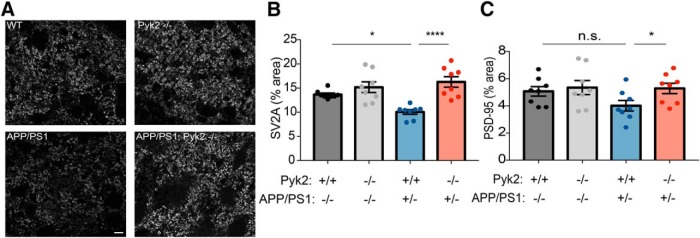
Dozens of genes have been implicated in late onset Alzheimer's disease (AD) risk, but none has a defined mechanism of action in neurons. Here, we show that the risk factor Pyk2 (PTK2B) localizes specifically to neurons in adult brain. Absence of Pyk2 has no major effect on synapse formation or the basal parameters of synaptic transmission in the hippocampal Schaffer collateral pathway. However, the induction of synaptic LTD is suppressed in Pyk2-null slices. In contrast, deletion of Pyk2 expression does not alter LTP under control conditions. Of relevance for AD pathophysiology, Pyk2-/- slices are protected from amyloid-β-oligomer (Aβo)-induced suppression of LTP in hippocampal slices. Acutely, a Pyk2 kinase inhibitor also prevents Aβo-induced suppression of LTP in WT slices. Female and male transgenic AD model mice expressing APPswe/PSEN1ΔE9 require Pyk2 for age-dependent loss of synaptic markers and for impairment of learning and memory. However, absence of Pyk2 does not alter Aβ accumulation or gliosis. Therefore, the Pyk2 risk gene is directly implicated in a neuronal Aβo signaling pathway impairing synaptic anatomy and function.SIGNIFICANCE STATEMENT Genetic variation at the Pyk2 (PTK2B) locus is a risk for late onset Alzheimer's disease (AD), but the pathophysiological role of Pyk2 is not clear. Here, we studied Pyk2 neuronal function in mice lacking expression with and without transgenes generating amyloid-β (Aβ) plaque pathology. Pyk2 is not required for basal synaptic transmission or LTP, but participates in LTD. Hippocampal slices lacking Pyk2 are protected from AD-related Aβ oligomer suppression of synaptic plasticity. In transgenic AD model mice, deletion of Pyk2 rescues synaptic loss and learning/memory deficits. Therefore, Pyk2 plays a central role in AD-related synaptic dysfunction mediating Aβ-triggered dysfunction.

Keywords: Alzheimer's; Pyk2; amyloid; synapse.


Figures

Figure 1.
Figure 1.
Pyk2 is expressed by neurons. A, B, Representative immunofluorescent images of Pyk2 immunoreactivity from hippocampal CA1 in WT and Pyk2-null mice at 12 months of age. Scale bar, 10 μm. Confocal images were captured using a 63× objective. CF, Immunohistology was performed on age-matched littermate controls from WT, Pyk2−/−, and APP/PS1 mice at 12 months of age. Scale bar, 10 μm. Confocal images were captured using a 63× objective. Representative immunofluorescent images of immunoreactive Pyk2-red (same as A) and MAP2-green in CA1 (C), Pyk2-red and PSD95-green in CA1 (D), Pyk2-red and Iba1-green in the stratum radiatum (E), and Pyk2-red and GFAP-green in the stratum radiatum (F).
Figure 2.
Figure 2.
Normal synaptic markers in Pyk2−/− mice. A, Pyk2 expression in WT and Pyk2−/− mice forebrains. Lysates (1% Triton X-100, 150 mm NaCl, 50 mm Tris, protease and phosphatase inhibitor cocktails) from 6-month-old WT and Pyk2−/− mice forebrains were subjected to immunoblotting with anti-Pyk2 antibody, which recognize N terminus region (∼1–100 aa) of Pyk2. There is no full-length or truncated protein in the null mice. BD, Synaptic protein expression profile in cortex and hippocampus from 6- to 8-month-old WT and Pyk2−/− mice. Syn-PER and 1% Triton X-100 insoluble cortex and hippocampus crude synaptosome pellets (P2′) were resolubilized in 1% SDS and immunoblotted with anti-Pyk2, anti-PSD-95, anti-pNR2B (pY1472), anti-NR2B, anti-pSFK, anti-Fyn, and anti-actin specific antibodies. Quantification of protein levels by densitometric analysis in cortex (C) and hippocampus (D). Cortical levels of pSFK/Fyn were significantly reduced in Pyk2−/− mice (n = 6, p = 0.038). Protein levels were normalized to WT values. Data are graphed as mean ± SEM (n = 6 mice). *p < 0.05, unpaired two-tailed t test. E, F, Synaptic protein expression profile in hippocampal PSD fraction of 6- to 8-month-old WT and Pyk2−/− mice. PSD fraction (20 μg of protein) was subjected to immunoblotting with indicated antibodies (E) and quantified by densitometric analysis (F). Protein levels were normalized to WT values. Data are graphed as mean ± SEM (n = 3 mice). GI, Synaptic protein expression profile in cortex and hippocampus from 12-month-old WT and Pyk2−/− mice. Quantification of protein levels by densitometric analysis in cortex (H) and hippocampus (I). Protein levels were normalized to WT values. Data are graphed as mean ± SEM (n = 6 mice). For cortical pSFK/Fyn, n = 5 mice. J, K, Synaptic protein expression profile in hippocampal PSD fraction of 12-month-old WT and Pyk2−/− mice. PSD fraction (2.25 μg of protein) subjected to immunoblotting with indicated antibodies (J) and quantified by densitometric analysis (K). Protein levels were normalized to WT values. Data are graphed as mean ± SEM (n = 6 mice). For C, D, F, H, I, and K, all comparisons were nonsignificant by unpaired two-tailed t test unless otherwise specified (p > 0.05). For details, see Table 1.
Figure 3.
Figure 3.
Pyk2 mediates LTD in the CA1 of hippocampal slices. fEPSPs were recorded from the CA3–CA1 circuit in slices of mouse hippocampus from 2- to 6-month-old mice. A, Input/output (I/O) responses were graphed as fEPSPs (mV/ms) with respect to stimulus intensity (V) at 40 μs duration. We observed no change in baseline synaptic transmission from WT (9 slices from n = 3 mice) and Pyk2−/− (9 slice from n = 3 mice) slices by two-way ANOVA with Sidak's multiple-comparisons test (p > 0.9999 for all comparisons). Data are analyzed and graphed as mean ± SEM, where each n reflects one mouse with data from multiple slices averaged to a single value per mouse. B, Paired-pulse ratios (fEPSP2slope/fEPSP1slope) in WT (9 slices from n = 3 mice) and Pyk2−/− (9 slices from n = 3 mice) slices were not significantly different by two-way ANOVA with Sidak's multiple-comparisons test (25 ms p > 0.9999, 50 ms p = 0.8975, 100 ms p = 0.9263, 200 ms p = 0.9996, and 300 ms p = 0.9996). Statistics were calculated using per-animal data. C, Acute brain slices from WT or Pyk2−/− mice were used to record fEPSPs from the CA3–CA1 hippocampal circuit. The slope of the fEPSPs is plotted as a function of time. Representative traces before a 5 min LFS in black (black arrowhead at time = 0) and at 60 min after LFS in red are superimposed (average, 6 sweeps). D, WT (8 slices from n = 6 mice) slices did not show a significant difference in fEPSP during the last 20 min of recording compared with Pyk2−/− slices (7 slices from n = 6 mice). Data are graphed as mean ± SEM, unpaired two-tailed t test. Statistics were calculated using per-animal data. E, Similar to C, hippocampal slices were used to record fEPSPs. Representative traces before a 15 min LFS in black (black arrowhead at time = 0) and at 60 min after LFS in red are superimposed (average, 6 sweeps). F, WT (13 slices from n = 7 mice) slices displayed a significant decrease in fEPSP during the last 20 min of recording compared with Pyk2−/− slices (12 slices from n = 6 mice). Data are graphed as mean ± SEM, unpaired two-tailed t test. All statistics were calculated using per-animal average data. *p < 0.05. For details, see Table 1.
Figure 4.
Figure 4.
Pyk2 mediates Aβo-dependent deficit in LTP. A, C, D, Acute brain slices from 2- to 6-month-old WT or Pyk2−/− mice were treated with vehicle or Aβo and used to record fEPSPs from the CA3–CA1 hippocampal circuit. The slope of the fEPSPs is plotted as a function of time. Representative traces before TBS in black (black arrowhead at time = 0) and at 60 min after TBS in red are superimposed (average, 6 sweeps) in the respective graphs. Data are graphed as mean ± SEM, where each n reflects one mouse with multiple slices averaged to a single value per mouse. Slices were treated with vehicle (F12 without: glutamate, glycine, and phenol red) or Aβo (1 μm monomer, 10 nm oligomer estimate) for 30 min before TBS. B, WT slices treated with Aβo (13 slices from n = 11 mice) showed a significant decrease in fEPSP compared with WT slices treated with vehicle (22 slices from n = 19 mice), Pyk2−/− slice treated with vehicle (11 slices from n = 9 mice), or Pyk2−/− slices treated with Aβo (10 slices from n = 8 mice) in the last 15 min of recording. Data are graphed as mean ± SEM, one-way ANOVA with Tukey's multiple-comparisons test. All statistics were calculated using per-animal average data. *p < 0.05. For details, see Table 1.
Figure 5.
Figure 5.
Aβo-dependent deficits in LTP are fully rescued by PF-719. AC, Acute brain slices from WT 2- to 6-month-old mice were pretreated with vehicle or PF-719 (500 nm) for 30 min before treatment with vehicle or Aβo and used to record fEPSPs from the CA3–CA1 hippocampal circuit. The slope of the fEPSPs is plotted as a function of time. Representative traces before TBS in black (black arrowhead at time = 0) and at 60 min after TBS in red are superimposed (average, 6 sweeps) in the respective graphs. Data are graphed as mean ± SEM, where each n reflects one mouse with multiple slice averaged to a single value per mouse. A, C, WT slices treated with Aβo (8 slices from n = 8 mice) showed a significant decrease in fEPSP compared with WT slices treated with vehicle (11 slices from n = 11 mice) in the last 15 min of recording. Data are graphed as mean ± SEM, n = 1 slice, one-way ANOVA with Tukey's multiple-comparisons test: **p < 0.01. B, C, fEPSPs from WT slices pretreated with PF-719 and subsequently treated with Aβo (6 slices from n = 6 mice) were not significantly different from WT slices pretreated with PF-719 and subsequently treated with vehicle (9 slices from n = 9 mice) during the last 15 min of recording. Data are graphed as mean ± SEM, one-way ANOVA with Tukey's multiple-comparisons test. C, Quantification of the last 15 min of recording was compared between groups. Data are graphed as mean ± SEM, one-way ANOVA with Tukey's multiple-comparisons test: *p < 0.05, **p < 0.01. For details, see Table 1.
Figure 6.
Figure 6.
Pyk2 mediates learning and memory deficits in APP/PS1 mice. A, Twelve-month-old mice and age-matched litter mate controls were subjected to the MWM test. Latency was calculated as the time to find the hidden platform across six blocks of four trials. APP/PS1 mice (n = 12) took significantly more time to find the hidden platform compared with WT (n = 11, p < 0.0001), Pyk2−/− (n = 9, p = 0.0227), or APP/PS1;Pyk2−/− mice (n = 9, p = 0.0137). Data are graphed as mean ± SEM, two-way repeated-measures ANOVA with Tukey's multiple-comparisons test: *p < 0.05, ****p < 0.0001. B, The probe trial was performed 24 h after the sixth forward swim trial block by removing the hidden platform. Quadrant time (%) is calculated as the percentage time spent in the target quadrant in 1 min. APP/PS1 (n = 12) mice spend significantly less time in the target quadrant compared with WT (n = 11, p = 0.0039), Pyk2−/− (n = 9, p = 0.0201), or APP/PS1;Pyk2−/− mice (n = 9, p = 0.0105). Data are graphed as mean ± SEM, one-way ANOVA with Tukey's multiple-comparisons test: *p < 0.05, **p < 0.01. C, Mice were subjected to the NOR test by familiarizing them to an object and subsequently allowed to explore a novel object and familiar 1 h after exposure to the familiar object. APP/PS1 mice (n = 14, p = 0.9705) did not display a preference for either familiar or novel object compared with WT (n = 11, p < 0.0001), Pyk2−/− (n = 9, p = 0.0336), and APP/PS1;Pyk2−/− mice (n = 10, p = 0.0014), which spent significantly more time with the novel object. Data are graphed as mean ± SEM, two-way ANOVA with Tukey's multiple-comparisons test: *p < 0.05, **p < 0.01, ****p < 0.0001. D, Mice were subjected to PAT and latency to enter the dark chamber was measured initially and 24 h after receiving a mild foot shock in the dark chamber. APP/PS1 mice (n = 16) reentered the dark chamber significantly more rapidly compared with WT (n = 14, p = 0.0010), Pyk2−/− (n = 11, p = 0.0053), or APP/PS1;Pyk2−/− mice (n = 10, p = 0.0089). Data are graphed as mean ± SEM, two-way ANOVA with Tukey's multiple-comparisons test: *p < 0.05, **p < 0.01. For details, see Table 1.
Figure 7.
Figure 7.
Deletion of Pyk2 limits astrocytosis but has no effect on microgliosis or Aβ plaque burden. A, Representative immunofluorescent images of anti-GFAP staining in the hippocampus for the indicated genotypes. Scale bar, 50 μm. B, Quantification of percentage area immunoreactive for the astrocyte marker GFAP using an anti-GFAP antibody. APP/PS1 (n = 8 animals) mice have significantly more GFAP-immunoreactive percentage area compared with WT (n = 8, p < 0.0001) and Pyk2−/− (n = 8, p = 0.0002) mice, whereas APP/PS1;Pyk2−/− (n = 6, p = 0.0316) mice have significantly less immunoreactive percentage area than APP/PS1 mice but significantly more than WT mice (p = 0.0198). Data are graphed as mean ± SEM, where each n reflects one mouse (with three 40 μm sections averaged to a single value per mouse), one-way ANOVA with Tukey's multiple-comparisons test: *p < 0.05, ***p < 0.001, ****p < 0.0001. C, Representative immunofluorescent images of Iba1 in the hippocampus for the indicated genotypes. D, Quantification of percentage area immunoreactive for the microglial marker Iba1 using an anti-Iba1 antibody. APP/PS1 (n = 8) mice have significantly more Iba1-immunoreactive percentage area compared with WT (n = 8, p = 0.0090) and Pyk2−/− (n = 8, p = 0.0455) mice. Data are graphed as mean ± SEM, where each n reflects one mouse (with three 40 μm sections averaged to a single value per mouse), one-way ANOVA with Tukey's multiple-comparisons test: *p < 0.05, **p < 0.01. E, Representative immunofluorescent images of immunoreactive Aβ in the hippocampus for the indicated genotypes. Scale bar, 200 μm. F, Quantification of percentage area immunoreactive for Aβ using an anti-Aβ antibody. APP/PS1 (n = 8) and APP/PS1;Pyk2−/− (n = 6) mice do not have significantly different Aβ-immunoreactive percentage area (p = 0.8024). Data are graphed as mean ± SEM, where each n reflects one mouse (with three 40 μm sections averaged to a single value per mouse); Unpaired two-tailed t test. For details, see Table 1.
Figure 8.
Figure 8.
Pyk2 mediates synapse loss in APP/PS1 mice A, Representative immunofluorescent images of immunoreactive SV2A in the mouse dentate gyrus for the indicated genotypes at 12 months of age. Scale bar, 10 μm. B, Quantification of percentage area immunoreactive for SV2A using an anti-SV2A antibody. WT mice (n = 8, p = 0.0222), Pyk2−/− mice (n = 8, p = 0.0008), and APP/PS1;Pyk2−/− (n = 8, p < 0.0001) mice have significantly higher SV2A-immunoreactive percentage area compared with APP/PS1 mice (n = 8). Data are graphed as mean ± SEM, where each n reflects one mouse (with three 40 μm sections averaged to a single value per mouse), one-way ANOVA with Tukey's multiple-comparisons test: *p < 0.05, ****p < 0.0001. C, Quantification of percentage area immunoreactive for PSD-95 using an anti-PSD-95 antibody. Pyk2−/− (n = 8, p = 0.0308) and APP/PS1;Pyk2−/− (n = 8, p = 0.0388) mice have significantly higher PSD-95-immunoreactive percentage area compared with APP/PS1 mice (n = 8), with WT (n = 8, p = 0.0831) mice displaying a modest increase in PSD-95 immunoreactivity compared with APP/PS1 mice. Data are graphed as mean ± SEM, where each n reflects one mouse (with three 40 μm sections averaged to a single value per mouse), one-way ANOVA with Holm–Sidak's multiple-comparisons test for the indicated pairs: *p < 0.05. For details, see Table 1.

Similar articles

Cited by

References

    1. Alzheimer's Association (2012) 2012 Alzheimer's disease facts and figures. Alzheimers Dement 8:131–168. 10.1016/j.jalz.2012.02.001 - DOI - PubMed
    1. Andreev J, Galisteo ML, Kranenburg O, Logan SK, Chiu ES, Okigaki M, Cary LA, Moolenaar WH, Schlessinger J (2001) Src and Pyk2 mediate G-protein-coupled receptor activation of epidermal growth factor receptor (EGFR) but are not required for coupling to the mitogen-activated protein (MAP) kinase signaling cascade. J Biol Chem 276:20130–20135. 10.1074/jbc.M102307200 - DOI - PubMed
    1. Bartos JA, Ulrich JD, Li H, Beazely MA, Chen Y, Macdonald JF, Hell JW (2010) Postsynaptic clustering and activation of Pyk2 by PSD-95. J Neurosci 30:449–463. 10.1523/JNEUROSCI.4992-08.2010 - DOI - PMC - PubMed
    1. Chan G, White CC, Winn PA, Cimpean M, Replogle JM, Glick LR, Cuerdon NE, Ryan KJ, Johnson KA, Schneider JA, Bennett DA, Chibnik LB, Sperling RA, Bradshaw EM, De Jager PL (2015) CD33 modulates TREM2: convergence of Alzheimer loci. Nat Neurosci 18:1556–1558. 10.1038/nn.4126 - DOI - PMC - PubMed
    1. Collins M, Bartelt RR, Houtman JC (2010a) T cell receptor activation leads to two distinct phases of Pyk2 activation and actin cytoskeletal rearrangement in human T cells. Mol Immunol 47:1665–1674. 10.1016/j.molimm.2010.03.009 - DOI - PubMed

Publication types

MeSH terms