Clinical Trial
. 2019 Jan 7;216(1):133-151.
doi: 10.1084/jem.20181483. Epub 2018 Dec 5.

A common transcriptomic program acquired in the thymus defines tissue residency of MAIT and NKT subsets

Affiliations
Clinical Trial

A common transcriptomic program acquired in the thymus defines tissue residency of MAIT and NKT subsets

Marion Salou et al. J Exp Med. .

Abstract

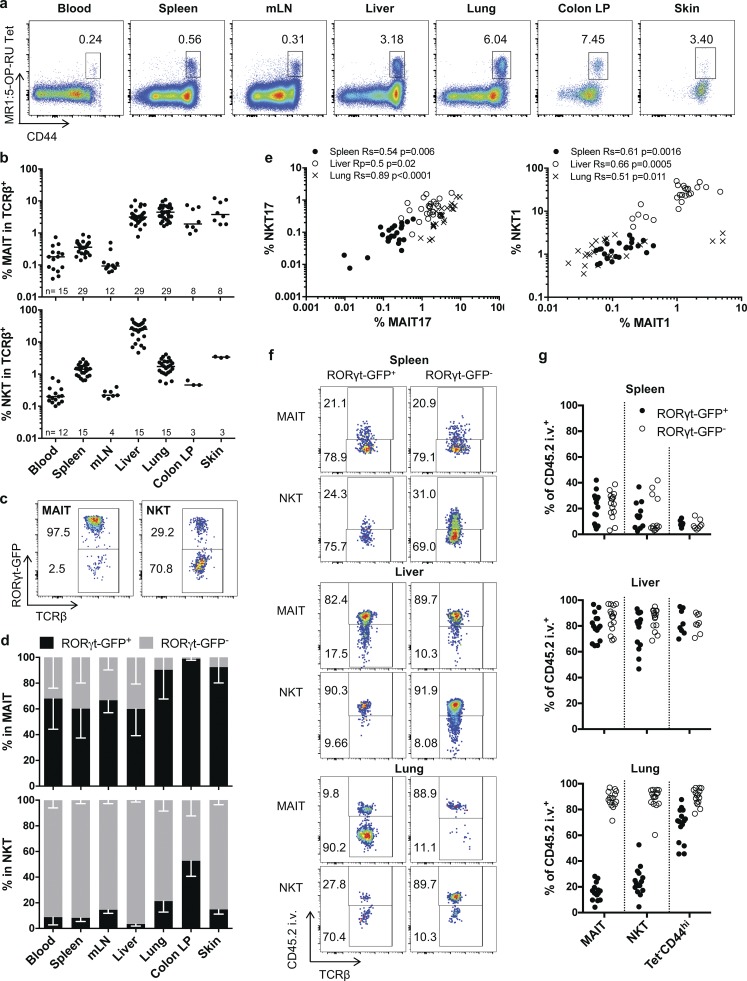
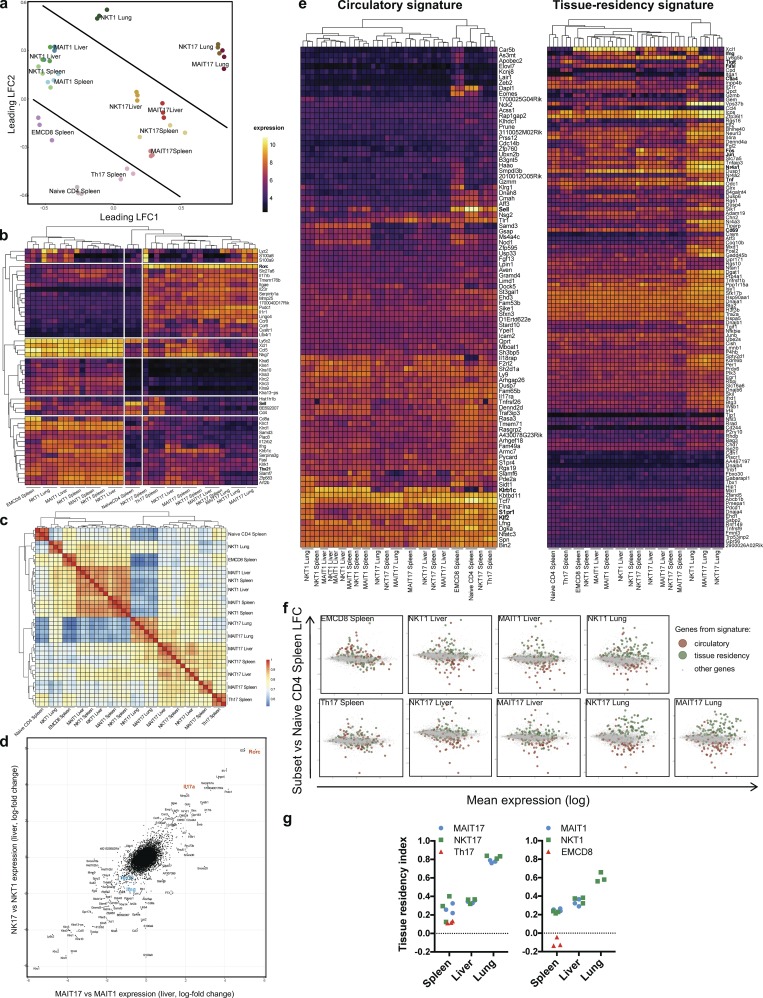
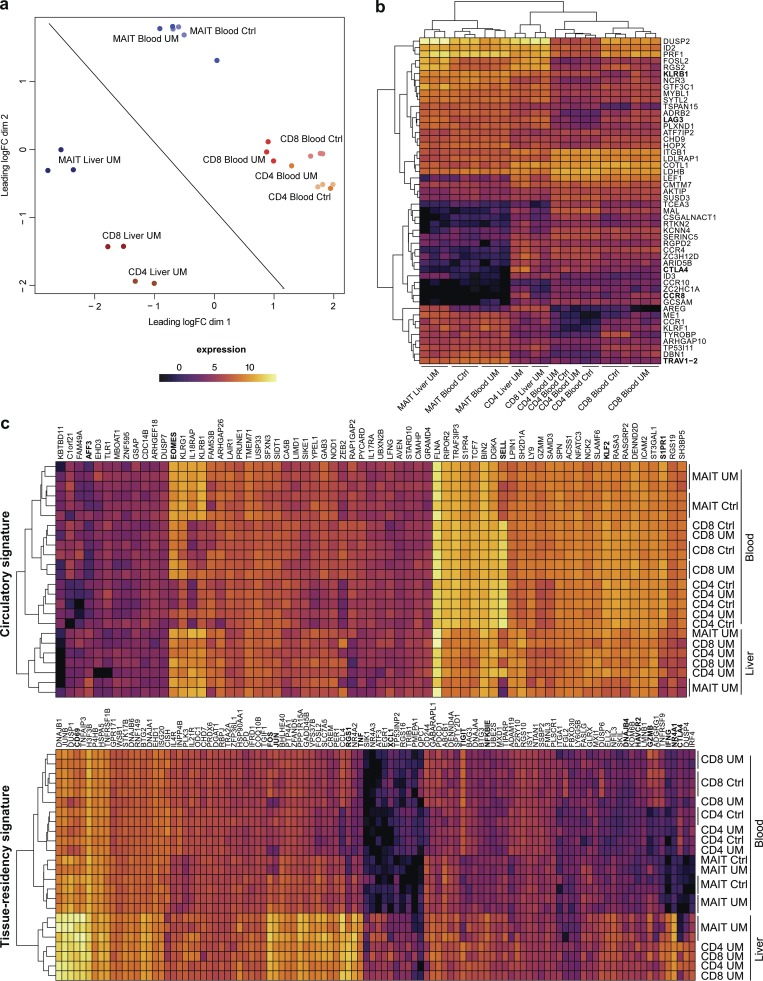
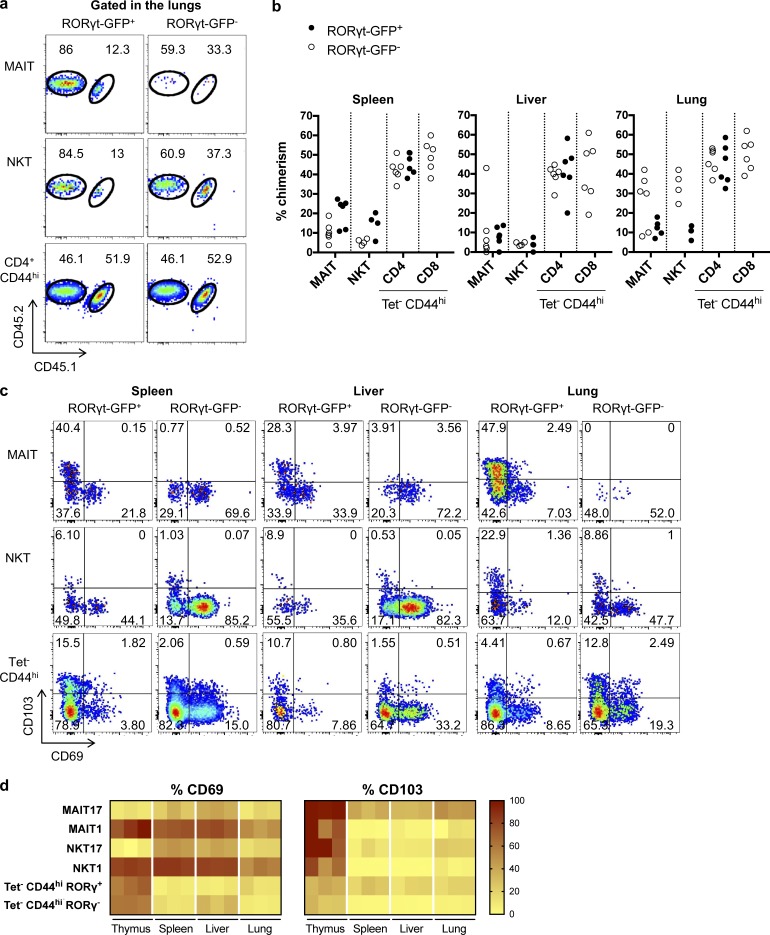
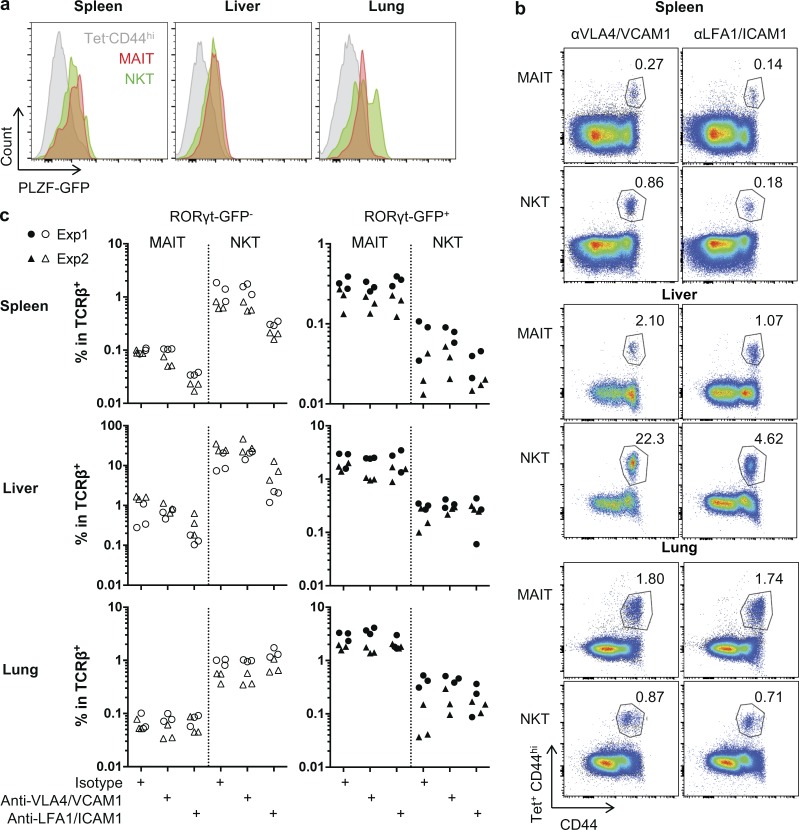
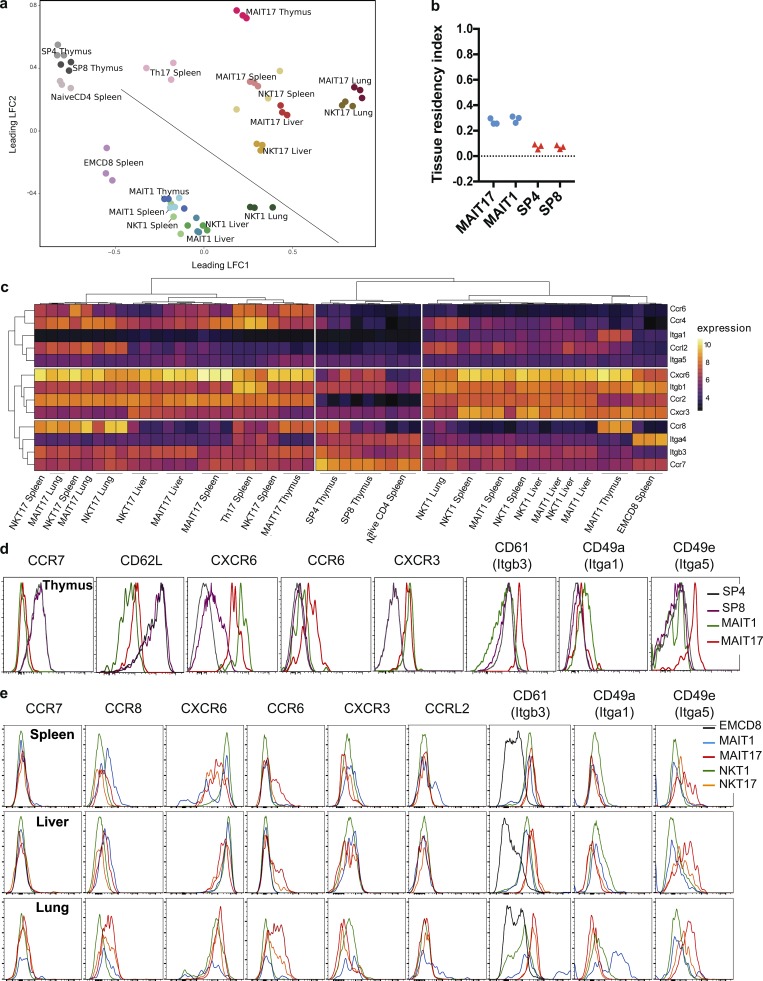
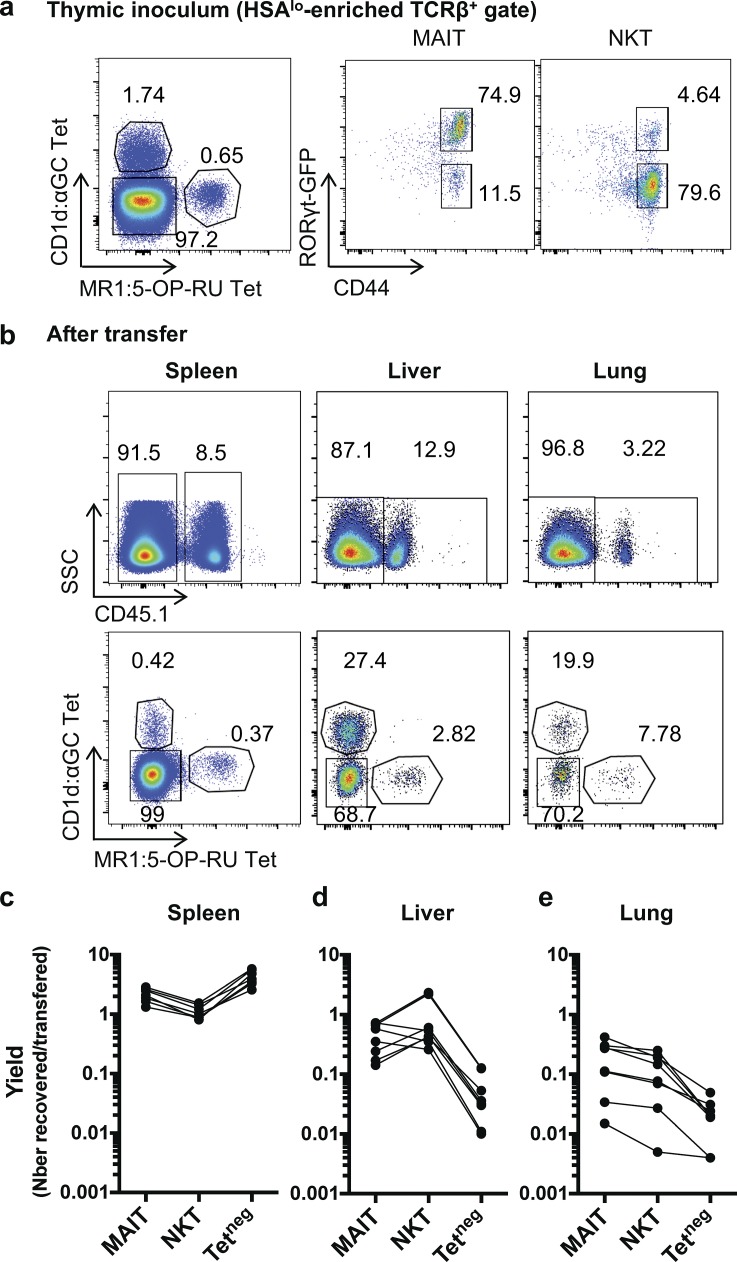
Mucosal-associated invariant T (MAIT) cells are abundant T cells with unique specificity for microbial metabolites. MAIT conservation along evolution indicates important functions, but their low frequency in mice has hampered their detailed characterization. Here, we performed the first transcriptomic analysis of murine MAIT cells. MAIT1 (RORγtneg) and MAIT17 (RORγt+) subsets were markedly distinct from mainstream T cells, but quasi-identical to NKT1 and NKT17 subsets. The expression of similar programs was further supported by strong correlations of MAIT and NKT frequencies in various organs. In both mice and humans, MAIT subsets expressed gene signatures associated with tissue residency. Accordingly, parabiosis experiments demonstrated that MAIT and NKT cells are resident in the spleen, liver, and lungs, with LFA1/ICAM1 interactions controlling MAIT1 and NKT1 retention in spleen and liver. The transcriptional program associated with tissue residency was already expressed in thymus, as confirmed by adoptive transfer experiments. Altogether, shared thymic differentiation processes generate "preset" NKT and MAIT subsets with defined effector functions, associated with specific positioning into tissues.


Figures

Figure 1.
Figure 1.
Phenotype and tissue distribution of MAIT subsets in RORγt-GfpTG B6-MAITCAST mice. (a) Representative CD44/MR1:5-OP-RU tetramer staining of TCRβ+ T cells in the indicated organs. (b) Quantification of MAIT (MR1:5-OP-RU Tet+CD44hi) or NKT (CD1d:PBS57 Tet+CD44hi) cells in TCRβ+ cells. Bar represents the median (n = 3–29 mice; at least three independent experiments, except for skin NKT cells). (c) Example of RORγt-GFP expression by NKT and MAIT cells in the lungs. (d) Proportion of MAIT (top) and NKT (bottom) cells expressing RORγt-GFP, in the same samples as in b. Mean with SD is represented. (e) Correlation between type 17 and type 1 MAIT/NKT subset frequencies in different organs (n = 24 mice in eight independent experiments). (f and g) Intra- or extravascular location of MAIT and NKT cell subsets: representative in vivo intravenous anti-CD45 staining (f) and quantification (g) on MAIT, NKT, and memory T cells (TCRβ+ MR1:5-OP-RU Tet CD1d:PBS57 Tet CD44hi) RORγt-GFP+ and RORγt-GFPneg subsets in the indicated organs (n = 8–15 mice in at least three independent experiments).
Figure 2.
Figure 2.
NKT and MAIT subsets share a similar transcriptional program associated to tissue residency in peripheral organs. Gene expression of FACS-sorted subsets of MAIT, NKT, and conventional T cells was evaluated by microarray (Affymetrix) in triplicates (each replicate from pooled mice). (a) MDS scatter plot based on the 10% most variable transcripts, summarizing the euclidean distances between the cell subsets. (b) Heat map and unsupervised hierarchical clustering based on the expression of the top 50 most variable genes between samples. (c) Heat map representation and hierarchical clustering based on a correlation matrix (Pearson coefficient) from the gene expression values. (d) Scatter plot of gene expression ratios (lfc) of the type 17 and type 1 subsets in the liver illustrating the relationships between NKT and MAIT subsets. (e) Heat map and hierarchical clustering showing the expression level of genes associated to circulatory and tissue residency signatures (from Milner et al., 2017). Numerical values are depicted in Table S3. (f) Mean-difference scatter plots showing the expression ratio (lfc) of genes associated to the circulatory and tissue residency Runx3 signatures, as compared with naive CD4+ T cells. (g) Tissue residency index (see Materials and methods) evaluated in the different cell subsets.
Figure 3.
Figure 3.
Human MAIT cells express a tissue residency signature in the liver. (a) MDS scatter plot of gene expression by MAIT subsets as compared to conventional subsets in liver and blood. (b) Heat map and unsupervised hierarchical clustering based on the expression of the top 50 differentially expressed genes between blood MAIT and conventional T cells. (c) Heat map displaying expression of the human orthologs of the circulatory and tissue residency Runx3 core gene signature in the human samples.
Figure 4.
Figure 4.
MAIT cells are tissue-resident T cells. (a and b) CD45.1/2-congenically marked animals were linked as parabiotic pairs for 5 wk: example of staining in the lungs (a) and quantification in the indicated organs (b; n = 4–6 mice analyzed from three pairs). (c and d) CD69/CD103 expression by MAIT/NKT subsets as compared with conventional T cells: example of staining (c) and quantification (d; n = 3 mice; representative experiment).
Figure 5.
Figure 5.
LFA1/ICAM1-dependent tissue retention of MAIT1 and NKT1 subsets. (a) PLZF expression by MAIT and NKT cells in the different organs using a GFP-PLZF reporter mouse crossed onto the B6-MAITCast background. (b and c) LFA1/ICAM1-blocking antibodies were injected in vivo 24 h before subset quantification: example of staining (b) and quantification (c; n = 6 mice; two independent experiments).
Figure 6.
Figure 6.
MAIT subsets acquire a tissue targeting program in the thymus. (a) MDS scatter plot summarizing the expression levels of the 10% most variable transcripts in the indicated samples. (b) Tissue residency index (see Materials and methods) evaluated in the different subsets. (c) Heat map displaying the expression of a selected list of chemokine receptors and integrins by thymic subsets. (d and e) Chemokine receptor and integrin protein expression by the different NKT and MAIT cell subsets in the thymus (d) and in the spleen, liver, and lungs (e; n = 3).
Figure 7.
Figure 7.
NKT and MAIT cells from the thymus are more prone to locate to the liver and to the lungs than conventional T cells. Mature enriched (HSAlow) CD45.1+ thymocytes were transferred into CD45.2+ hosts, and the indicated organs were analyzed 36 h later for NKT (CD1d:PBS57Tet+), MAIT (MR1:5-OP-RU Tet+), and conventional T cell numbers. (a) example of staining of the inoculum (HSAhi-depleted thymocytes). (b) Examples of staining in the indicated organs after transfer. (c–e) Yield (no. recovered/no. injected cells) of the indicated subsets in the spleen (c), the liver (d), and the lungs (e; n = 6 transferred mice; three independent experiments).

References

    1. Barral P., Sánchez-Niño M.D., van Rooijen N., Cerundolo V., and Batista F.D.. 2012. The location of splenic NKT cells favours their rapid activation by blood-borne antigen. EMBO J. 31:2378–2390. 10.1038/emboj.2012.87 - DOI - PMC - PubMed
    1. Bendelac A., Savage P.B., and Teyton L.. 2007. The biology of NKT cells. Annu. Rev. Immunol. 25:297–336. 10.1146/annurev.immunol.25.022106.141711 - DOI - PubMed
    1. Ben Youssef G., Tourret M., Salou M., Ghazarian L., Houdouin V., Mondot S., Mburu Y., Lambert M., Azarnoush S., Diana J.S., et al. . 2018. Ontogeny of human mucosal-associated invariant T cells and related T cell subsets. J. Exp. Med. 215:459–479. 10.1084/jem.20171739 - DOI - PMC - PubMed
    1. Beura L.K., Mitchell J.S., Thompson E.A., Schenkel J.M., Mohammed J., Wijeyesinghe S., Fonseca R., Burbach B.J., Hickman H.D., Vezys V., et al. . 2018. Intravital mucosal imaging of CD8+ resident memory T cells shows tissue-autonomous recall responses that amplify secondary memory. Nat. Immunol. 19:173–182. 10.1038/s41590-017-0029-3 - DOI - PMC - PubMed
    1. Carvalho B.S., and Irizarry R.A.. 2010. A framework for oligonucleotide microarray preprocessing. Bioinformatics. 26:2363–2367. 10.1093/bioinformatics/btq431 - DOI - PMC - PubMed

Publication types

MeSH terms

Substances