. 2018 Dec 6;3(23):e124928.
doi: 10.1172/jci.insight.124928.

Human bone marrow assessment by single-cell RNA sequencing, mass cytometry, and flow cytometry

Affiliations

Human bone marrow assessment by single-cell RNA sequencing, mass cytometry, and flow cytometry

Karolyn A Oetjen et al. JCI Insight. .

Abstract

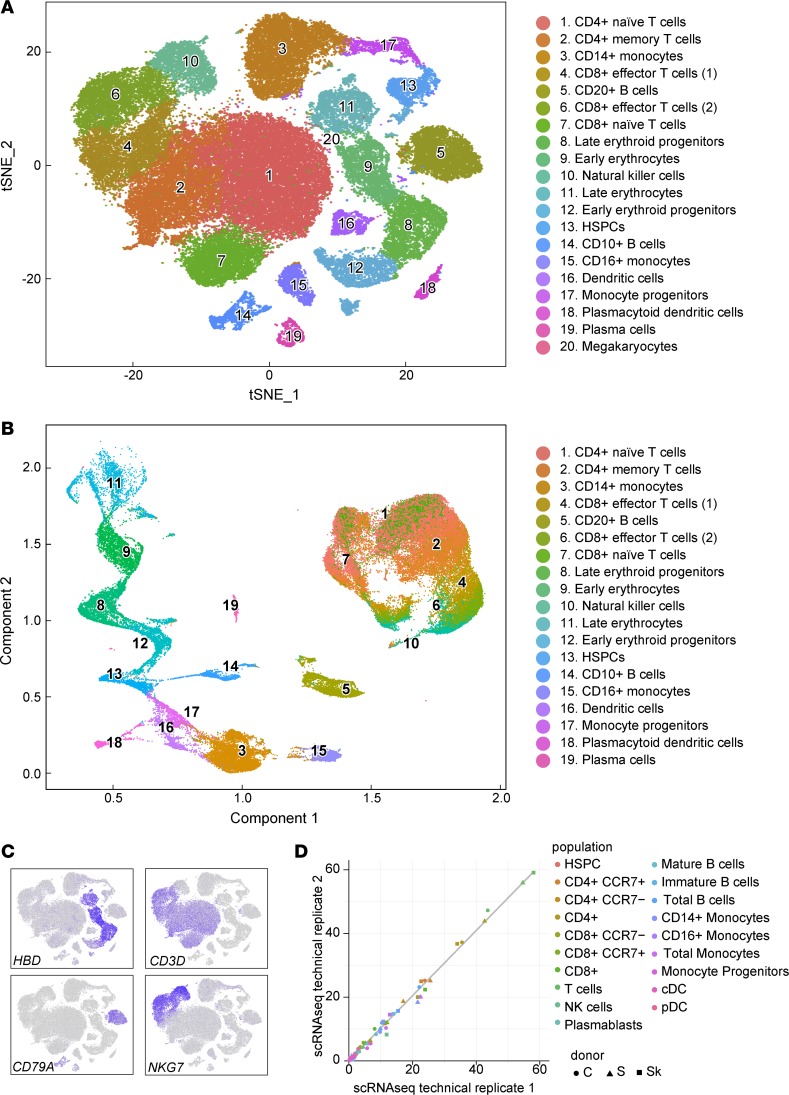
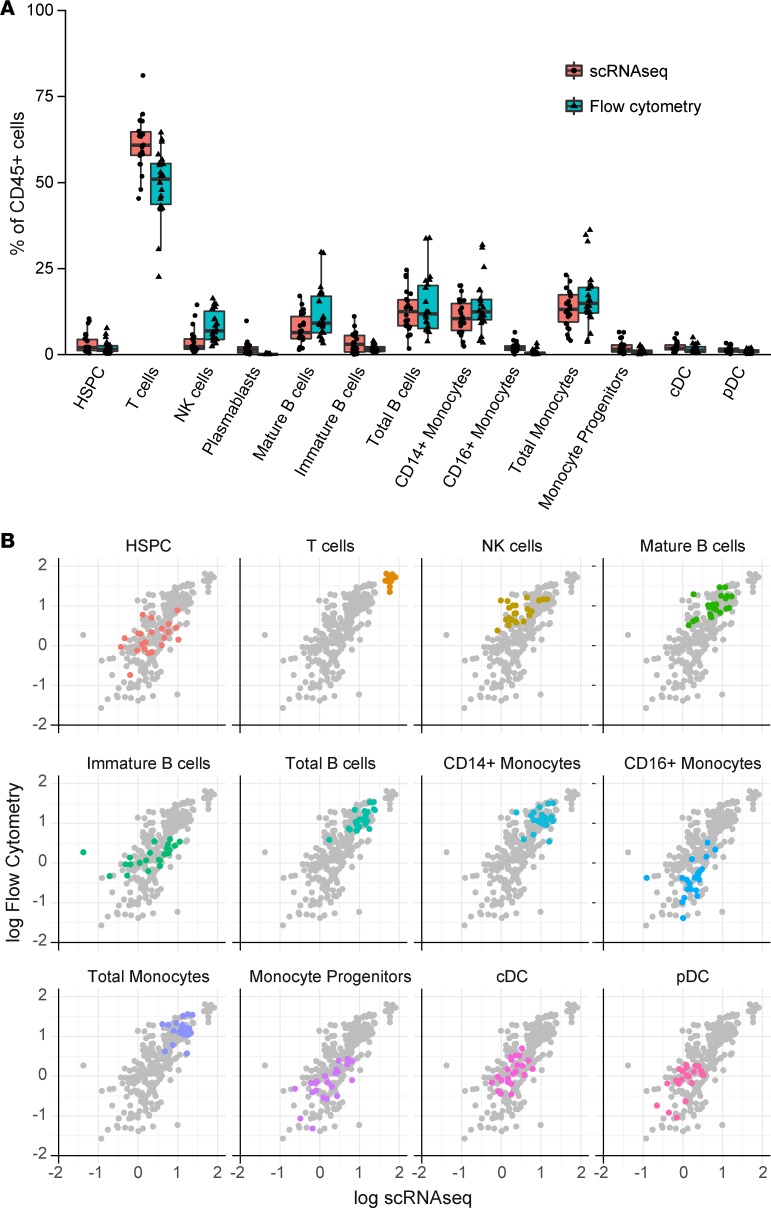
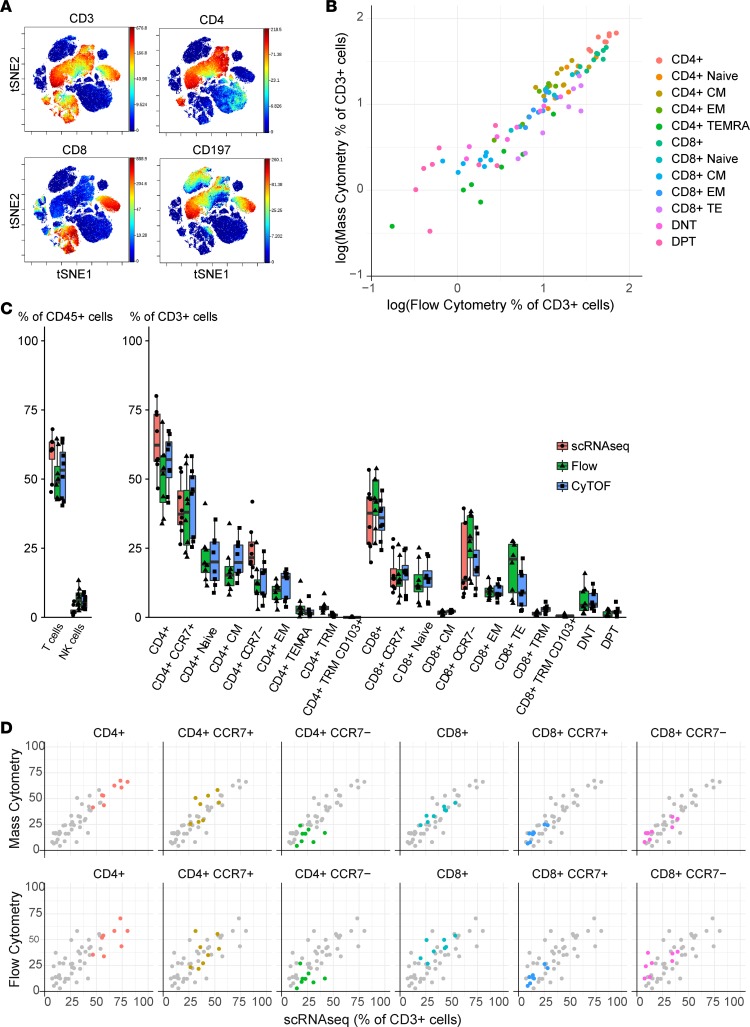
New techniques for single-cell analysis have led to insights into hematopoiesis and the immune system, but the ability of these techniques to cross-validate and reproducibly identify the biological variation in diverse human samples is currently unproven. We therefore performed a comprehensive assessment of human bone marrow cells using both single-cell RNA sequencing and multiparameter flow cytometry from 20 healthy adult human donors across a broad age range. These data characterize variation between healthy donors as well as age-associated changes in cell population frequencies. Direct comparison of techniques revealed discrepancy in the quantification of T lymphocyte and natural killer cell populations. Orthogonal validation of immunophenotyping using mass cytometry demonstrated a strong correlation with flow cytometry. Technical replicates using single-cell RNA sequencing matched robustly, while biological replicates showed variation. Given the increasing use of single-cell technologies in translational research, this resource serves as an important reference data set and highlights opportunities for further refinement.

Keywords: Adaptive immunity; Bone marrow; Bone marrow differentiation; Hematology; Immunology.


Conflict of interest statement

Conflict of interest: CSH receives research funding from Merck Sharpe & Dohme and SELLAS Life Sciences Group AG.

Figures

Figure 1
Figure 1. Single-cell RNA sequencing of healthy bone marrow cells.
(A) Cluster identification visualized using t-SNE. HSPCs: hematopoietic stem/progenitor cells; cDCs: conventional DCs; pDCs: plasmacytoid DCs. (B) Single-cell trajectory analysis using UMAP/Monocle 3. Color is as in (A). (C) Examples of canonical gene expression used for annotation. (D) Reproducibility of technical replicates for single-cell RNA sequencing. Linear regression line displayed in gray.
Figure 2
Figure 2. Comparison of single-cell RNA sequencing and flow cytometry assessment of bone marrow cell type population frequencies from 22 samples (taken from 20 donors, including 2 biological replicates).
(A) Frequencies for major cell populations in human bone marrow shown for single cell scRNA-Seq and flow cytometry. Each dot represents a value from 1 sample. The thick line within each box represents median value. Box spans first to third quartile (IQR). Whiskers extend to the largest or smallest value no farther than 1.5 IQRs from the box. (B) Individual sample comparisons by scatter plot for each cell population. Each dot represents the cell subset frequency from 1 sample. Population comparisons are shown in the background in gray. Population frequencies are reported as percentage of all CD45+ cells.
Figure 3
Figure 3. Comparison of single-cell RNA sequencing, mass cytometry, and flow cytometry assessment of T lymphocyte frequencies in human bone marrow.
(A) Mass cytometry for phenotyping of T cell populations visualized using viSNE analysis with expression of key markers shown. (B) Comparison of cell frequencies for each donor determined by mass cytometry (CyTOF) and flow cytometry. CM: central memory cells; EM: effector memory cells; TEMRA: terminally differentiated effector memory T cells; TE: effector T cells; DNT: double-negative T cells; DPT, double-positive T cells. (C) T cell frequencies for cell populations identified by mass cytometry, flow cytometry, and scRNA-Seq. Each dot represents a value from 1 sample. The thick line within each box represents median value. Box spans first to third quartile (IQR). Whiskers extend to the largest or smallest value no farther than 1.5 IQRs from the box. (D) Individual sample comparisons by scatter plot for each cell population. Each dot represents the cell subset frequency from 1 sample (n = 8). All population comparisons are shown in the background in gray.

References

    1. Macosko EZ, et al. Highly parallel genome-wide expression profiling of individual cells using nanoliter droplets. Cell. 2015;161(5):1202–1214. doi: 10.1016/j.cell.2015.05.002. - DOI - PMC - PubMed
    1. Zheng GX, et al. Massively parallel digital transcriptional profiling of single cells. Nat Commun. 2017;8:14049. - PMC - PubMed
    1. Buenrostro JD, et al. Integrated single-cell analysis maps the continuous regulatory landscape of human hematopoietic differentiation. Cell. 2018;173(6):1535–1548.e16. doi: 10.1016/j.cell.2018.03.074. - DOI - PMC - PubMed
    1. Psaila B, et al. Single-cell profiling of human megakaryocyte-erythroid progenitors identifies distinct megakaryocyte and erythroid differentiation pathways. Genome Biol. 2016;17:83. - PMC - PubMed
    1. Velten L, et al. Human haematopoietic stem cell lineage commitment is a continuous process. Nat Cell Biol. 2017;19(4):271–281. doi: 10.1038/ncb3493. - DOI - PMC - PubMed

Publication types

MeSH terms