. 2018 Dec 6;3(23):e124351.
doi: 10.1172/jci.insight.124351.

FGF21 underlies a hormetic response to metabolic stress in methylmalonic acidemia

Affiliations

FGF21 underlies a hormetic response to metabolic stress in methylmalonic acidemia

Irini Manoli et al. JCI Insight. .

Abstract

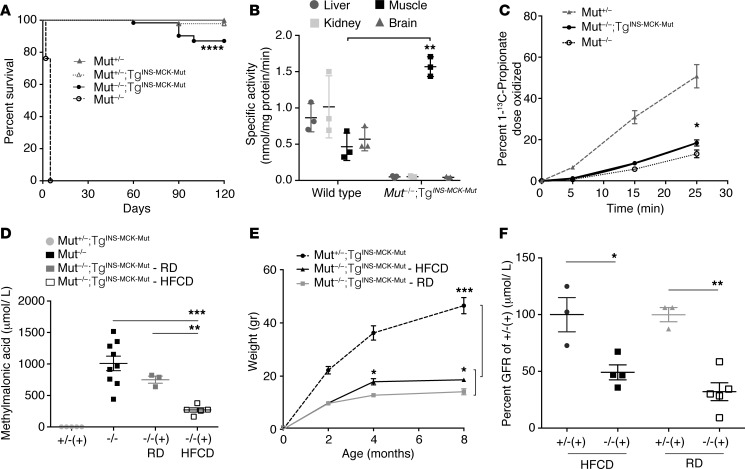
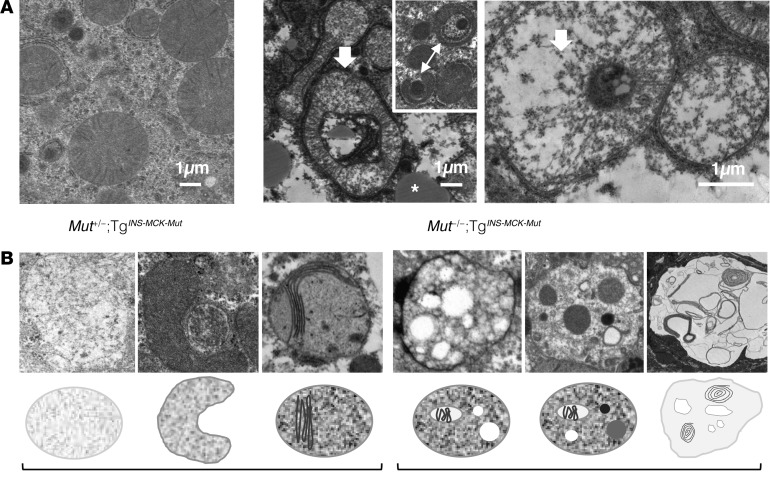
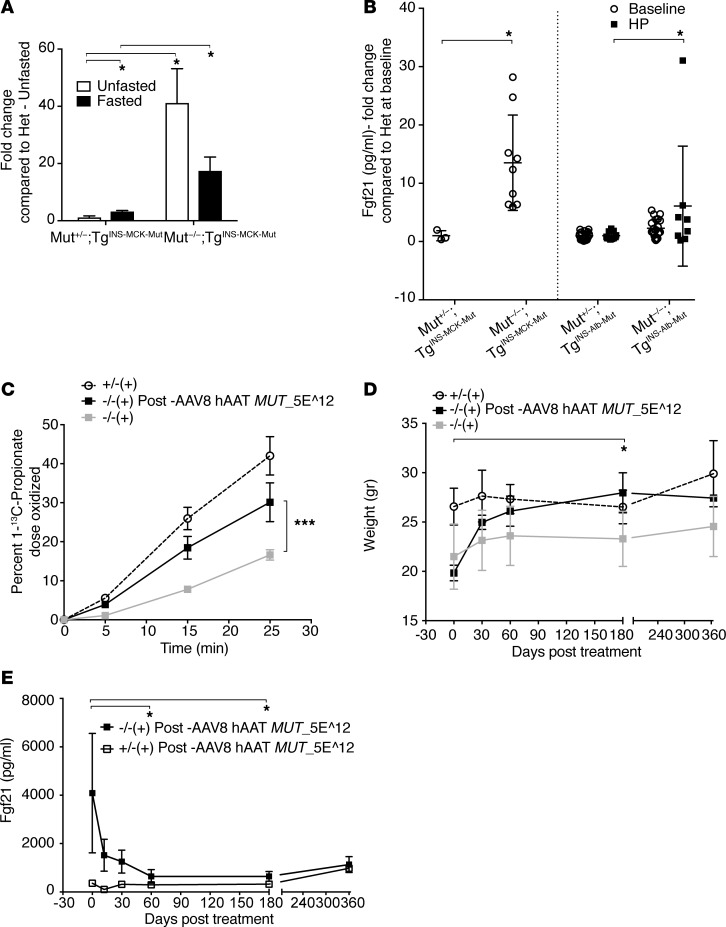
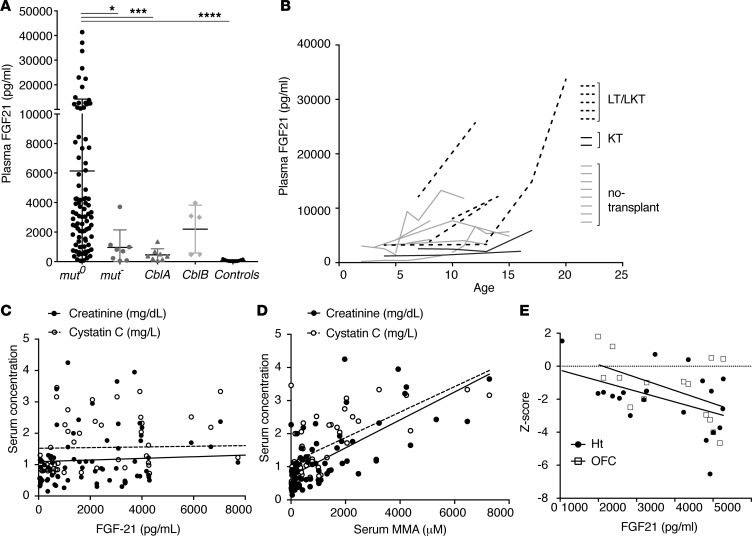
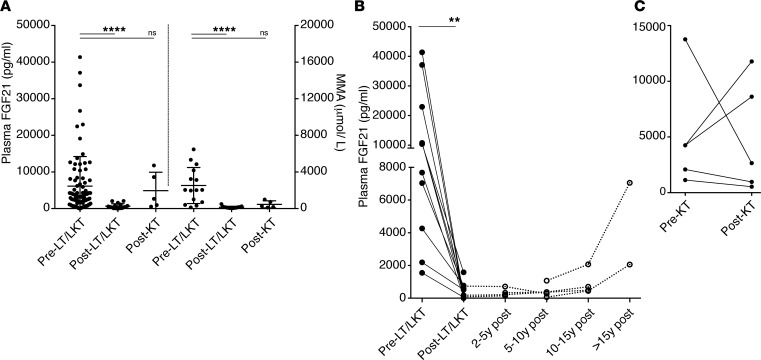
Methylmalonic acidemia (MMA), an organic acidemia characterized by metabolic instability and multiorgan complications, is most frequently caused by mutations in methylmalonyl-CoA mutase (MUT). To define the metabolic adaptations in MMA in acute and chronic settings, we studied a mouse model generated by transgenic expression of Mut in the muscle. Mut-/-;TgINS-MCK-Mut mice accurately replicate the hepatorenal mitochondriopathy and growth failure seen in severely affected patients and were used to characterize the response to fasting. The hepatic transcriptome in MMA mice was characterized by the chronic activation of stress-related pathways and an aberrant fasting response when compared with controls. A key metabolic regulator, Fgf21, emerged as a significantly dysregulated transcript in mice and was subsequently studied in a large patient cohort. The concentration of plasma FGF21 in MMA patients correlated with disease subtype, growth indices, and markers of mitochondrial dysfunction but was not affected by renal disease. Restoration of liver Mut activity, by transgenesis and liver-directed gene therapy in mice or liver transplantation in patients, drastically reduced plasma FGF21 and was associated with improved outcomes. Our studies identify mitocellular hormesis as a hepatic adaptation to metabolic stress in MMA and define FGF21 as a highly predictive disease biomarker.

Keywords: Gene therapy; Genetics; Intermediary metabolism; Metabolism; Mitochondria.


Conflict of interest statement

Conflict of interest: IM, RJC, and CPV are inventors on patents (12/418,795; 61/792,081; 62/556,071; 62/579,247) related to MMA filed by the NIH on their behalf. Lina Li is an employee of LLN Consultant Inc. and founder of CELiD Biotechnologies Inc. GME is a consultant for Moderna Therapeutics, LogicBio Therapeutics, Horizon Pharma, and Natera; a data-monitoring committee member for BioMarin, Audentes Therapeutics, Amicus, RegenxBio, and NeuroVia; and an investigator on clinical trials for Aeglea, BioElectron, and Stealth Therapeutics. LHV is an inventor of AncAAV and other AAV technologies, which are licensed to various biotechnology and pharmaceutical entities. LHV is a consultant to a number of companies with gene therapy interest, including Selecta Biosciences and Lonza, licensees of AncAAV technology. CPV has received funding to support AAV gene therapy research for MMA from Selecta Biosciences and LogicBio Therapeutics.

Figures

Figure 1
Figure 1. Phenotypic characterization of the muscle transgenic MMA mouse model.
(A) Mut−/−;TgINS-MCK-Mut mice (n = 62 ) exhibit near normal survival compared with the neonatal lethality of Mut–/– mice (n = 42; log-rank Mantel-Cox and Gehan-Breslow-Wilcoxon test, P < 0.0001) and comparable to their heterozygote littermates (n = 46 and 28, respectively; P = NS). (B) Mut-specific activity was undetectable in the liver, kidney, and brain extracts of Mut–/–;TgINS-MCK-Mut mice, while it was approximately 3 times higher in skeletal muscle compared with that in wild-type controls (1.57 ± 0.07 vs. 0.46 ± 0.11nmol/mg protein/min, n = 3, P = 0.001, unpaired t test). (C) [1-13C] propionate in vivo oxidation showed a small but significant increase by the muscle transgene-mediated Mut expression (n = 3, 6, and 4 for Mut+/−, Mut−/−;TgINS-MCK-Mut, and Mut−/−, respectively; P = 0.04 between mice with and without the transgene). (D) Plasma methylmalonic acid concentrations in Mut−/−;TgINS-MCK-Mut mice were lower compared with Mut−/− mice when animals were reared on high-fat and carbohydrate (HFCD) but not on regular chow diet (RD) (P = 0.0006, n = 3–5, 1-way ANOVA with Tukey’s test for multiple comparisons). (E) Somatic growth was impaired, with Mut−/−;TgINS-MCK-Mut mice not exceeding 50% of the weight of their littermates throughout their life span (P = 0.0002). High caloric diet resulted in improved weight compared with regular chow (P = 0.022, n = 7 mice per group). (F) Glomerular filtration rate (GFR) in Mut−/−;TgINS-MCK-Mut mice was 49.15% ± 6.6% of the average GFR in heterozygote mice on HFCD and 32.1 ± 7.89% on RD (n = 3 and 5, P = 0.05 on HFCD and n = 3 and 4, P = 0.035 for RD, Mann-Whitney U test). GFR between the different diets was not significant. Values are mean ± SEM. *P < 0.05, **P < 0.01, ***P < 0.001, ****P < 0.0001).
Figure 2
Figure 2. Hepatic ultrastructural changes in Mut–/–;TgINS-MCK-Mut animals replicate the pathology seen in MMA patients.
(A) Electron microscopy of mutant mouse liver tissue showed lipid droplets (white asterisk, middle) and wide-spread large, abnormally shaped mitochondria with cristae rarefication and decreased matrix density in mutant animals (white arrows, middle and right), as opposed to their heterozygote littermates reared on the same diet (left) (scale bars: 1 μm). Many formed ring-shaped structures and appeared to be engulfing other cellular components (arrow with two heads, middle inset). (B) Ultrastructure of explanted livers from patients undergoing a liver transplantation procedure showed mitochondria with reduced matrix density and shortened, disorganized cristae and, in some cases, complex cytoplasmic inclusions of varying density engulfed by membranes, suggestive of autophagic vacuoles. Representative structural changes and a graphic of the observed pathology in the mitochondrial ultrastructure (left) and cellular autophagic vacuoles/inclusions (right) are depicted.
Figure 3
Figure 3. Fgf21 dysregulation in Mut–/–;TgINS-MCK-Mut mice.
Hepatic Mut correction by transgenesis or AAV gene therapy confers biochemical and clinical improvement in Mut–/–;TgINS-MCK-Mut mice, associated with a precipitous decrease in Fgf21. (A) Mut–/–;TgINS-MCK-Mut mice had 41,237 ± 11.943 vs. 1.257 ± 0.47–fold higher hepatic Fgf21 mRNA expression compared with heterozygous mice at baseline (white bars) but failed to induce its transcription in the fasting state (black bars) (n = 4 per group and condition tested). (B) Liver transgenic animals, Mut–/–;TgINS-Alb-Mut display milder elevations in plasma Fgf21 concentrations (2.282 ± 0.337–fold higher than their heterozygote littermates, n = 21 and 19, respectively, P = NS) that were relatively unaffected by high-protein challenge, except for a sick male mutant animal (6.07 ± 3.62–fold higher than controls, n = 8; P = NS). (C) A single retro-orbital injection of a 5 x 10¹² GC/kg (AAV genome copies/kg) dose of the AAV8-hAAT-MUT vector conferred a robust increase in 1-13C-sodium propionate oxidation in Mut–/–;TgINS-MCK-Mut mice compared with their baseline levels (30.122 ± 8.61 after gene therapy compared with 16.637 ± 4.012 at baseline, n = 3 and 9, respectively). (D) Liver-directed gene therapy caused a rapid weight gain in the treated mice (P = 0.015 at 180 days after gene therapy compared with pretreatment weights, n = 3, Friedman paired nonparametric ANOVA after correction for multiple comparisons). (E) Plasma Fgf21 concentrations ranged from 1,000–7,000 pg/ml (normal <200) before gene therapy. Serial repeat measures after gene therapy over a year showed a significant decrease in plasma Fgf21 compared with baseline at days 60 and 180 (adjusted P = 0.0228 and 0.0441, respectively, compared with day 0, Friedman nonparametric repeated-measures ANOVA with correction for multiple comparisons). *P < 0.05, ***P < 0.001.
Figure 4
Figure 4. Plasma FGF21 concentrations in methylmalonic acidemia patients —correlations with subtype severity and clinical parameters.
(A) FGF21 concentrations were massively elevated in MMA patients compared with controls (range: 355.9–41,371.06 pg/ml, mean ± SD; 6,430 ± 8,149 for mut0 patients, 965.4 ± 1,185 for mut patients; 458.4 ± 412.2 in cblA patients; and 2,206 ± 1,662 in cblB patients, as opposed to 73.67 ± 58.94 in controls; n = 86, 8, 8, 5 and 11, respectively; P < 0.0001, Kruskal-Wallis test). Significant differences were observed between mut0 and all other subtypes, except the cblB (adjusted P values by Dunn’s multiple comparisons test comparing each subtype to mut0 were 0.0145 for mut, 0.0009 for cblA, and <0.0001 for controls). Lowest concentrations were measured in cblA patients, who represent the milder, B12-responsive form of the disease. *P < 0.05, ***P < 0.001, ****P < 0.0001. (B) Longitudinal measurements reveal a gradual increase in plasma FGF21 in mut0 patients who were referred for liver and or liver/kidney transplantation (dotted lines), as opposed to isolated kidney transplant (dark gray lines) or no transplant (light gray lines). (C) FGF21 plasma concentrations showed no correlation with renal function indices, including serum creatinine (r = 0.1947, P = 0.079, R2 = 0.0379, n = 82) and cystatin C (r = 0.0739, P = 0.587, R2 = 0.0054, n = 56) (black and white circles, respectively). (D) In contrast, serum MMA (μM) shows a very strong correlation with renal function indices, serum creatinine (r = 0.708, P < 0.0001, R2 = 0.50, n = 83) and cystatin C (r = 0.682, P < 0.0001, R2 = 0.46, n = 57). (E) Plasma FGF21 concentrations showed a negative correlation with height-for-age Z-score (r = –0.455, P = 0.038, R2 = 0.277) and head circumference-for-age Z-score (r = –0.505, P = 0.05, R2 = 0.255).
Figure 5
Figure 5. Plasma FGF21 response to organ transplantation.
(A) Liver or combined liver and kidney but not isolated kidney transplant recipients had a significant lower plasma FGF21 concentrations than nontransplanted mut0 patients (mean ± SEM; 13,953 ± 12,611 pg/ml vs. 467.8 ± 522.9, n = 10; P < 0.002, paired Wilcoxon test). The fold change in FGF21 was more significant than the change in plasma methylmalonic acid concentrations (from 2,854 ± 2,452 to 298.4 ± 171.9; P < 0.0059; n = 10). (B) FGF21 plasma concentrations measured before and after LT/LKT (n = 12) showed uniform and sustained improvement. A late increase more than 15 years after LKT was observed in a mut0 patient, who received a partial auxiliary liver transplant and a second case with morbid obesity. (C) Kidney transplant recipients (n = 5) experienced a varied response in plasma FGF21 levels. Two patients showed increased FGF21, correlating with the severity of their disease progression.

References

    1. Flavin M, Ortiz PJ, Ochoa S. Metabolism of propionic acid in animal tissues. Nature. 1955;176(4487):823–826. doi: 10.1038/176823a0. - DOI - PubMed
    1. Lardy HA, Adler J. Synthesis of succinate from propionate and bicarbonate by soluble enzymes from liver mitochondria. J Biol Chem. 1956;219(2):933–942. - PubMed
    1. Fenton WA, Hack AM, Willard HF, Gertler A, Rosenberg LE. Purification and properties of methylmalonyl coenzyme A mutase from human liver. Arch Biochem Biophys. 1982;214(2):815–823. doi: 10.1016/0003-9861(82)90088-1. - DOI - PubMed
    1. Mancia F, Evans PR. Conformational changes on substrate binding to methylmalonyl CoA mutase and new insights into the free radical mechanism. Structure. 1998;6(6):711–720. doi: 10.1016/S0969-2126(98)00073-2. - DOI - PubMed
    1. Banerjee R. Radical carbon skeleton rearrangements: catalysis by coenzyme B12-dependent mutases. Chem Rev. 2003;103(6):2083–2094. doi: 10.1021/cr0204395. - DOI - PubMed

Publication types

MeSH terms

Supplementary concepts