. 2018 Dec 6;3(23):e124729.
doi: 10.1172/jci.insight.124729.

Peptidylarginine deiminases 2 and 4 modulate innate and adaptive immune responses in TLR-7-dependent lupus

Affiliations

Peptidylarginine deiminases 2 and 4 modulate innate and adaptive immune responses in TLR-7-dependent lupus

Yudong Liu et al. JCI Insight. .

Abstract

The peptidylarginine deiminases PAD2 and PAD4 are implicated in the pathogenesis of several autoimmune diseases. PAD4 may be pathogenic in systemic lupus erythematosus (SLE) through its role in neutrophil extracellular trap (NET) formation that promotes autoantigen externalization, immune dysregulation, and organ damage. The role of this enzyme in mouse models of autoimmunity remains unclear, as pan-PAD chemical inhibitors improve clinical phenotype, whereas PAD4-KO models have given conflicting results. The role of PAD2 in SLE has not been investigated. The differential roles of PAD2 and PAD4 in TLR-7-dependent lupus autoimmunity were examined. Padi4-/- displayed decreased autoantibodies, type I IFN responses, immune cell activation, vascular dysfunction, and NET immunogenicity. Padi2-/- mice showed abrogation of Th subset polarization, with some disease manifestations reduced compared with WT but to a lesser extent than Padi4-/- mice. RNA sequencing analysis revealed distinct modulation of immune-related pathways in PAD-KO lymphoid organs. Human T cells express both PADs and, when exposed to either PAD2 or PAD4 inhibitors, displayed abrogation of Th1 polarization. These results suggest that targeting PAD2 and/or PAD4 activity modulates dysregulated TLR-7-dependent immune responses in lupus through differential effects of innate and adaptive immunity. Compounds that target PADs may have potential therapeutic roles in T cell-mediated diseases.

Keywords: Autoimmune diseases; Autoimmunity; Inflammation; Lupus; Neutrophils.


Conflict of interest statement

Conflict of Interest: PRT holds a patent of AFM30a and was the founder of the scientific advisory board for Padlock Therapeutics, which was acquired by Bristol Myers Squibb in April of 2016.

Figures

Figure 1
Figure 1. Padi2 and Padi4 deficiencies differentially modulate TLR-7–induced autoimmunity.
(A) Quantification of splenomegaly assessed by spleen weight (% of body weight) in untreated (white bars) and imiquimod-treated (black bars) WT FVB, Padi2–/–, and Padi4–/– mice; n = 10–15 mice/group. Compiled data from 3 independent experiments. (B and C) Levels of circulating anti-dsDNA autoantibodies (B) and total IgG (C) in untreated (white whisker plots) and imiquimod-treated (black whisker plots) FVB, Padi2–/–, and Padi4–/– mice. n = 9–15 mice/group. Compiled data from 3 independent experiments. (D) Gene expression data of splenocytes from treated FVB, Padi2–/–, and Padi4–/– mice normalized to gene expression in the corresponding control mice. n = 7 mice/group. Compiled data from 2 independent experiments. Box-and-whisker plots show median, lower and upper quartiles, and minimum and maximum values. *P < 0.05, **P < 0.005, ***P < 0.0005, ****P < 0.0001. Statistical analysis was performed by 2-tailed Mann-Whitney U test. IMQ, imiquimod.
Figure 2
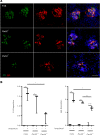
Figure 2. Renal immune complex deposition is attenuated in imiquimod-treated Padi4–/–mice.
(A and B) Frozen kidney sections were stained for immune complex deposition (A) and quantified based on fluorescence intensity and staining pattern (B); n = 3 mice/group. Box-and-whisker plots show median, lower and upper quartiles, and minimum and maximum score values. *P < 0.05, **P < 0.005, ***P < 0.0005, ****P < 0.0001. Statistical analysis was performed by 2-tailed unpaired t test. Green represents C3, red represents IgG, and blue represents DAPI. The figures on the right are merged images. Total magnification is 40×.
Figure 3
Figure 3. Imiquimod-treated Padi4–/– mice retain normal vasorelaxation capacity.
(A–C) Aortic rings were isolated from untreated and imiquimod-treated FVB (A), Padi2–/– (B), and Padi4–/– (C) mice. Acetylcholine-dependent relaxation following phenylephrine (PE) precontraction was determined. n = 6–10 mice/group. Results represent mean ± SEM % vasorelaxation; ****P < 0.0001. A 2-way ANOVA with post-hoc Tukey’s test was used to compare differences between the groups.
Figure 4
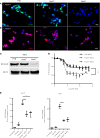
Figure 4. Padi4–/– neutrophils generate NETs lacking citrullinated Histone 3 (Cit-H3) and do not promote vascular damage.
(A and B) BM neutrophils of naive FVB, Padi2–/–, and Padi4–/– mice were stimulated with the calcium ionophore A23817 for 2 hours to induce NET formation and stained for Cit-H3 (A) and MPO (B). Total magnification is 40×. (C) Lack of Cit-H3 in Padi4–/– NETs was confirmed by Western blot of imiquimod-induced NETs. Results are representative of 3 experiments (D). Aorta rings were cultured in the presence of imiquimod-induced NETs prior to assessment of vasorelaxation capacity. Results represent % mean ± SEM vasorelaxation, n = 3 mice/group. (E) Splenocytes from naive FVB, Padi2–/–, and Padi4–/– mice (n = 3/group) were cultured for 24 hours in the presence of imiquimod-induced NETs, and the expression of type 1 IFN–inducible genes was analyzed by RT-PCR. *P < 0.05, **P < 0.005. Statistical analysis was performed with 2-tailed unpaired t test. For D, analysis was by 2-way ANOVA with post-hoc Tukey’s test to compare differences between the groups; *P < 0.05 for PAD4 KO vs. FVB; #P < 0.05 for PAD4 KO vs. PAD2 KO.
Figure 5
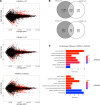
Figure 5. PAD2 and PAD4 differentially regulate gene expression in secondary lymphoid organs.
(A) MA plots of gene expression data in lymph nodes following in vivo imiquimod exposure between Padi2–/–, Padi4–/–, and WT FVB (WT) (n = 4 mice/group). Differential expression was calculated by ANOVA test on normalized gene counts. Genes with P < 0.05 are colored in red. (B) Venn diagrams depicting the number of significantly downregulated and upregulated genes between Padi2–/– or Padi4–/– and WT lymph nodes. (C) Gene Ontology (GO) biological pathway analysis of significant genes between Padi4–/– and Padi2–/– lymph nodes. Statistical analysis of functional profiles for genes and related pathways was performed using the clusterProfiler package in RStudio.
Figure 6
Figure 6. PAD2 expression in murine CD4+ T cells.
(A and B) Splenocytes isolated from naive FVB, Padi2–/–, and Padi4–/– mice were sorted, and PAD2 expression was quantified by Western blot and densitometry. Data are shown as mean ± SD; 2 mice per group ( and 2).
Figure 7
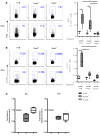
Figure 7. Reduced in vivo Th1 and Th17 responses in imiquimod-treated Padi2–/– and Padi4–/– mice.
(A and B) Splenocytes from untreated and imiquimod-treated (IMQ-treated) FVB, Padi2–/–, and Padi4–/– mice were stimulated in vitro with PMA and ionomycin, and CD4+ T cell cytokine production was measured by flow cytometry to determine Th1 (A) and Th17 (B) responses. Box-and-whisker plots show median, lower and upper quartiles, and minimum and maximum % values and are representative of 2 independent experiments, each performed in 4-6 mice/group. *P < 0.05, **P < 0.005, ****P < 0.0001. (C) Splenic naive T cells from FVB, Padi2–/–, and Padi4–/– mice were activated by α-CD3 and α-CD28 in the presence/absence of polarizing cytokines and antibodies. At day 5, the cells were analyzed for gene expression levels of Ifng in Th1 conditions and Il17a in Th17 conditions; n = 4. Box-and-whisker plots show median, lower and upper quartiles, minimum and maximum fold induction relative to polarization response in FVB mice. *P < 0.05, **P < 0.005. Statistical analysis was performed by 2-tailed Mann-Whitney U test.
Figure 8
Figure 8. PAD2 and PAD4 are expressed on human T cells and modulate Th1 responses.
(A) PAD2 protein expression levels (by geometric mean fluorescent intensity, MFI, relative to isotype control) in healthy control human neutrophils (CD15+), monocytes (CD14+), and T cells (CD3+CD4+). Box-and-whisker plots show median, lower and upper quartiles, and minimum and maximum MFI values of 5 independent experiments. (B and C) PAD2 protein expression quantified in SLE CD4+ T cells by Western blot (B) and immunofluorescence (C). In B, each lane represents an individual SLE subject (n = 4). C is a representative microphotograph of lupus CD4+ T cells (n = 2); magnification is 40×. (D) PAD4 protein expression levels assessed by geometric MFI relative to isotype control in healthy control human neutrophils (CD15+), monocytes (CD14+), and T cells (CD3+CD4+). Box-and-whisker plots show median, lower and upper quartiles, and minimum and maximum MFI values of 5 independent experiments. (E) Sorted healthy donor naive CD4+ T cells were activated with α-CD3 and soluble α-CD28 and polarized for 5 days in the presence or absence of the PAD2 inhibitor AFM30a or the PAD4 inhibitor GSK199. Left graph shows box-and-whisker plots displaying median, lower and upper quartiles, and minimum and maximum MFI values of IFN-γ in Th1 conditions, and right graph displays box-and-whisker plots with median, lower and upper quartiles, and minimum and maximum mRNA fold induction of IFNG in Th1 conditions relative to untreated control; n = 5 healthy controls. Statistical analysis was performed by 2-way ANOVA with Dunnett’s multiple comparisons test.

References

    1. Tsokos GC. Systemic lupus erythematosus. N Engl J Med. 2011;365(22):2110–2121. doi: 10.1056/NEJMra1100359. - DOI - PubMed
    1. Crow MK. Type I interferon in the pathogenesis of lupus. J Immunol. 2014;192(12):5459–5468. doi: 10.4049/jimmunol.1002795. - DOI - PMC - PubMed
    1. Kahlenberg JM, Kaplan MJ. Mechanisms of premature atherosclerosis in rheumatoid arthritis and lupus. Annu Rev Med. 2013;64:249–263. doi: 10.1146/annurev-med-060911-090007. - DOI - PMC - PubMed
    1. Denny MF, et al. A distinct subset of proinflammatory neutrophils isolated from patients with systemic lupus erythematosus induces vascular damage and synthesizes type I IFNs. J Immunol. 2010;184(6):3284–3297. doi: 10.4049/jimmunol.0902199. - DOI - PMC - PubMed
    1. Witalison EE, Thompson PR, Hofseth LJ. Protein Arginine Deiminases and Associated Citrullination: Physiological Functions and Diseases Associated with Dysregulation. Curr Drug Targets. 2015;16(7):700–710. doi: 10.2174/1389450116666150202160954. - DOI - PMC - PubMed

Publication types

MeSH terms