. 2018 Dec 6;3(23):e97021.
doi: 10.1172/jci.insight.97021.

Circulating microRNA biomarkers for metastatic disease in neuroblastoma patients

Affiliations

Circulating microRNA biomarkers for metastatic disease in neuroblastoma patients

Fjoralba Zeka et al. JCI Insight. .

Abstract

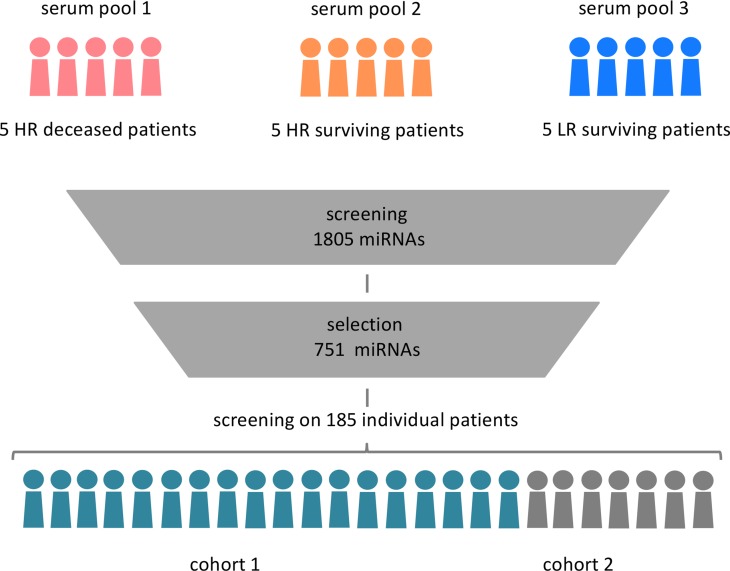
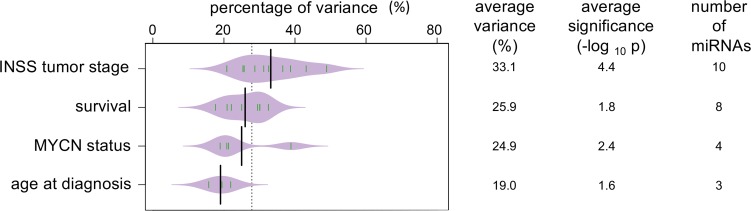
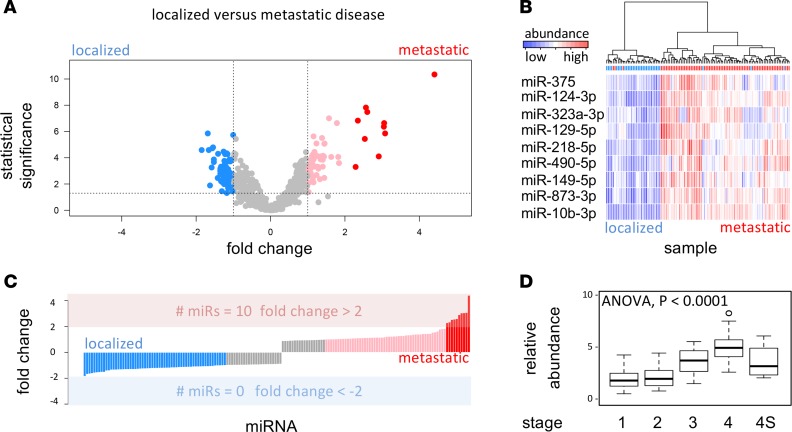
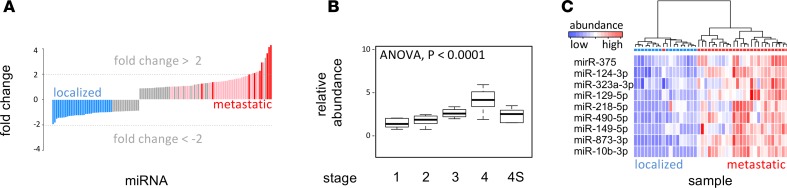
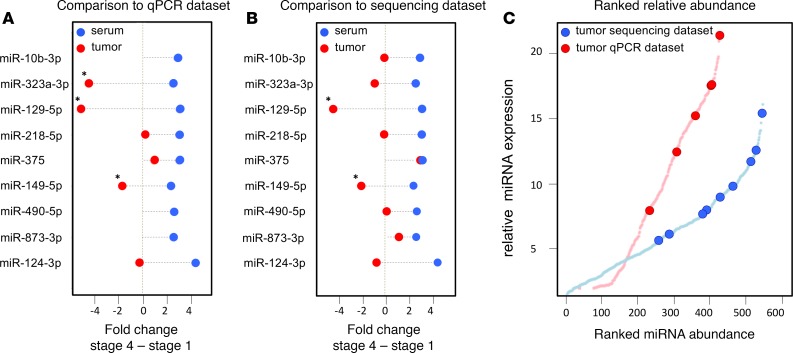
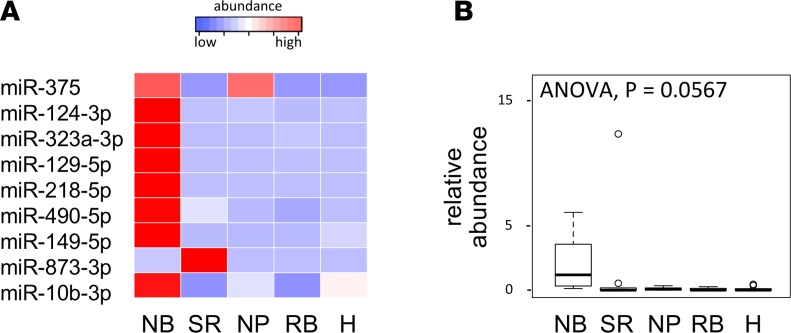
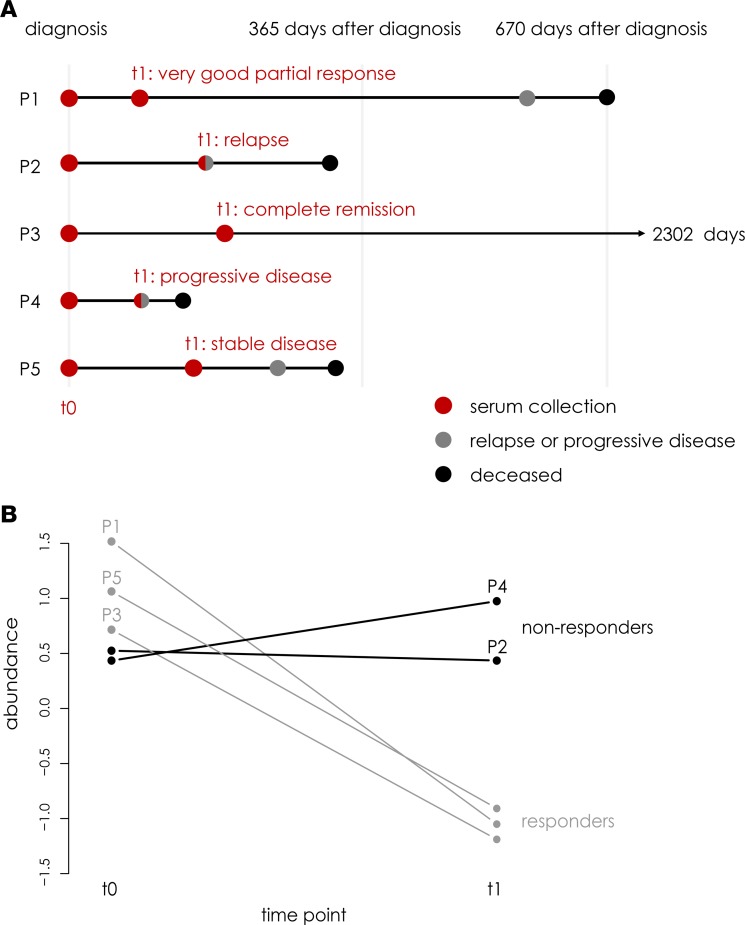
In this study, the circulating miRNome from diagnostic neuroblastoma serum was assessed for identification of noninvasive biomarkers with potential in monitoring metastatic disease. After determining the circulating neuroblastoma miRNome, 743 miRNAs were screened in 2 independent cohorts of 131 and 54 patients. Evaluation of serum miRNA variance in a model testing for tumor stage, MYCN status, age at diagnosis, and overall survival revealed tumor stage as the most significant factor impacting miRNA abundance in neuroblastoma serum. Differential abundance analysis between patients with metastatic and localized disease revealed 9 miRNAs strongly associated with metastatic stage 4 disease in both patient cohorts. Increasing levels of these miRNAs were also observed in serum from xenografted mice bearing human neuroblastoma tumors. Moreover, murine serum miRNA levels were strongly associated with tumor volume. These findings were validated in longitudinal serum samples from metastatic neuroblastoma patients, where the 9 miRNAs were associated with disease burden and treatment response.

Keywords: Genetics; Noncoding RNAs; Oncology.


Conflict of interest statement

Conflict of interest: The authors have declared that no conflict of interest exists.

Figures

Figure 1
Figure 1. Defining the human neuroblastoma circulating miRNome.
Three serum pools were prepared, each containing 5 serum samples from 3 neuroblastoma subgroups: 5 high-risk (HR) deceased patients, 5 high-risk surviving patients, and 5 low-risk (LR) surviving patients for serum pool 1, 2, and 3, respectively. Expression of 1,805 miRNAs was measured by qPCR; 751 well-expressed miRNAs were selected and profiled on 2 independently collected and processed patient cohorts of 131 patients and 54 patients, respectively.
Figure 2
Figure 2. Tumor stage has the largest impact on circulating miRNA levels in serum.
Bean plot of the average variance per disease feature (%), average significance (–log10 of the P value), and number of miRNAs significantly influenced by disease features. Green lines in the violin plot represent percentage of variance for individual miRNAs. The evaluated disease features were tumor stage (1,2, 3, 4, and 4S), overall survival (survival), MYCN status, and age at diagnosis (18 moths cut-off). P values were corrected for multiple-testing error by the Benjamini-Hochberg method prior to averaging.
Figure 3
Figure 3. Identification of serum miRNAs as potential markers for disease burden in patient cohort 1.
(A) Fold change (log2 scale) of miRNA abundance in serum (x axis) against statistical significance (y axis, –log10 of the P value) between patients with metastatic (stage 4) neuroblastoma (n = 76) and patients with localized (stage 1 and stage 2) neuroblastoma (n = 33). Higher-fold change denotes higher abundance in metastatic serum. Pink dots represent miRNAs with at least 2-fold (1 log2 unit) higher abundance, and red dots represent miRNAs with at least a 4-fold higher abundance in serum from metastatic patients; blue dots represent miRNAs with at least 2-fold higher abundance in serum from patients with localized disease. For the selection of differentially abundant miRNAs, a Mann-Whitney U test was used at 0.05 significance level (corrected for multiple-testing by the Benjamini-Hochberg method). (B) Heatmap depicting hierarchical clustering of serum samples (cohort 1) based on 9 miRNAs with at least 4-fold higher abundance in serum from metastatic patients. (C) Fold change distribution of miRNA abundance in localized versus metastatic serum. The bar colors correspond to dot colors in plot A. (D) Boxplot of average miRNA expression for the selected set of 9 miRNAs in serum from stage 1, 2, 3, 4, and 4S patients.
Figure 4
Figure 4. Validation of serum miRNA markers for metastatic disease in patient cohort 2.
(A) Fold change distribution of miRNA abundance between sera from metastatic (stage 4) neuroblastoma (n = 27) and localized (stage 1 and 2) neuroblastoma (n = 17) patients (cohort 2, n = 54). Red bars indicate the position of the 9 miRNAs identified in the first cohort. (B) Boxplot of miRNA abundance for the selected 9 miRNAs in sera from stage 1, 2, 3, 4, and 4S disease, in the cohort 2. (C) Heatmap depicting hierarchical clustering of serum samples based on the selected set of 9 miRNAs.
Figure 5
Figure 5. Serum markers for metastatic disease are highly but not differentially expressed in primary tumors.
(A) miRNA abundance differences in serum and in tumor tissue measured by stem-loop qPCR. (B) miRNA abundance differences in serum and in tumor tissue measured by small RNA sequencing. The serum markers for metastatic disease that are differentially expressed between stage 4 and stage 1 tumor are marked by asterisk (Mann–Whitney U test P < 0.05, Benjamini-Hochberg correction for multiple-testing); red dots represent fold changes in tumor tissue, and blue dots represent fold changes in serum. (C) Ranked miRNA abundance in the qPCR data (red) and in the small RNA sequencing data (blue).
Figure 6
Figure 6. Serum microRNA markers for metastatic disease are specific for neuroblastoma.
(A) Standardized relative abundance for individual circulating miRNAs in serum pools from neuroblastoma (NB), sarcoma (SR), nephroblastoma (NP), and rhabdomyosarcoma (RB) patients and healthy children (H). (B) Relative abundance of circulating miRNAs in serum pools from NB, SR, NP, and RB patients and H.
Figure 7
Figure 7. Proportional increase of metastatic disease miRNA markers in serum from mice engrafted with human neuroblastoma cells.
(A) Average miRNA abundance (log10 normalized values) in murine serum from 8 engrafted mice 6 days before engraftment and 11 days and 25 days after engraftment. i, miR-873-3p is a human specific miRNA assay; asterisks represent significant increase of miRNA abundance over time based on linear mixed-effects model analysis (P < 0.05, 1-way ANOVA).(B) Luciferase fluorescence assessment of tumor volume 14 days and 23 days after engraftment for 5 of 8 mice in A.
Figure 8
Figure 8. Serum abundance of disease burden miRNA markers changes during treatment of stage 4 neuroblastoma patients.
(A) The disease course for each of the patients (P1–P5) is depicted, including the time points of serum collection and occurrence of disease events (relapse, progressive disease, and death). (B) For each of the individual patients, the change in average abundance level of the 9 disease burden miRNA markers in serum is shown. Note that at t1, P1, P3, and P5 are considered treatment responders, while P2 and P4 are considered nonresponders.

References

    1. Cheung NK, Dyer MA. Neuroblastoma: developmental biology, cancer genomics and immunotherapy. Nat Rev Cancer. 2013;13(6):397–411. doi: 10.1038/nrc3526. - DOI - PMC - PubMed
    1. Smith MA, Altekruse SF, Adamson PC, Reaman GH, Seibel NL. Declining childhood and adolescent cancer mortality. Cancer. 2014;120(16):2497–2506. doi: 10.1002/cncr.28748. - DOI - PMC - PubMed
    1. Hartomo TB, et al. Minimal residual disease monitoring in neuroblastoma patients based on the expression of a set of real-time RT-PCR markers in tumor-initiating cells. Oncol Rep. 2013;29(4):1629–1636. doi: 10.3892/or.2013.2286. - DOI - PubMed
    1. Pugh TJ, et al. The genetic landscape of high-risk neuroblastoma. Nat Genet. 2013;45(3):279–284. doi: 10.1038/ng.2529. - DOI - PMC - PubMed
    1. Blondal T, et al. Assessing sample and miRNA profile quality in serum and plasma or other biofluids. Methods. 2013;59(1):S1–S6. doi: 10.1016/j.ymeth.2012.09.015. - DOI - PubMed

Publication types