. 2018 Dec;564(7735):219-224.
doi: 10.1038/s41586-018-0744-4. Epub 2018 Dec 5.

Single-cell mapping of lineage and identity in direct reprogramming

Affiliations

Single-cell mapping of lineage and identity in direct reprogramming

Brent A Biddy et al. Nature. 2018 Dec.

Abstract

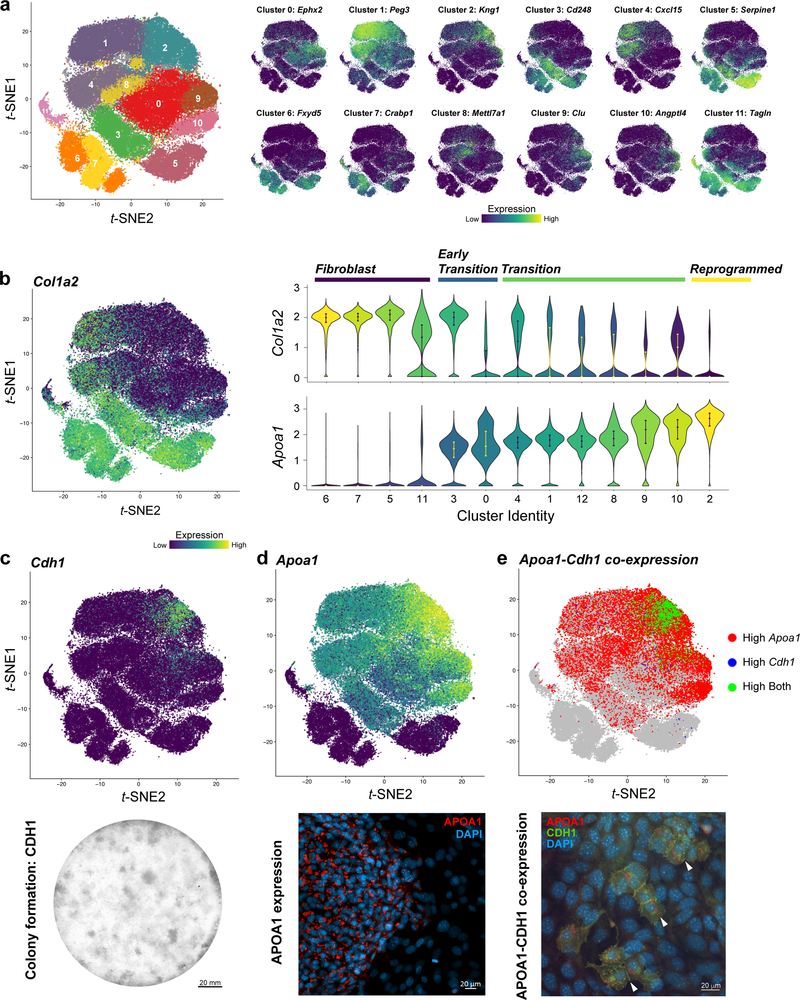
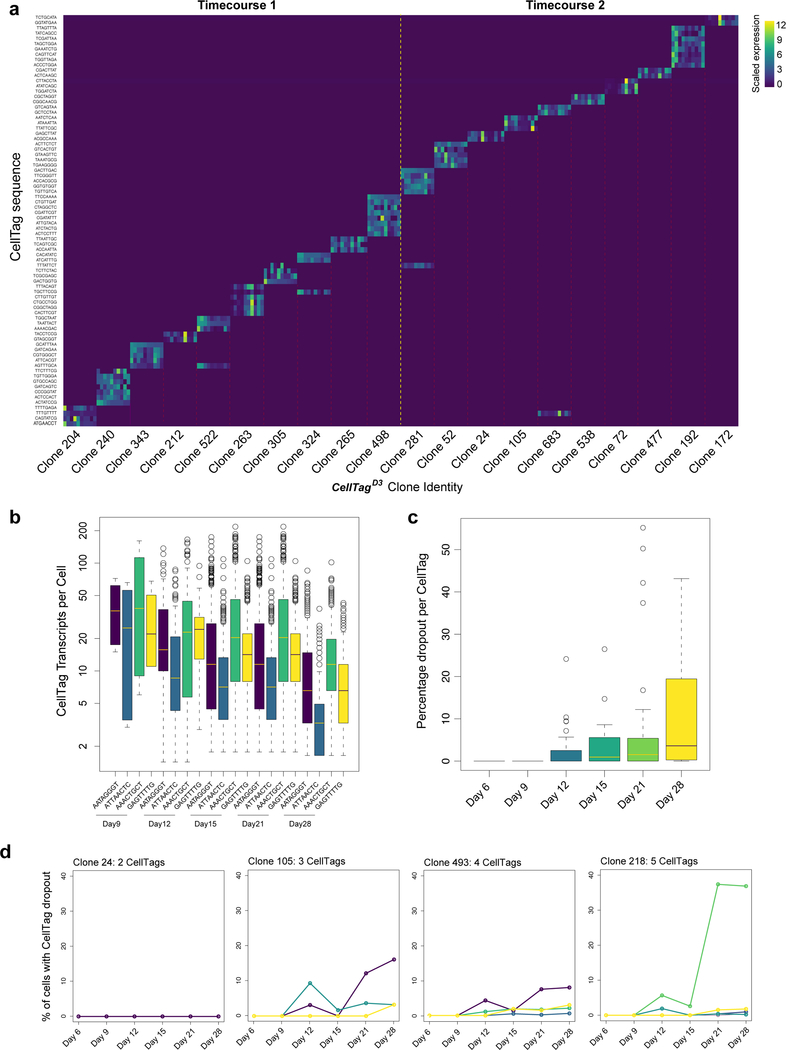
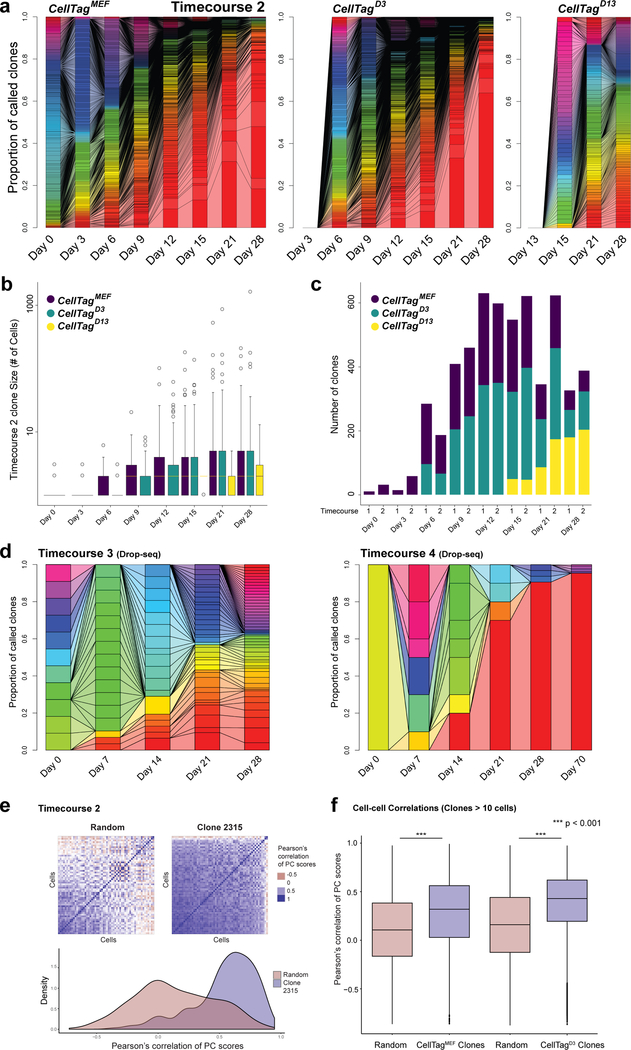
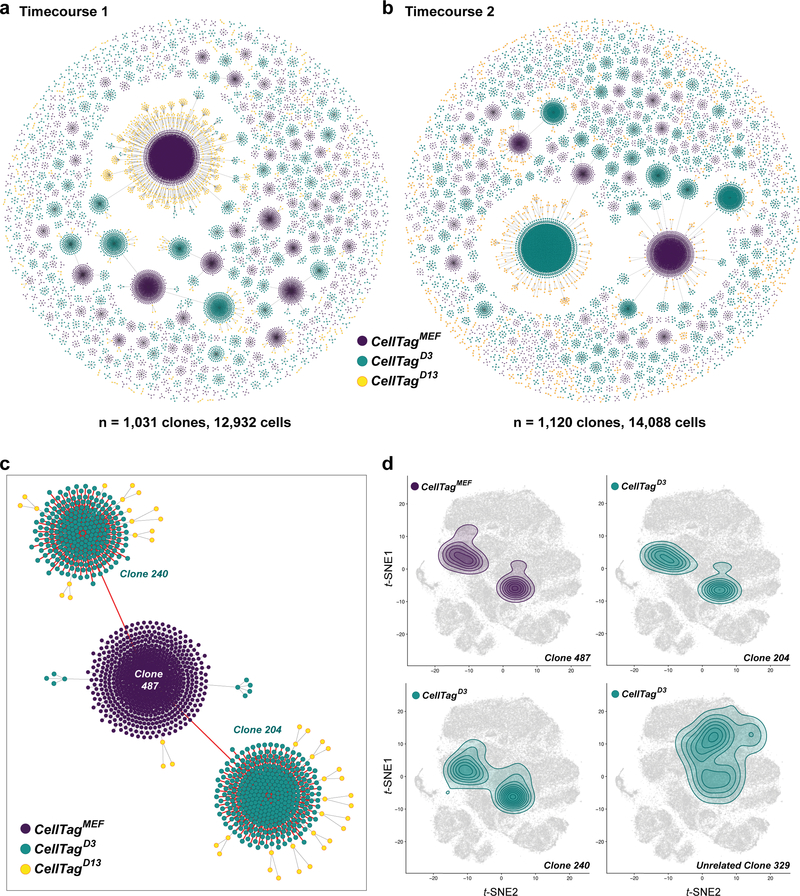
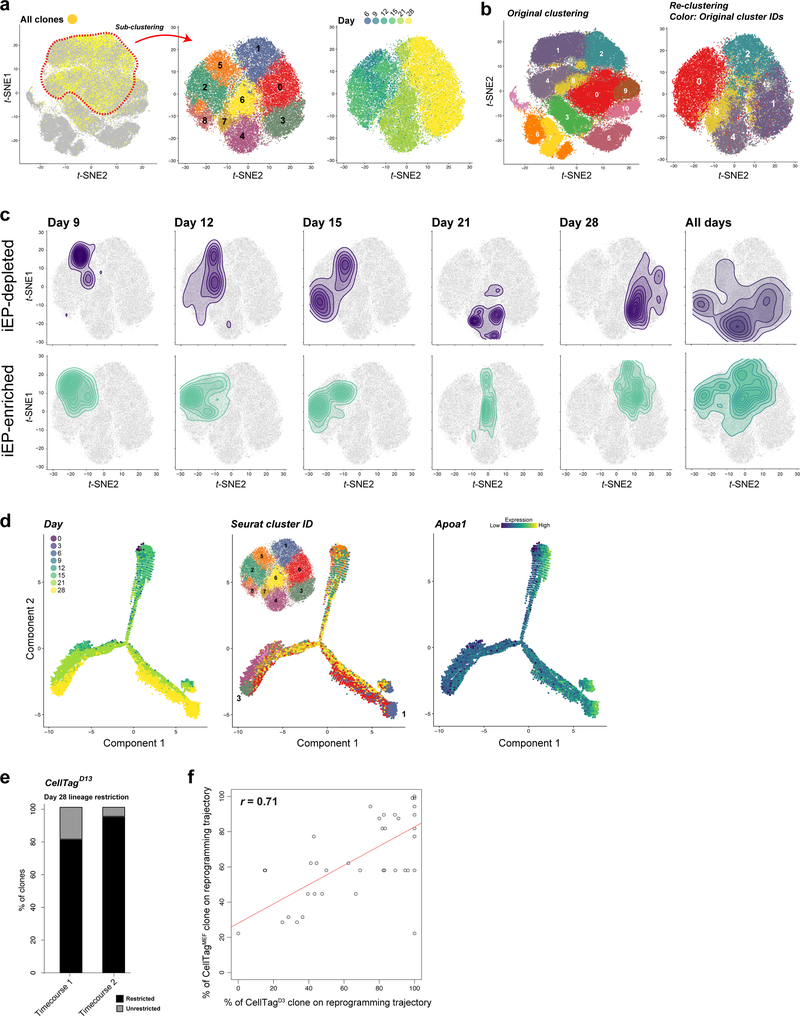
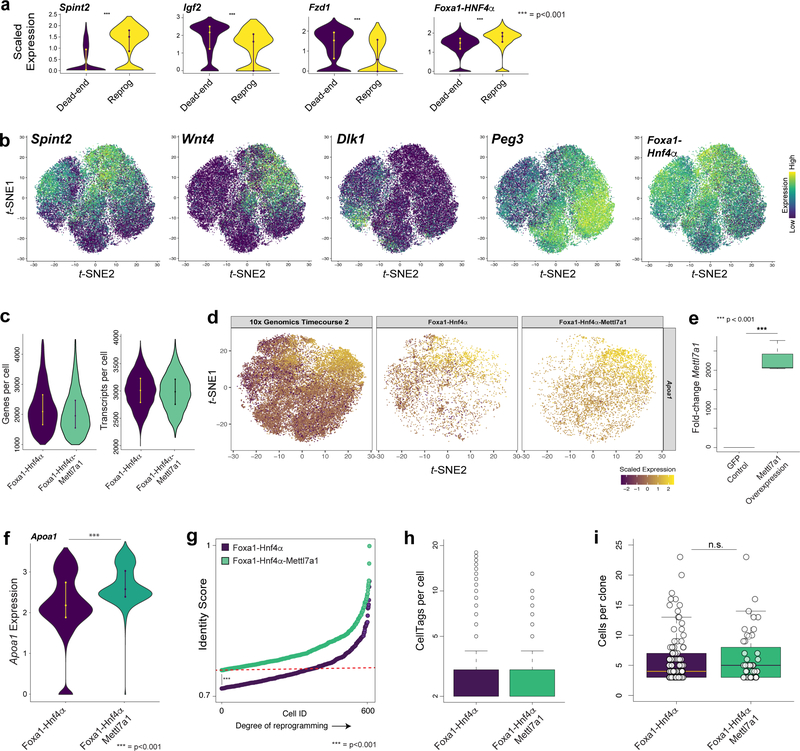
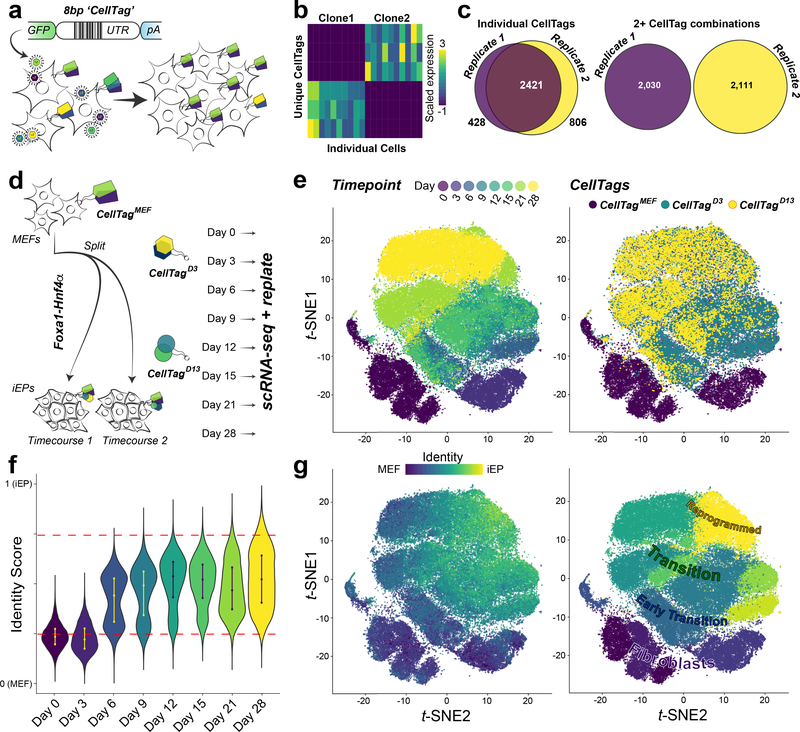
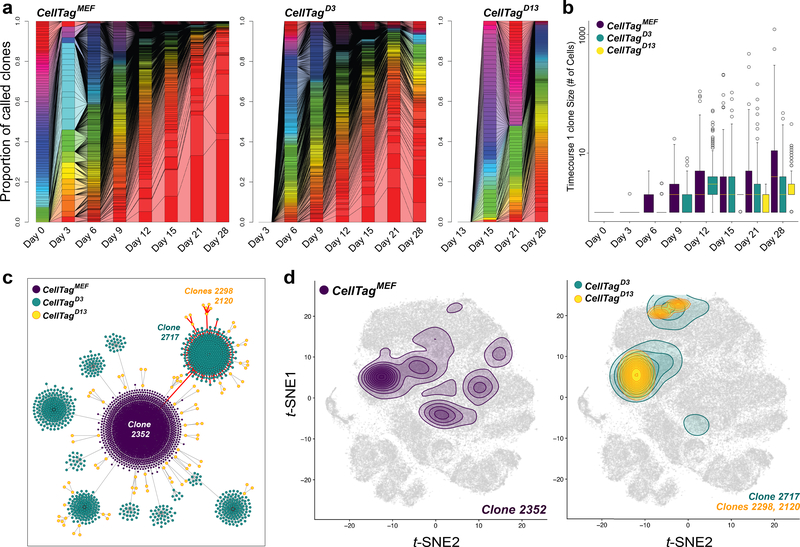
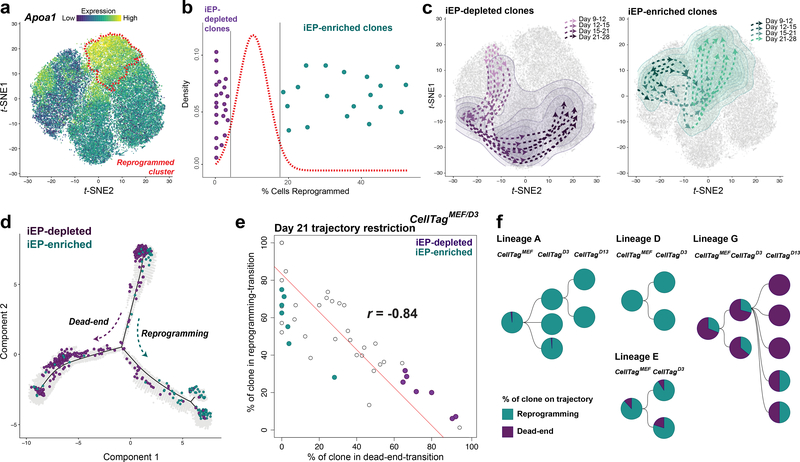
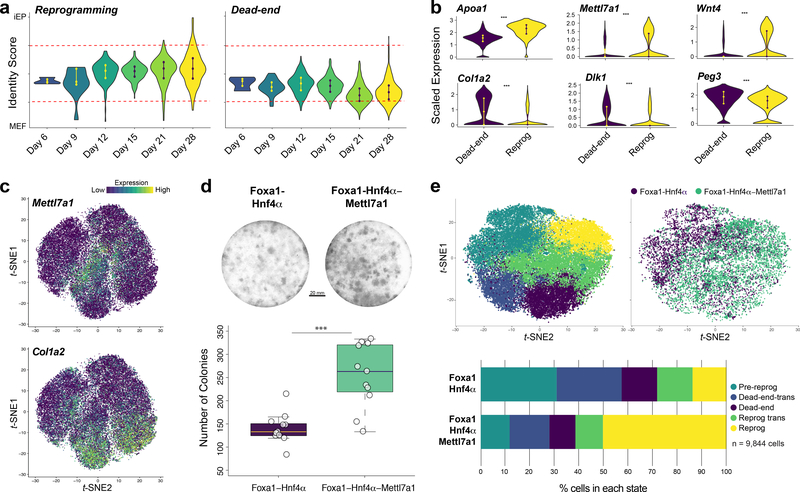
Direct lineage reprogramming involves the conversion of cellular identity. Single-cell technologies are useful for deconstructing the considerable heterogeneity that emerges during lineage conversion. However, lineage relationships are typically lost during cell processing, complicating trajectory reconstruction. Here we present 'CellTagging', a combinatorial cell-indexing methodology that enables parallel capture of clonal history and cell identity, in which sequential rounds of cell labelling enable the construction of multi-level lineage trees. CellTagging and longitudinal tracking of fibroblast to induced endoderm progenitor reprogramming reveals two distinct trajectories: one leading to successfully reprogrammed cells, and one leading to a 'dead-end' state, paths determined in the earliest stages of lineage conversion. We find that expression of a putative methyltransferase, Mettl7a1, is associated with the successful reprogramming trajectory; adding Mettl7a1 to the reprogramming cocktail increases the yield of induced endoderm progenitors. Together, these results demonstrate the utility of our lineage-tracing method for revealing the dynamics of direct reprogramming.


Figures

Extended Data Figure 1.
Extended Data Figure 1.. Outline of the CellTag filtering pipeline, whitelisting and species mixing validations.
(a) Schematic of the CellTag processing and filtering pipeline: CellTag sequences are first extracted from aligned sequencing reads, followed by construction of a matrix of CellTag expression in each cell. To mitigate potential artifacts arising as a result of PCR and sequencing errors, we implemented an error-correction step via the collapse of similar barcodes one edit-distance apart, on a cell-by-cell basis. An initial filtering step removes any CellTags that do not appear on a ‘whitelist’ of CellTags that are confirmed to exist in the complex lentiviral library. A second filtering step removes cells expressing less than two, and more than 20 unique CellTags. Using this filtered dataset, Jaccard analysis is then applied (using the R package, Proxy) to identify related cells, based on CellTag signature similarity, allowing clones to be called. (b) Generation of the CellTag whitelist. Following CellTag lentiviral plasmid sequencing, CellTags were extracted from the raw fastq files via identification of the adjacent motifs described in the methods section. A 90th percentile cutoff in terms of reads reporting each CellTag was used to select CellTags for inclusion on the whitelist. Of a possible 65,536 unique combinations, we detected 19,973 sequences passing this 90th percentile of read counts. Data for CellTag version 1 (CellTagMEF) is shown here. Whitelist creation was also performed for CellTag versions 2 (CellTagD3) and 3 (CellTagD13). (c) CellTag frequency, i.e. how many times each CellTag is detected in a population of transduced cells, before (black data points) and after removal (red data points) of CellTags that do not feature on the whitelist. This ‘whitelisting’ predominantly results in the removal of CellTags appearing only once, singletons likely to arise due to sequencing and PCR errors. This is reflected in the histogram in (d), showing that only 60% of singleton CellTags detected are retained, whereas over 90% of CellTags appearing at a frequency of two or more are retained. (e) Mean CellTags per cell pre- and post-CellTag pipeline filtering. Cells in this figure correspond to the cells shown in Fig. 1b,c (replicate 1: n=8,535 cells; replicate 2: n=11,997 cells). (f) Pairwise correlation scores (Jaccard similarity) and hierarchical clustering of 10 major clones arising from this tag and trace experiment. Hierarchical clustering is based on each cell’s Jaccard correlation relationships with other cells, where each defined ‘block’ of cells represents a clone. Left panel: scoring and clustering of pairwise correlations, pre-whitelisting and filtering. Right panel: Post-whitelisting and filtering, pairwise correlations are stronger and more cells are detected within each clone (n=869 cells). (g) CellTag frequency metric: Each detected CellTag appears in less than two cells (n=9,072 cells in total) at the start of the experiment, on average, thus the library is not dominated by any abundant CellTags, which would potentially generate false positive results. (h) A species mixing experiment, consisting of a mixture of human 293T cells and mouse embryonic fibroblasts (left panel), labelled with ~3–5 CellTags per cell and expressing GFP as a result. A fibroblast (white arrow) is visible within a colony of 293T cells, scale bar=50μM. 72hr-post-transduction, cells were harvested and processed for scRNA-seq via Drop-seq. Right panel: following sequencing and alignment, cells were assigned to their corresponding species, revealing a low rate of doublet formation (n=4,631 human cells, 312 mouse cells, 36 mixed). (i) Mean CellTags per cell for human and mouse cells in the species mixing experiment. CellTag transcripts were detected in 70% of cells (n=3,493/4,979 cells). Of the tagged population, each cell expressed 5 CellTags on average: 3.8±0.002 (mean ± s.e.m.) in human cells, and 5.9±0.02 in mouse cells. (j) For each cell, CellTag signatures were extracted and Jaccard similarity analysis was performed to assess the frequency of CellTag signature overlap between the two species. To establish a false positive baseline, we initially compared CellTag overlap between mouse and human populations, as these cells are not related. From the analysis of 4,943 cells, we identified 200 instances of mouse:human cell pairings, out of a possible 1.5×10⁷ pairs, sharing the same individual CellTags. This demonstrates that reliance on only one CellTag per cell does not uniquely label cells with high confidence. Excluding cells represented by only one CellTag removes this noise, resulting in no detection of cross-species CellTag signatures (Jaccard similarity index <0.7). This highlights the importance of combinatorial labelling, and the efficacy of our approach to uniquely label unrelated cells.
Extended Data Figure 2.
Extended Data Figure 2.. CellTagging does not perturb cell physiology or reprogramming efficiency.
To assess the potential impact of CellTagging on cell physiology we performed scRNA-seq on CellTagged cells and unlabelled, control cells, 72hr post-tagging. (a) Left panel: Fluorescent image of CellTagged, GFP-expressing, pre-B cell line, HAFTL-1. Right panels: 10x Genomics-based scRNA-seq of CellTagged (n=3,943 cells) and non-tagged control cells (n=2,067 cells). Cells were clustered using Seurat, resulting in a t-SNE plot with 6 clusters of transcriptionally distinct cells. CellTagged and control cells were evenly distributed across these populations. (b) The CellTagged B-cell population expresses a mean of 3.5±0.02 CellTags per cell. (c) We detect no observable differences in numbers of genes or unique molecular identifiers (UMIs) per cell in either population. (d) Average gene expression values between CellTagged and control cells are highly correlated (r=0.999, Pearson’s correlation), demonstrating that our labelling approach does not induce significant changes in gene expression. These experiments were performed independently, twice, with similar results. (e) To assess the potential impact of CellTagging on reprogramming outcome, we induced lineage conversion of CellTagged cells in parallel with unlabelled, control cells, followed by three weeks of culture and processing on the Drop-seq platform (n=773 cells passing quality control). A mean of 3.3±0.09 CellTags per cell are expressed in a labelled reprogrammed cell population. (f) There are no observable differences in numbers of genes or UMIs per cell in either the labelled or unlabelled populations. (g) Average gene expression values between CellTagged and control cells are highly correlated (r =0.98, Pearson’s correlation), again demonstrating that our labelling approach does not induce significant changes in gene expression. (h) Seurat clustering of cells, where cells in fibroblast (Col1a2-high), transition, and fully-reprogrammed (Apoa1-high) states can be identified. Right panel: CellTagged and control cells are distributed fairly evenly across these reprogramming stages. Some variation is expected between these independent biological replicates. These experiments were performed independently, twice, with similar results.
Extended Data Figure 3.
Extended Data Figure 3.. scRNA-seq metrics and quality control of cell clustering.
(a) Numbers of genes and UMIs per cell for 10x Genomics-based (Timecourse 1, n=30,733 cells and timecourse 2: n=54,277 cells) and Drop-seq-based (Timecourse 3, n=5,932 cells and timecourse 4: n=5,414 cells) reprogramming timecourses. In these cross-platform comparisons, we apply more stringent filtering of Drop-seq data to include only those cells with 1000 or more UMIs. For Drop-seq experiments, with a cell capture rate of 5%, 2×10⁶ MEFs were initially seeded for reprogramming. For 10x Genomics experiments, with a cell encapsulation rate of up to 60%, 5×10⁵ MEFs were initially seeded for reprogramming. (b) Mean numbers of UMIs per cell (5,570±2.2), at each captured timepoint during reprogramming, in two independent biological replicates (10x Genomics, timecourses 1 and 2): Cells were captured at days 3, 6, 9, 12, 15, 21, and 28, along with the initial MEF population (day 0). (c) Average gene expression values between 10x Genomics replicates, and Drop-seq replicates are highly correlated at day 0, demonstrating technical consistency (r=0.99, and r=0.98, respectively, Pearson’s correlation). (d) Alignment of independent 10x Genomics replicates (Timecourses 1 and 2) with Drop-seq replicates (Timecourses 3 and 4) via canonical correlation analysis. Left panels: Expression of MEF marker, Col1a2. Right panel: iEP marker, Apoa1. Overlay of data from these two sources demonstrates a high level of technical and biological consistency between the two technologies. (e) Alignment of 10x Genomics replicates (Timecourse 1 and 2) via canonical correlation analysis. Left panels: Expression of fibroblast marker, Col1a2. Right panel: iEP marker, Apoa1. Integration of these two replicates demonstrates a high level of technical and biological consistency. (f) Projections of cell cycle phase and UMIs per cell onto t-SNE alignment of timecourses 1 and 2 shows that clustering is independent of these factors. (e) Reprogramming factor expression (via detection of bicistronic Foxa1-t2a-Hnf4α transgene expression) and CellTag expression across timecourses 1 and 2.
Extended Data Figure 4.
Extended Data Figure 4.. CellTag expression metrics.
(a) Mean counts of CellTags expressed per cell, following whitelisting and filtering for timecourses 1 (n=19,581 cells passing filtering) and 2 (n=38,943 cells passing filtering), broken down by timepoint and CellTag version. Red dashed lines denote time of CellTag introduction. (b) Mean number of CellTags expressed per cell, post-whitelisting and filtering, for each round of CellTagging across timecourses 1 and 2. CellTagMEF: 3.4±0.01 CellTags per cell, n=37,612 cells. CellTagD3: 4.5±0.02 CellTags per cell, n=32,176 cells. CellTagD13: 3.2±0.02 CellTags per cell, n=10,212 cells. 65% of sequenced cells pass the ≥2 CellTag expression threshold to support tracking. (c) Mean CellTags per cell following whitelisting and filtering for both Drop-seq timecourses, broken down by timepoint. All cells with 200 or more genes were included in this analysis (Timecourse 1: n=10,038 cells, timecourse 2: n=9,839 cells). CellTags were introduced only in MEFs, prior to reprogramming in these experiments. In Drop-seq timecourses, we detected a mean of 7.8±0.07 CellTags per cell, across 61% of cells (12,086/19,877 cells) passing the tracking threshold.
Extended Data Figure 5.
Extended Data Figure 5.. Assignment of cluster identities based on mRNA and protein expression.
(a) Top enriched gene expression associated with each cluster, projected onto the reprogramming t-SNE plot (n=85,010 cells). (b) Left panel: Expression of the fibroblast marker, Col1a2, projected onto the t-SNE plot. Upper right panel: Violin plot of Col1a2 expression levels in each cluster. Lower right panel: Violin plot of Apoa1 expression levels in each cluster, ordered by gain of expression over the course of reprogramming. Clusters are classified as one of four reprogramming stages: Clusters 5, 6, 7, 11 = Fibroblast. Clusters 0, 3 = Early Transition. Clusters, 1, 4, 8, 9,10,12 = Transition. Cluster 2 = Reprogrammed. Apoa1 is not expressed in the fibroblast clusters. (c) Upper panel: Expression of the previously reported iEP marker, Cdh1 (E-Cadherin),, projected onto the t-SNE plot, highlighting the location of fully reprogrammed cells. Lower panel: Staining of CDH1 protein in iEP colonies emerging following three-weeks of reprogramming (control shown from Fig.4d). Scale bar=20mm. (d) Upper panel: Expression of the novel iEP marker, Apolipoprotein A1, Apoa1, projected onto the t-SNE plot. Lower panel: Immunofluorescent staining and imaging of APOA1 protein in an iEP colony, emerging following three-weeks of reprogramming. APOA1 (red) is localized to vesicles. This is a representative image selected from five independent biological replicates. Scale bar=20μM. (e) Upper panel: Co-expression of Apoa1 and Cdh1, within the same individual cells at the transcript level in the fully reprogrammed cluster confirms Apoa1 as a marker of iEP emergence. Lower panel: Immunofluorescent co-staining and imaging of APOA1 and CDH1 protein in iEPs. White arrows mark emerging iEP colonies co-expressing these two proteins. APOA1 expression (red) is found localized to vesicles of CDH1-positive cells (green), where the most intense CDH1 staining is observed at cell-cell junctions. This is a representative image selected from two independent biological replicates. Scale bar=20μM.
Extended Data Figure 6.
Extended Data Figure 6.. Combinatorial CellTagging to identify clonally-related cells.
(a) Heatmap showing scaled expression of individual CellTags in 20 major clones called from CellTagD3-labelled cells (n=10 representative cells per clone, timecourses 1 and 2). Dashed yellow line marks separation between the two timecourses. Dashed red lines mark separation between independent clones. Although some CellTags are shared between these independent biological replicates, the combined CellTag signatures are unique. (b) Expression levels of individual CellTags per cell over three weeks in a representative clone labelled by 4 unique CellTags. Expression diminishes over time, but is not completely silenced. (c) To assess CellTag silencing we selected 10 major clones (n=6,728 cells), defining the intact CellTag signature for each clone at reprogramming day 6. We then assess loss, or ‘dropout’ of CellTags from each signature over the timecourse, to day 28. By week 4, expression of an individual CellTag ‘drops-out’ in 1 out of 10 cells - i.e. expected CellTag expression was not detected in 11±2% of cells. Conversely, CellTag expression is retained in almost 90% of cells by day 28. Later rounds of CellTagging (CellTagD13) are less prone to this effect, with CellTags dropping out in only 3±1.5% of cells. (d) We mapped CellTag expression across four representative clones, where expression of each CellTag is plotted over time. The y-axis denotes the percentage of cells within each clone where specific CellTag expression has dropped out. Typically, only one CellTag exhibits dropout, where expression of the other CellTags is maintained. We do not observe complete silencing, i.e. loss of expected CellTag expression in 100% of cells. This demonstrates the advantage of our CellTag combinatorial indexing method to reliably label cells and track them over an extended period of time. For example, reliance on the expression of a single, longer barcode would not be effective following integration into a region that later becomes silenced.
Extended Data Figure 7.
Extended Data Figure 7.. Visualizing growth of clones and gene expression correlation within clones.
(a) Connected barplots showing individual clones as a proportion of all clones called at each reprogramming timepoint for timecourse 2, for each round of CellTagging (n=14,088 cells across 1,120 clones). Connected bars denote clonal expansion and growth over time. (b) Average number of cells per clone, per timepoint, for each round of CellTag labelling (timecourse 2, n=1,120 clones). (c) Number of clones detected at each timepoint, for each round of CellTagging over reprogramming timecourse 1 (n=1,031 clones) and 2 (n=1,120 clones). The number of clones detected gradually increases over time as probability of capture increases with clonal growth. The number of clones then begins to decrease as the growth of some individual clones outcompetes other clones which are lost from the population over time. (d) Connected barplots showing individual clones as a proportion of all clones called at each reprogramming timepoint for Drop-seq replicates 1 (n=103 clones) and 2 (n=37 clones). In replicate 2, a single clone progressively dominates the culture over 10 weeks of growth. In our viral integration analyses shown in Supplementary Table 5, we detect three viral integration sites in the cells of this clone. We did not detect any differential expression of genes proximal to these integration sites. Similarly, analysis of gene expression enrichment in 12 dominant clones across two biological replicates does not reveal any common signature of these clones to explain their rapid expansion (data not shown). This suggests that the clonal growth we observe is a normal part of the iEP reprogramming process, where the cells enter a progenitor-like state. Even so, these analyses do not exclude the acquisition of genetic and epigenetic changes endowing these expanding clones with increased fitness. (e) Correlation of Principal Component Analysis (PCA) scores in clonally-related cells (clone 2315, n=58 cells), relative to a random sampling of cells. Correlation between PC scores was used as a proxy for transcriptional similarity between cells. Clonally related cells were much more closely correlated, relative to randomly selected cells. (f) Quantification of correlation analysis for all timecourse 2 clones consisting of 10 cells or more, for CellTagMEF (n=78 clones, 3,963 cells) and CellTagD3-labelled clones (n=109 clones, 6,265 cells). Mean correlation scores for clonally-related cells are significantly higher than random cell groupings (p<0.001, t-test, one-sided). We tagged cells both before and after the 72hr reprogramming window, expecting much heterogeneity to be introduced via serial viral transduction. On the contrary, there is only a slight but insignificant increase in PCA correlation between CellTagMEF and CellTagD3-labelled, clonally-related cells.
Extended Data Figure 8.
Extended Data Figure 8.. Reconstruction and visualization of lineages via force-directed graph drawing.
(a) Force-directed graph of all clonally-related cells and lineages reconstructed from timecourse 1 (1,031 clones, 12,932 cells) and (b) timecourse 2 (1,120 clones, 14,088 cells). All lineages and clone distributions can be interactively explored via our companion website, CellTag Viz (http://www.celltag.org/). (c) In this tree, we follow CellTagMEF clone 487 from timecourse 1, and its descendants. Each node represents an individual cell, and edges represent clonal relationships between cells. Purple = CellTagMEF clone, Blue = CellTagD3 clones, Yellow = CellTagD13 clones. In the lineage highlighted in red, we follow the CellTagMEF clone (n=678 cells), branching into two CellTagD3 lineages (clone 204 (n=363 cells) and clone 240 (n=260 cells)). (d) Contour plots, representing cell density of each clone, projected onto the t-SNE plot, for the lineage shown in (a). Upper left: Cells belonging to clone 487 (CellTagMEF). Clones 204 and 240 (CellTagD3) descend from this first clone, exhibiting a high degree of overlap within 2D-space, on the t-SNE plot. An unrelated CellTagD3 clone, 329 (n=38 cells), does not overlap with this lineage, demonstrating the high similarity between cells belonging to the same lineage.
Extended Data Figure 9.
Extended Data Figure 9.. Mapping reprogramming trajectories and timing of cell fate decisions.
(a) Projection of all clones (yellow, n=2,151 clones, 27,020 cells) across reprogramming timecourses 1 and 2 (n=85,010 cells). Clusters with the highest density of detected clones, outlined in red (clusters 0, 1, 2, 4, 8, and 12) were subsetted from this larger dataset and re-clustered to generate a higher-resolution t-SNE plot, focusing on reprogramming days 6 to 28 (n=48,515 cells). (b) Left panel: original cluster identities of all cells (n=85,010 cells). Right-panel: subset of 48,515 cells, colored by original cluster identity. (c) Contour plots of iEP-depleted clone distribution (upper panels, (n=7 clones, 1,037 cells) and iEP-enriched clone distribution (lower panels, (n=7 clones, 2,270 cells) broken down by reprogramming day, and across days 9–28 (right panels). These specific clones were selected from the larger iEP-depleted and -enriched group as they had cells distributed across all timepoints to enable definition of the trajectories. Via these distributions, clusters 8, 4 and 3 are iEP-depleted, thus representing the dead-end trajectory. Conversely, clusters 2, 6 and 1 are iEP-enriched, representing the reprogramming trajectory. These trajectories divide cluster 0 into two halves, although re-clustering does not offer any higher resolution (data not shown). Deeper sequencing of more cells may provide further insights into this cluster in future. (d) Monocle2 psuedotemporal ordering of subsetted cells (n=48,515 cells), colored by day of reprogramming (left panel), Seurat cluster ID (middle panel) and Apoa1 expression (right panel). Monocle2 uses dimension reduction to represent each single-cell in 2D space and effectively ‘connects-the-dots’ to construct a differentiation trajectory. In this analysis, we performed semi-supervised ordering using Col1a2 (marking fibroblast identity) expression as a start point and Apoa1 expression (marking iEP identity) as an endpoint. Here, the branched trajectory generated by monocle is in general agreement with our clonal analyses. (e) Restriction of CellTagD13 clones (timecourse 1, n=79 clones, 240 cells, timecourse 2, n=30 clones, 148 cells) to either the reprogrammed cluster (cluster 1), or the dead-end cluster (cluster 3) at day 28. 88±8% of clones from these two biological replicates exhibit adherence to one of these trajectories by day 13 of reprogramming. (f) We identified lineages where multiple CellTagD3-labelled clones share a common CellTagD0-labelled ancestor. The proportion of each clone on the reprograming trajectory (defined as occupancy of clusters 2, 6, and 1 on the subsetted t-SNE plot), and proportion of each clone on the dead-end trajectory (defined as occupancy of clusters 8, 4, and 3) was calculated. We then plotted the proportion of each CellTagD3-labelled clone on the reprogramming trajectory against that of its CellTagD3-labelled descendants (r=0.71, Pearson’s correlation, n=13 lineages, 57 clones, 6,035 cells).
Extended Figure 10.
Extended Figure 10.. Reprogramming trajectory-enriched gene expression: Mettl7a1 expression promotes iEP generation.
(a) Violin plots of significantly different gene expression between reprogramming and dead-end trajectories (n=2,074 cells). Wnt4 and Spint2 expression is significantly upregulated along the reprogramming trajectory (p<0.001, permutation test, one-sided, n=1,037 cells). Dlk1 and Peg3 expression is significantly upregulated along the dead-end trajectory (p<0.001, permutation test, one-sided, n=1,037 cells). Expression of the Foxa1-Hnf4α transgene is significantly downregulated along the dead-end trajectory (p<0.001, permutation test, one-sided, n=1,037 cells). (b) Projection of gene expression onto the t-SNE plot (n=48,515 cells). (c) Mean numbers of genes and transcripts per cell following 10x Genomics-based scRNA-seq analysis: Foxa1-Hnf4α reprogrammed cells (n=6,559 cells) and Foxa1-Hnf4α-Mettl7a1 reprogrammed cells (n=10,161 cells), harvested 14 days after initiation of reprogramming. For subsequent analyses, the Foxa1-Hnf4α-Mettl7a1 experimental group was randomly downsampled for direct comparison to the Foxa1-Hnf4α experimental group (n=6,559 cells for both groups). (d) Via canonical correlation analysis, the Foxa1-Hnf4α and Foxa1-Hnf4α-Mettl7a1 scRNA-seq datasets were merged with cells from timecourse 2, to help place these two experimental groups within these previously defined trajectories. Expression levels of Apoa1 are projected onto this t-SNE plot. (e) Confirmation of Mettl7a1 expression, by qPCR, following transduction of cells with Foxa1-Hnf4α-GFP vs. Foxa1-Hnf4α-Mettl7a1 retroviruses (**p=5.3×10⁻³, t-test, one-sided). (f) Violin plot of mean Apoa1 expression in Foxa1-Hnf4α, and Foxa1-Hnf4α-Mettl7a1 reprogrammed cells. Addition of Mettl7a1 to the reprogramming cocktail results in a significant increase in Apoa1 expression, supporting observations that this factor increases the yield of fully reprogrammed cells (p<0.001, permutation test, one-sided). (g) Plot of identity scores of Foxa1-Hnf4α (purple) and Foxa1-Hnf4α-Mettl7a1 (green) reprogrammed cells, where cells are ordered according to an increase in iEP identity. Red dashed line indicates a cutoff of 0.75, where above this score cells are considered as iEPs. 3-fold more Foxa1-Hnf4α-Mettl7a1 cells classify as iEPs, relative to Foxa1-Hnf4α cells, represented as a significant increase in iEP score (p<0.001, permutation test, one-sided). (h) Boxplot of mean CellTag expression between Foxa1-Hnf4α (3±0.05 CellTags per cell) and Foxa1-Hnf4α-Mettl7a1 (2.5±0.04 CellTags per cell) experimental groups. (i) Boxplot of cells per clone for Foxa1-Hnf4α and Foxa1-Hnf4α-Mettl7a1 experimental groups, following data processing via our CellTag demultiplexing and clone calling pipeline. Clone size does not significantly differ between these two groups: Foxa1-Hnf4α, 6±0.4 cells per clone (n=99 clones, 595 cells), Foxa1-Hnf4α-Mettl7a1: 6.3±0.65 cells per clone (n=43 clones, 277 cells), demonstrating that addition of Mettl7a1 enhances iEP yield via an increase in the number of unique reprogramming events. For comparison, average clone size at ~ day 14 for timecourse replicates 1 and 2 is ~ 8 cells per clone.
Figure 1.
Figure 1.. CellTagging: clonal tracking applied to reprogramming.
(a) CellTagging workflow: A lentiviral construct contains an 8bp random ‘CellTag’ barcode in the 3’UTR of GFP, followed by an SV40 polyadenylation signal. Transduced cells express unique CellTag combinations, resulting in distinct, heritable signatures, enabling tracking of clonally-related cells. (b) Representative CellTag expression in two clones, defined by unique combinations of three CellTags (n=10 cells per clone). (c) Left: Overlap of individual CellTags in two independent biological replicates tagged with the same CellTag library. Right: CellTag signatures are not shared between the two replicates (replicate 1: n=8,535 cells; replicate 2: n=11,997 cells). (d) Experimental approach: Mouse Embryonic Fibroblasts (MEFs) are tagged with the CellTagMEF library, expanded for two days and then split for reprogramming in two independent biological replicates. Additional tagging was performed at 3 days (CellTagD3) and 13 days (CellTagD13) post-initiation of reprogramming. Every 3–7 days, cells were harvested for scRNA-seq with the remainder replated. (e) Visualization of scRNA-seq data: projection of timepoint onto t-distributed stochastic neighbor embedding plot (t-SNE, timecourses 1 and 2: n=85,010 cells. (f) Scoring single-cell identity via quadratic programming, cells scoring >0.75 (upper red line) classify as iEPs, cells scoring <0.25 (lower red line) classify as fibroblasts (n=85,010 cells). (g) Left: Projection of identity scores onto the t-SNE plot. Right: t-SNE cluster designations: Fibroblast, Early Transition, Transition, and Reprogrammed.
Figure 2.
Figure 2.. Tracking reprogramming clonal dynamics and constructing lineage trees.
(a) Connected barplots showing individual clones as a proportion of all clones over reprogramming, for each CellTagging round (Timecourse1, n=12,932 cells, 1,031 clones). (b) Average number of cells per clone, per timepoint, for each round of CellTagging (n=1,031 clones). (c) Reconstruction and visualization of lineages via force-directed graph drawing. Each node represents an individual cell, and edges represent clonal relationships between cells: Purple=CellTagMEF, Blue=CellTagD3, Yellow=CellTagD13 clones. (d) Contour plots, representing cell density of each clone, projected onto the t-SNE, for the red highlighted lineage in (c) (n=2,199 cells). All lineages and clone distributions can be explored via CellTag Viz (http://www.celltag.org/).
Figure 3.
Figure 3.. Mapping reprogramming trajectories and timing of cell fate commitment.
(a) Apoa1 expression in a subset of cells from timecourses 1 and 2 (n=48,515 cells); fully reprogrammed iEPs outlined in red (cluster 1). (b) Density plot of the mean proportion of reprogrammed cells for groups of randomly-selected cells (defined by cluster 1 occupancy, n=59 groups, 14,987 cells). Randomized testing of 59 CellTagMEF/D3 clones (>35 cells per clone, n=10,259 cells) identifies iEP-enriched clones (n=20 clones, 6,128 cells, p<0.05) and iEP-depleted clones (n=24 clones, 3,117 cells, p<0.05). (c) Clones spanning all timepoints were selected for further analysis: trajectories showing connections between areas of highest clonal density across each day of reprogramming, for iEP-depleted (left, n=7 clones, 2,270 cells) and iEP-enriched clones (right, n=7 clones, 1,037 cells). (d) Pseudo-temporal ordering of the timecourse 1 and 2 subset (a), with overlay of individual cells belonging to iEP-enriched and iEP-depleted clones, defining reprogramming and dead-end trajectories (n=14 clones, 3,307 cells). (e) Proportions of clones occupying clusters 6 and 7 (reprogramming-transition) or cluster 4 (dead-end-transition) at reprogramming day 21 (r =−0.84, Pearson’s correlation, n=44 clones, 9,624 cells). (f) Lineage trees of related clones, with the proportion of each clone contributing to reprogramming or dead-end trajectories shown (n=1,185 cells).
Figure 4.
Figure 4.. Molecular hallmarks of reprogramming trajectories.
(a) Identity scores of cells on the reprogramming (left, n=7 clones, 1,037 cells) and dead-end trajectories (right, n=7 clones, 1,037 cells, random downsampling from 2,270 cells) from reprogramming days 6 to 28. Cells scoring >0.75 (upper red line) classify as iEPs, cells scoring <0.25 (lower red line) classify as fibroblasts. (b) Violin plots of significantly different (p<0.001, permutation test, one-sided) gene expression between reprogramming and dead-end trajectories (n=14 clones, 2,074 cells). (c) Projection of Mettl7a1 and Col1a2 expression onto the t-SNE plot (n=48,515 cells). (d) Colony formation assay (CDH1/E-cadherin immunohistochemistry) for cells reprogrammed with Foxa1-Hnf4α, or Foxa1-Hnf4α-Mettl7a1. Scale bar=20mm. Blinded and automated colony quantification, (n=22 technical replicates, 3 independent biological replicates, p=8×10⁻⁵, t-test, one-sided). (e) Upper: scRNA-seq analysis of 6,559 Foxa1-Hnf4α reprogrammed cells and 6,559 (10,161 cells prior to random downsampling) Foxa1-Hnf4α-Mettl7a1 reprogrammed cells, 14 days post-reprogramming initiation. Lower: quantification of Foxa1-Hnf4α-Mettl7a1 reprogrammed cell distribution across reprogramming stages, represented by fold-change in distribution relative to Foxa1-Hnf4α cell distribution.

Comment in

  • Tagged reprogramming.
    Rusk N. Rusk N. Nat Methods. 2019 Feb;16(2):144. doi: 10.1038/s41592-019-0320-3. Nat Methods. 2019. PMID: 30700894 No abstract available.

References

    1. Vierbuchen T & Wernig M Direct lineage conversions: unnatural but useful? Nat. Biotechnol 29, 892–907 (2011). - PMC - PubMed
    1. Cahan P et al. CellNet: Network Biology Applied to Stem Cell Engineering. Cell 158, 903–915 (2014). - PMC - PubMed
    1. Morris SA et al. Dissecting Engineered Cell Types and Enhancing Cell Fate Conversion via CellNet. Cell 158, 889–902 (2014). - PMC - PubMed
    1. Buganim Y et al. Single-Cell Expression Analyses during Cellular Reprogramming Reveal an Early Stochastic and a Late Hierarchic Phase. Cell 150, 1209–22 (2012). - PMC - PubMed
    1. Treutlein B et al. Dissecting direct reprogramming from fibroblast to neuron using single-cell RNA-seq. Nature (2016). doi:10.1038/nature18323 - DOI - PMC - PubMed

Publication types