. 2019 Mar;38(13):2380-2393.
doi: 10.1038/s41388-018-0581-9. Epub 2018 Dec 5.

Cisplatin-induced immune modulation in ovarian cancer mouse models with distinct inflammation profiles

Affiliations

Cisplatin-induced immune modulation in ovarian cancer mouse models with distinct inflammation profiles

Shannon Grabosch et al. Oncogene. 2019 Mar.

Abstract

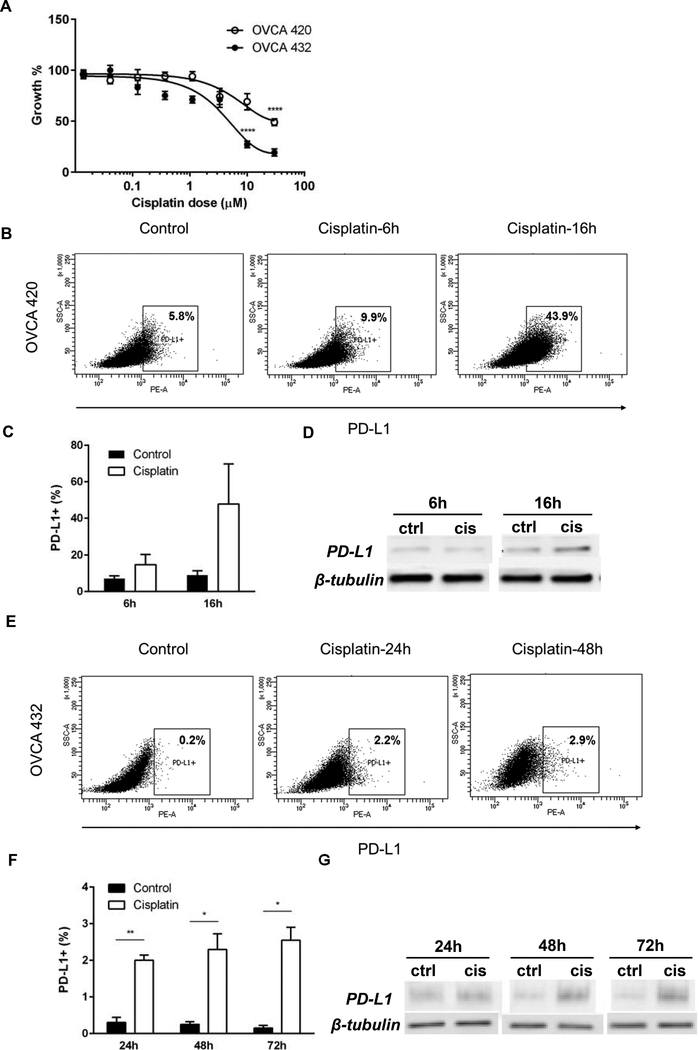
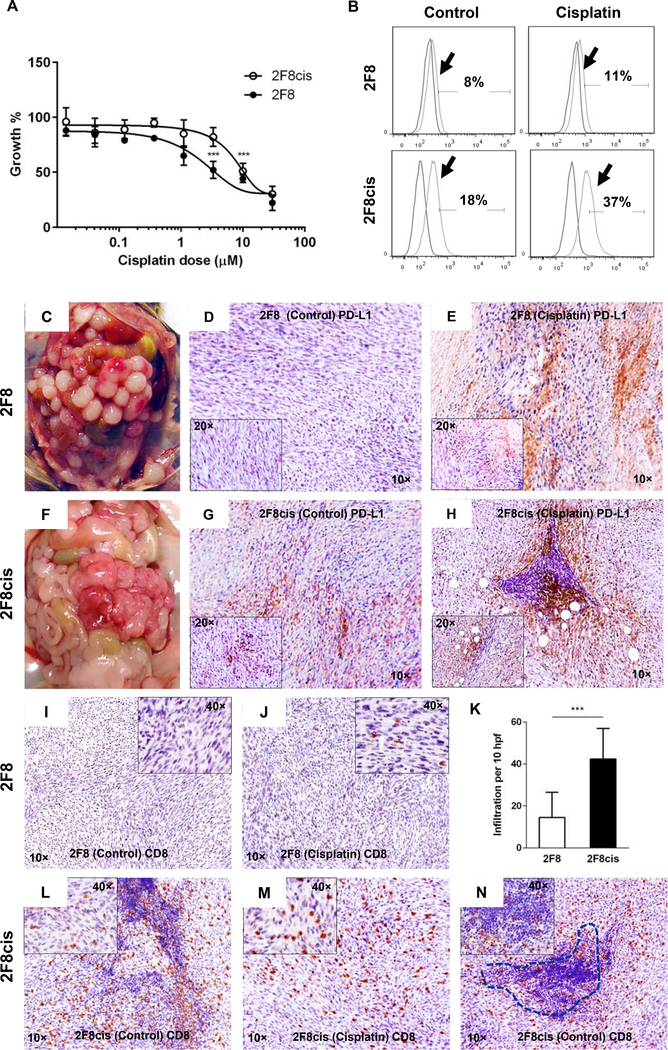
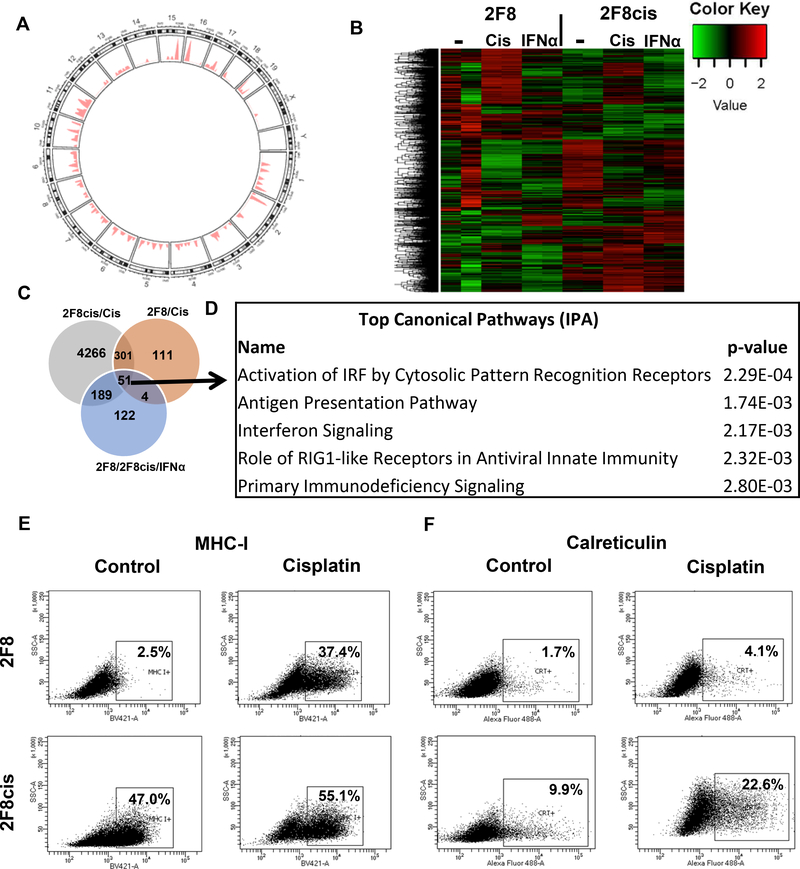
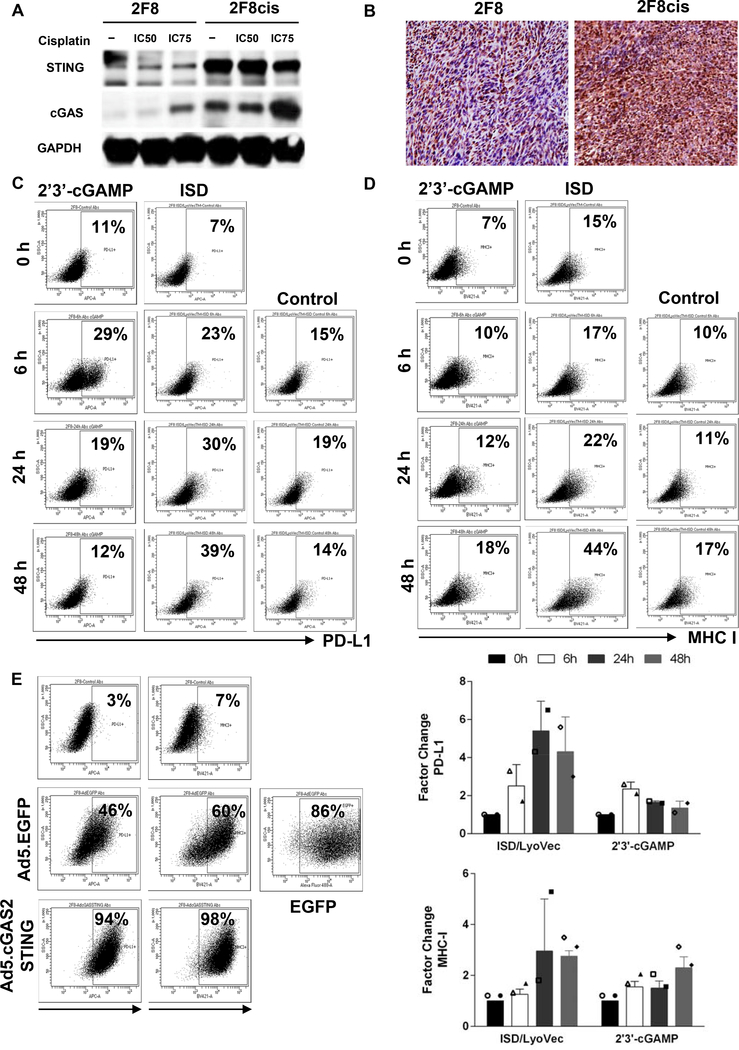
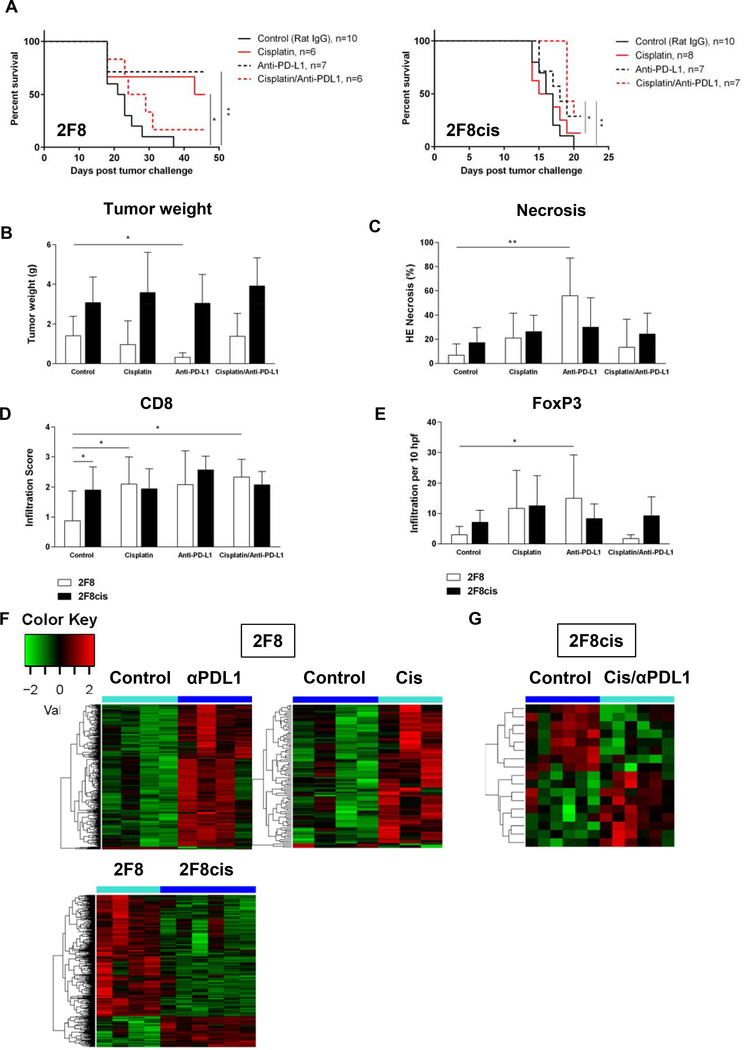
The backbone of ovarian cancer treatment is platinum-based chemotherapy and aggressive surgical debulking. New therapeutic approaches using immunotherapy via immune checkpoint blockade, which have demonstrated clinical efficacy in other tumor types, have been less promising in ovarian cancer. To increase their clinical efficacy, checkpoint inhibitors are now being tested in clinical trials in combination with chemotherapy. Here, we evaluated the impact of cisplatin on tumor immunogenicity and its in vivo roles when used alone or in combination with anti-PD-L1, in two novel murine ovarian cancer cell models. The 2F8 and its platinum-resistant derivative 2F8cis model, display distinct inflammatory profiles and chemotherapy sensitivities, and mirror the primary and recurrent human disease, respectively. Acute and chronic exposure to cisplatin enhances tumor immunogenicity by increasing calreticulin, MHC class I, antigen presentation and T-cell infiltration. Cisplatin also upregulates PD-L1 expression in vitro and in vivo, demonstrating a dual, paradoxical immune modulatory effect and supporting the rationale for combination with immune checkpoint blockade. One of the pathways activated by cisplatin treatment is the cGAS/STING pathway. Chronic cisplatin treatment led to upregulation of cGAS and STING proteins in 2F8cis compared to parental 2F8 cells, while acute exposure to cisplatin further increases cGAS and STING levels in both 2F8 and 2F8cis cells. Overexpression of cGAS/STING modifies tumor immunogenicity by upregulating PD-L1, MHC I and calreticulin in tumor cells. Anti-PD-L1 alone in a platinum-sensitive model or with cisplatin in a platinum-resistant model increases survival. These studies have high translational potential in ovarian cancer.


Conflict of interest statement

Conflict of Interests

Authors have no conflict of interest.

Figures

Fig. 1
Fig. 1
(A) Cisplatin dose response growth curves of OVCA432 (open circles) and OVCA420 human EOC cells (black circles). Measurements at 48 h were obtained via MTT assay and were performed in triplicate. SD bars are shown (**** p<0.0001, Student t test.) (B, E) PD-L1 expression in OVCA420 and OVCA432 cells (B and E, respectively), treated with cisplatin IC50 at various time points.Gates were set according to isotype control . (C, F) Percentages of PD-L1 positive OVCA420 (C) and OVCA432 (F) cells in culture, in the absence (control) or presence of IC50 cisplatin, at various time points. Averages of percentages from two separate experiments are shown. (D, G) PD-L1 detection in cell lysates from OVCA420 (D) and OVCA432 cells (G), by Western blot. Cells were treated with IC50 cisplatin, for the time shown. Beta-tubulin was used as loading control.
Fig. 2.
Fig. 2.
(A) Dose response curves of mouse 2F8 (black circles) and 2F8cis cells ( open circles) treated with cisplatin for 48 h. (B) Flow cytometry showing histograms for PD-L1 expression (arrows) in 2F8 (top) and 2F8cis cells (bottom). Isotype control curves were used for gating. Percentages represent PDL1 positive cells. (C, F) Intraperitoneal tumor challenge with 2F8 (C) and 2F8cis cells (F) leads to extensive peritoneal carcinomatosis. (D, G, E, H) Tissue PD-L1 expression detected by IHC in untreated 2F8 (D) and 2F8cis tumors (G) and after cisplatin treatment (E and H, respectively). Images were acquired at 10x; insets in D and E represent images at 20x. (I-N) IHC dentification of CD8 T cells in 2F8 (I, J) and 2F8cis tumors (L-N) via IHC, before (I, L) and after cisplatin treatment (J, M). (K) Average CD8 T cell counts per 10 high power fields (hpf) and SD, in 2F8 and 2F8cis tumors. P<0.001 Student t test. (N) CD8 T cells inside the tumor mass and within a tertiary lymphoid-like structure (dotted line) in a representative 2F8cis tumor.
Fig. 3.
Fig. 3.
(A) Somatic point mutations (n=202) identified in 2F8cis cells, using 2F8 cells as reference. The genome-wide distribution of mutations is shown in a circos plot. The chromosomes are numbered and arranged in a circular orientation. The x-axis corresponds to the genomic regions by chromosome, the y-axis corresponds to the density/frequency of mutations in each chromosome. (B) Heat map of DE genes (n= 4074 selected genes, with greater than Q3 expression level and greater than Q3 variance) in 2F8 and 2F8cis cells, either untreated (−), exposed to cisplatin (cis) or IFNα. Samples were run in duplicate. (C) Venn diagram of DE genes. Grey circle represents DE genes upregulated by cisplatin treatment in 2F8cis cells compared to control treated. Brown circle represents the DE genes upregulated by cisplatin treatment in 2F8 cells, compared to control cells. Light blue circle represents DE genes commonly upregulated by IFNα in both 2F8 and 2F8cis cells.All genes are listed in Supplementary Table 2 (q<0.05) (D) Top 5 pathways identified via Ingenuity Pathway Analysis, using the common DE genes from the three-circle intersection (n=51 genes, listed in Suppl. Table 2). (E, F) MHC I (E) and calreticulin (F) detection via flow cytometry of 2F8 (top) and 2F8cis cells (bottom), either untreated (ctr) or exposed to IC50 cisplatin for 48 h. Percentages represent positive cells, using isotype control for gating. Results of at least three independent experiments are shown.
Fig. 4.
Fig. 4.
(A) Detection of cGAS and STING proteins by Western blot, using lysates from 2F8 and 2F8cis cells either untreated (−) or exposed to IC50 and IC75 cisplatin. GAPDH was used as loading control. (B) Detection of STING protein by IHC, in 2F8 (left) and 2F8cis tumors (right). (C, D) PD-L1 (C) and MHC I (D) detected by flow cytometry, following exposure of 2F8 cells to STING ligand 2’3’-cGAMP and ISD oligomer. Control indicates treatment with a non-immunostimulatory single-stranded oligonucleotide. (E) PD-L1 and MHC I expression detected by flow cytometry in 2F8 cells transduced with adenovirus encoding for cGAS/STING (Ad5.cGAS2ASTING) for 48 hours. Untreated and control adenovirus (Ad5.EGFP) treated cells are shown as reference. Percentages represent positive cells. Gates were set up based on staining with isotype control antibodies for each respective marker. EGFP positive cells indicate transfection efficiency. (F). Average expression of PD-L1(top) and MHC I (bottom) detected by flow cytometry in 2F8 cells following exposure to STING ligand 2’3’-cGAMP and ISD oligomer. Factor change represents the ratio of percent positive cells in the treatment group to control.The symbols represent measurements from separate experiments.
Fig. 5.
Fig. 5.
(A) Kaplan-Meier survival curves of mice injected IP with either 2F8 cells (left) or 2F8cis cells (right) and treated with either control antibody (solid black line), cisplatin (solid red line), anti-PD-L1- (dotted black line) or cisplatin/anti-PD-L1 combination (dotted red line). * p<0.05; ** p<0.005 (log-rank test). (B-E) Changes in tumor burden (B) necrosis areas (C), CD8 (D) and Foxp3 T cell infiltration (E) in mice with 2F8 (grey bars) and 2F8cis tumors (black bars). * p<0.05 Student t test. Average values for the group and SD are shown. (F, G) Heatmap of DE genes triggered by survival-increasing treatments in the 2F8 (F) and 2F8cis model (G). Up- and down-regulated genes are shown red and green, respectively. All genes shown in the heatmaps are listed in Suppl. Table 4. (H) Heatmap of DE genes in 2F8cis compared to 2F8 tumors. Genes are listed in Suppl. Table 6. All heatmaps use the scale shown in panel F.

References

    1. Siegel RL, Miller KD, Jemal A. Cancer Statistics, 2017. CA Cancer J Clin 2017; 67: 7–30. - PubMed
    1. Markman M, Bookman MA. Second-line treatment of ovarian cancer. Oncologist 2000; 5: 26–35. - PubMed
    1. NCI. SEER Cancer Facts: Ovarian Cancer 2007–2013.
    1. Le DT, Durham JN, Smith KN, Wang H, Bartlett BR, Aulakh LK et al. Mismatch-repair deficiency predicts response of solid tumors to PD-1 blockade. Science 2017. - PMC - PubMed
    1. McDermott DF, Drake CG, Sznol M, Choueiri TK, Powderly JD, Smith DC et al. Survival, Durable Response, and Long-Term Safety in Patients With Previously Treated Advanced Renal Cell Carcinoma Receiving Nivolumab. J Clin Oncol 2015; 33: 2013–2020. - PMC - PubMed

Publication types

MeSH terms