. 2018 Dec 1:15:39.
doi: 10.1186/s12014-018-9211-3. eCollection 2018.

The plasma peptidome

Affiliations

The plasma peptidome

Jaimie Dufresne et al. Clin Proteomics. .

Abstract

Background: It may be possible to discover new diagnostic or therapeutic peptides or proteins from blood plasma using LC-ESI-MS/MS to identify, with a linear quadrupole ion trap to identify, quantify and compare the statistical distributions of peptides cleaved ex vivo from plasma samples from different clinical populations.

Methods: A systematic method for the organic fractionation of plasma peptides was applied to identify and quantify the endogenous tryptic peptides from human plasma from multiple institutions by C18 HPLC followed nano electrospray ionization and tandem mass spectrometry (LC-ESI-MS/MS) with a linear quadrupole ion trap. The endogenous tryptic peptides, or tryptic phospho peptides (i.e. without exogenous digestion), were extracted in a mixture of organic solvent and water, dried and collected by preparative C18. The tryptic peptides from 6 institutions with 12 different disease and normal EDTA plasma populations, alongside ice cold controls for pre-analytical variation, were characterized by mass spectrometry. Each patient plasma was precipitated in 90% acetonitrile and the endogenous tryptic peptides extracted by a stepwise gradient of increasing water and then formic acid resulting in 10 sub-fractions. The fractionated peptides were manually collected over preparative C18 and injected for 1508 LC-ESI-MS/MS experiments analyzed in SQL Server R.

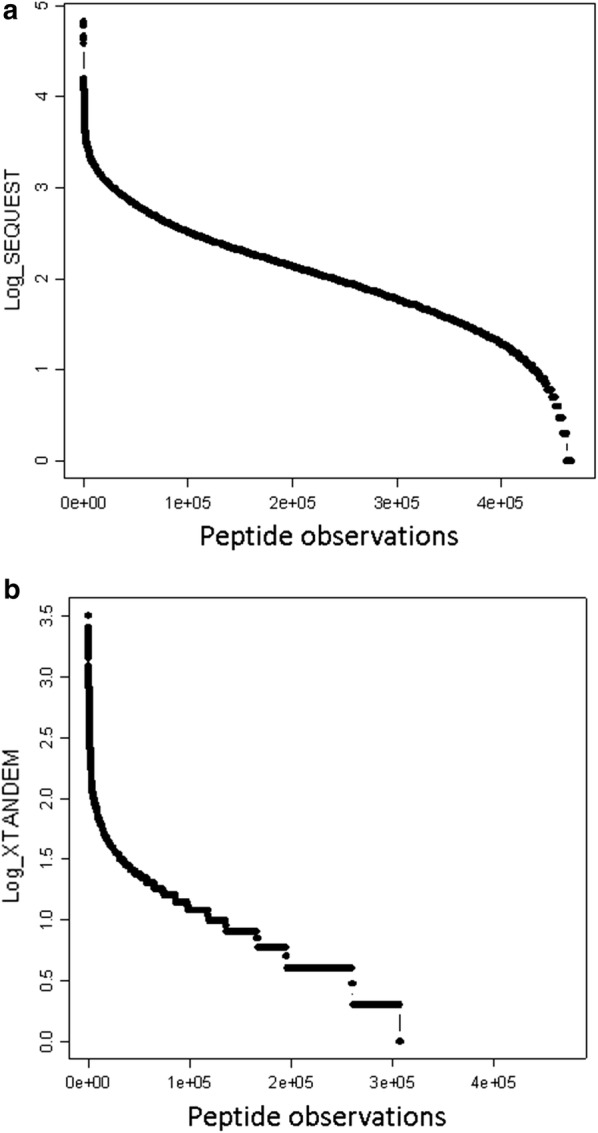
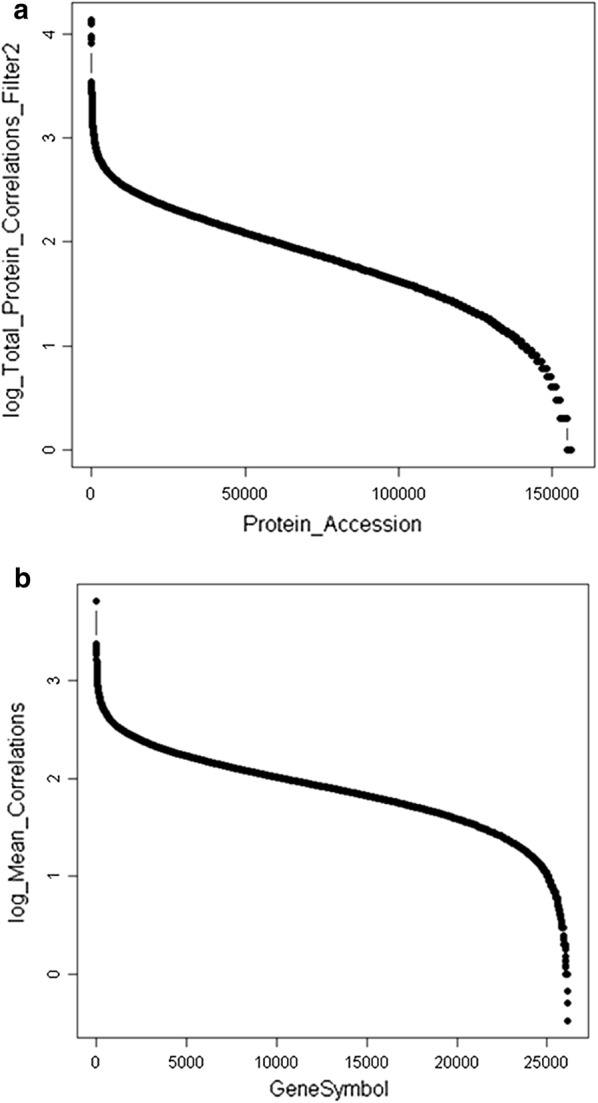
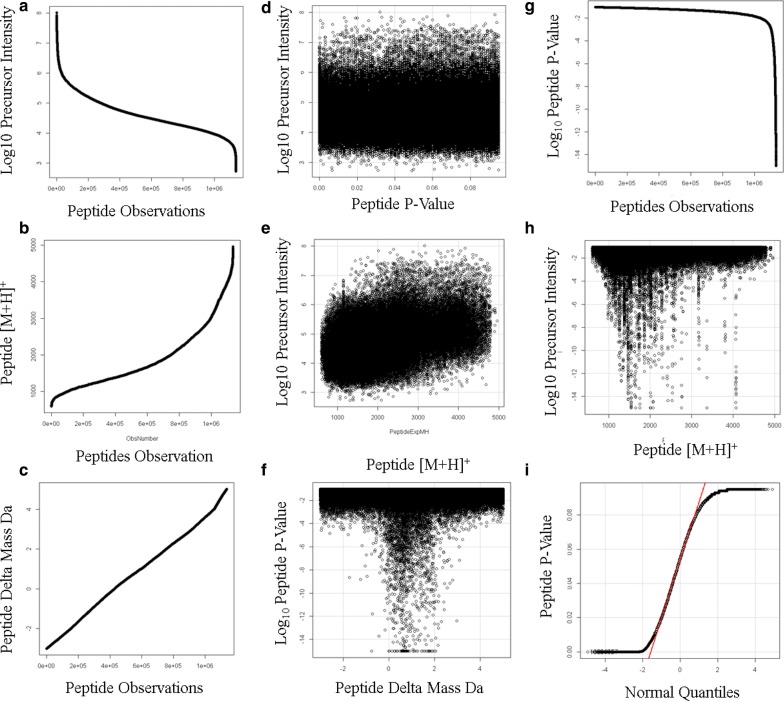
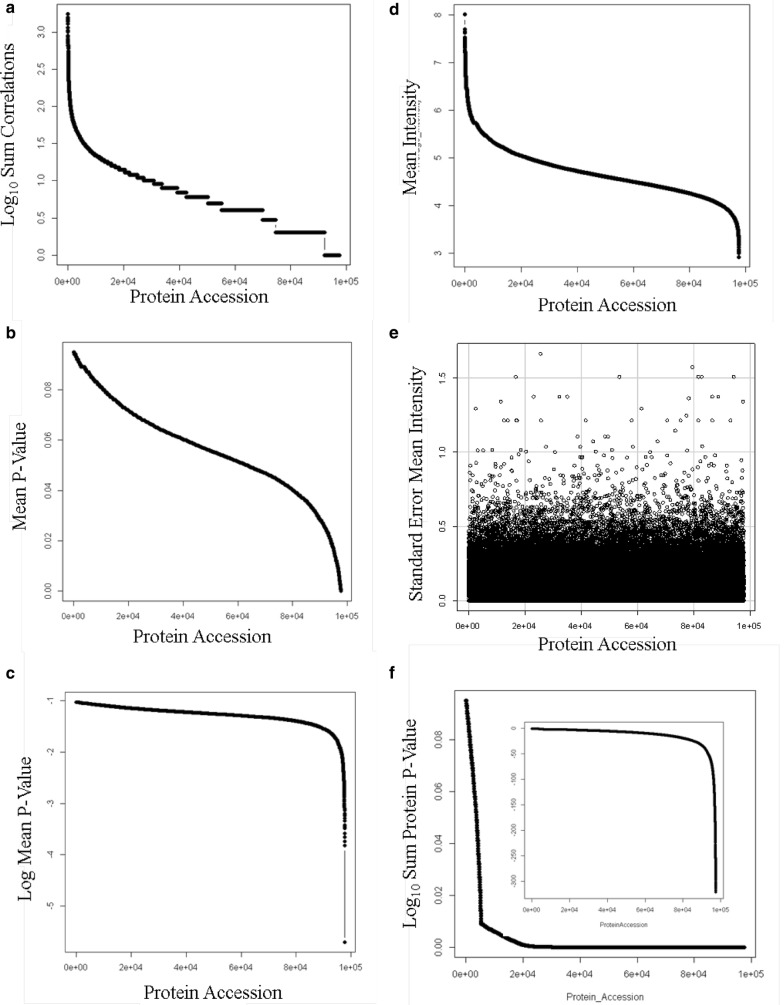
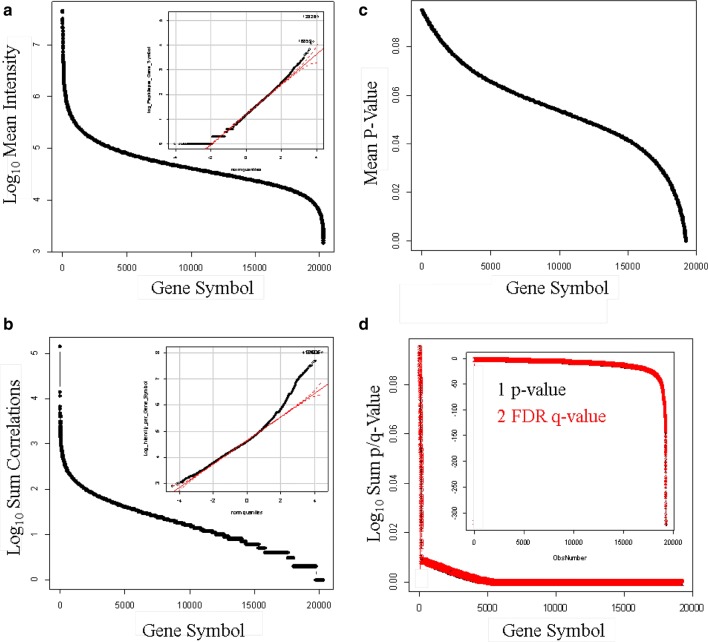
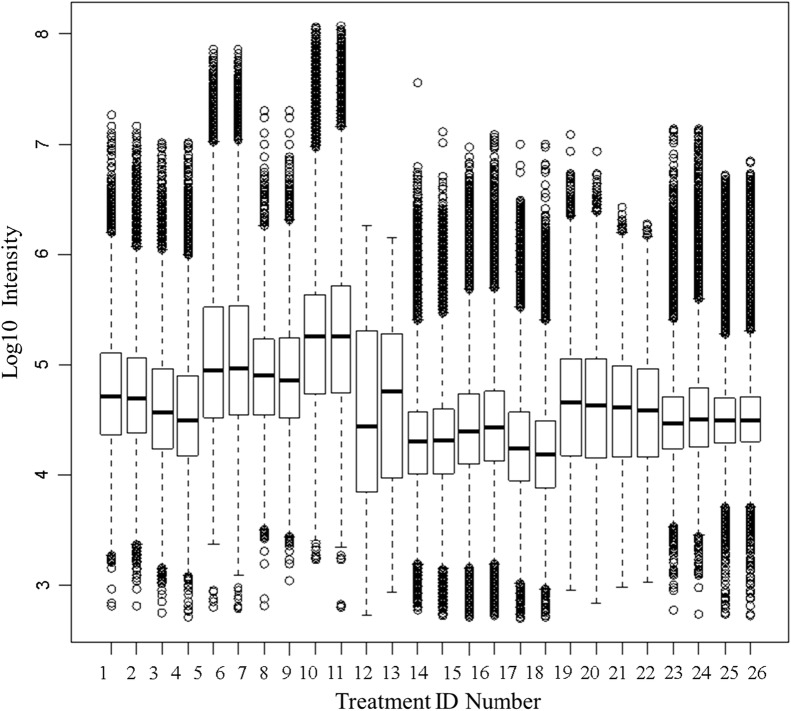
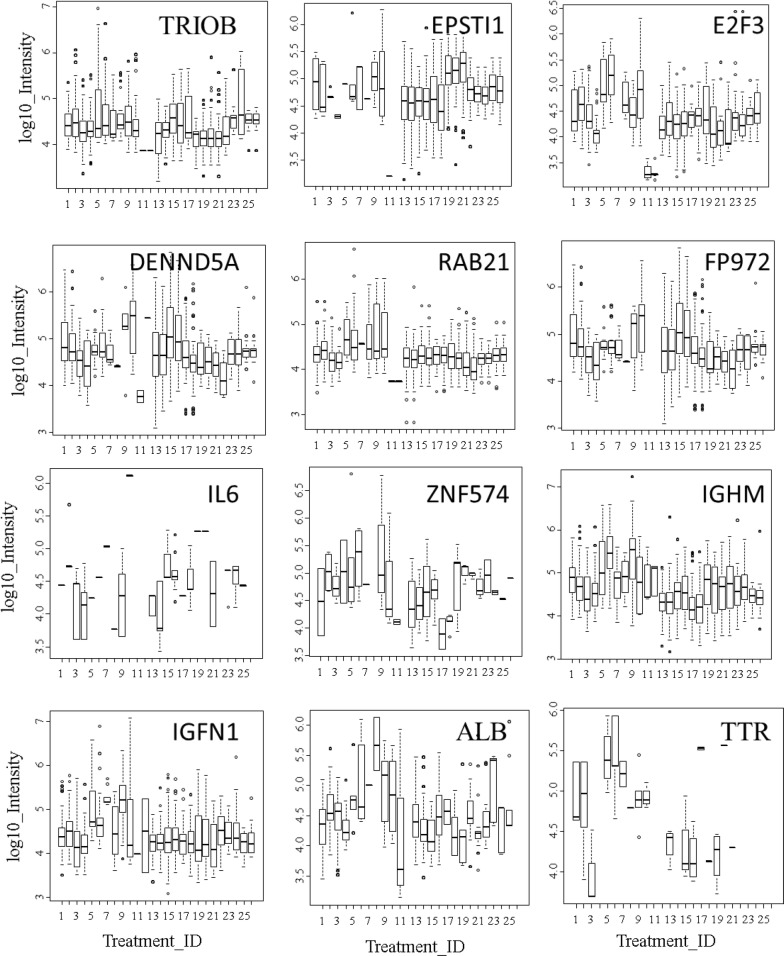
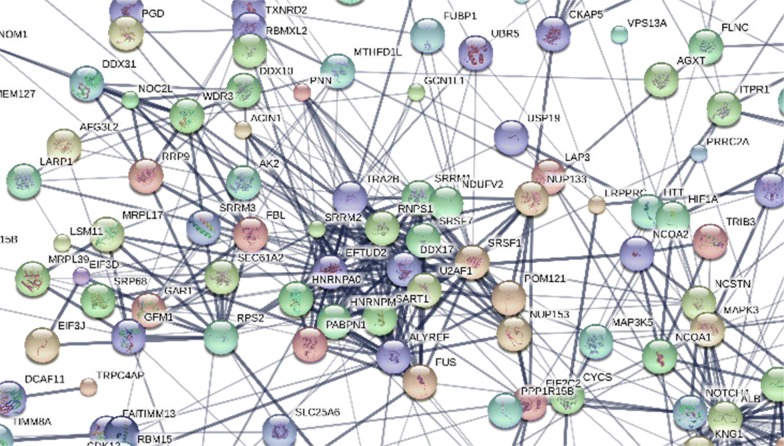
Results: Peptides that were cleaved in human plasma by a tryptic activity ex vivo provided convenient and sensitive access to most human proteins in plasma that show differences in the frequency or intensity of proteins observed across populations that may have clinical significance. Combination of step wise organic extraction of 200 μL of plasma with nano electrospray resulted in the confident identification and quantification ~ 14,000 gene symbols by X!TANDEM that is the largest number of blood proteins identified to date and shows that you can monitor the ex vivo proteolysis of most human proteins, including interleukins, from blood. A total of 15,968,550 MS/MS spectra ≥ E4 intensity counts were correlated by the SEQUEST and X!TANDEM algorithms to a federated library of 157,478 protein sequences that were filtered for best charge state (2+ or 3+) and peptide sequence in SQL Server resulting in 1,916,672 distinct best-fit peptide correlations for analysis with the R statistical system. SEQUEST identified some 140,054 protein accessions, or some ~ 26,000 gene symbols, proteins or loci, with at least 5 independent correlations. The X!TANDEM algorithm made at least 5 best fit correlations to more than 14,000 protein gene symbols with p-values and FDR corrected q-values of ~ 0.001 or less. Log10 peptide intensity values showed a Gaussian distribution from E8 to E4 arbitrary counts by quantile plot, and significant variation in average precursor intensity across the disease and controls treatments by ANOVA with means compared by the Tukey-Kramer test. STRING analysis of the top 2000 gene symbols showed a tight association of cellular proteins that were apparently present in the plasma as protein complexes with related cellular components, molecular functions and biological processes.

Conclusions: The random and independent sampling of pre-fractionated blood peptides by LC-ESI-MS/MS with SQL Server-R analysis revealed the largest plasma proteome to date and was a practical method to quantify and compare the frequency or log10 intensity of individual proteins cleaved ex vivo across populations of plasma samples from multiple clinical locations to discover treatment-specific variation using classical statistics suitable for clinical science. It was possible to identify and quantify nearly all human proteins from EDTA plasma and compare the results of thousands of LC-ESI-MS/MS experiments from multiple clinical populations using standard database methods in SQL Server and classical statistical strategies in the R data analysis system.

Keywords: Electrospray ionization tandem mass spectrometry; Endogenous tryptic peptides phospho peptides; Human EDTA plasma; LC–ESI–MS/MS; Linear quadrupole ion trap; Nano chromatography; Organic extraction.


Figures

Fig. 1
Fig. 1
The human endogenous tryptic peptides and/or phosphopeptides where precursor intensity is greater than E4 (10,000) arbitrary detector counts after selecting the best fit of MS/MS spectra from 2+ or 3+ ions and selecting the single best peptide fit for each MS/MS fragmentation spectrum (Filter 2). a the SEQUEST algorithm; b the X!TANDEM algorithm
Fig. 2
Fig. 2
The human protein gene symbols identified by endogenous tryptic peptides and/or phosphopeptides using Filter 2 where precursor intensity is greater than E4 (10,000) arbitrary detector counts from the SEQUEST plus X!TANDEM algorithm after selecting the best fit of MS/MS spectra from 2+ or 3+ ions and selecting the single best peptide fit for each MS/MS fragmentation set and thus rejecting the redundant correlation of the same MS/MS spectra more than once. a log peptide counts per protein accession; b log10 peptide counts per gene symbol
Fig. 3
Fig. 3
The distributions of the endogenous Rank 1 tryptic peptides correlated by the X!TANDEM algorithm from human EDTA plasma. a The sorted log10 precursor intensity values; b the sorted peptide [M + H]+ values; c the sorted peptide delta mass values; d the scatter plot log10 peptide p-values versus precursor intensity; e log10 intensity versus peptide [M + H]+ Residual standard error: 0.5488 on 1135580 degrees of freedom Multiple R-squared: 0.2236, Adjusted R-squared: 0.2236 F-statistic: 3.27e + 05 on 1 and 1,135,580 DF, p-value: < 2.2e−16); f log10 peptide p-values versus the delta mass value; G, sorted log10 peptide p-value; h log10 peptide p-value versus [M + H]+; i quantile plot of peptide p-values
Fig. 4
Fig. 4
The distributions of the endogenous Rank 1 tryptic peptides correlated by the X!TANDEM algorithm from human EDTA plasma at the level of protein. a The peptide to protein accession count; b the average peptide p-value per protein accession; c the log10 average peptide p-value per protein accession; d log10 precursor intensity value per protein accession; e the standard error of the protein accession log10 intensity; f the cumulative p-value per protein (inset cumulative log10 p-value per protein accession)
Fig. 5
Fig. 5
The distributions of the Rank 1 endogenous tryptic peptides correlated by the X!TANDEM algorithm from human EDTA plasma from the best protein accession per gene symbols. a log peptides observed per gene symbol (inset quantile plot of peptide frequency count); b log mean precursor intensity per gene symbol (inset quantile plot of log10 intesity); c log mean p-value per gene symbol; d cumulative log10 p-value per gene symbol (inset log10 cumulative p-value per gene symbol)
Fig. 6
Fig. 6
The box plot and ANOVA of log10 peptide intensity from 26 control and disease EDTA plasma samples. Treatment ID numbers: 1, Alzheimer normal; 2, Alzheimer normal control STYP; 3, AlzHeimer’s dementia; 4, Alzheimer’s dementia STYP; 5, Cancer_breast; 6, Cancer_breast_STYP; 7, Cancer_control; 8, Cancer_control_STYP; 9, Cancer_ovarian; 10, Cancer_ovarian_STYP; 11, Ice Cold; 12, Ice Cold STYP; 13, Heart attack Arterial; 14 Heart attack Arterial_STYP; 15, Heart attack normal control, 16, Heart attack normal Control STYP; 17, Heart attack; 18, Heart attack STYP; 19, Multiple Sclerosis normal control; 20, Multiple Sclerosis normal control STYP; Multiple Sclerosis; 22, Multiple Sclerosis STYP, 23 Sepsis; 24, Sepsis STYP; 25, Sepsis normal control; 26, Sepsis normal control STYP. The ANOVA analysis across treatments produced an F Statistic of 13,898 and a p-value of 2e−16*** (Additional file 3: Table S3). STYP: serine, threonine, tyrosine phosphorylation
Fig. 7
Fig. 7
The box plot and ANOVA of log10 peptide intensity from 26 control and disease EDTA plasma samples for some frequently observed gene symbols. Treatment ID numbers: 1, Alzheimer normal; 2, Alzheimer normal control STYP; 3, AlzHeimer’s dementia; 4, Alzheimer’s dementia STYP; 5, Cancer_breast; 6, Cancer_breast_STYP; 7, Cancer_control; 8, Cancer_control_STYP; 9, Cancer_ovarian; 10, Cancer_ovarian_STYP; 11, Ice Cold; 12, Ice Cold STYP; 13, Heart attack Arterial; 14 Heart attack Arterial_STYP; 15, Heart attack normal control, 16, Heart attack normal Control STYP; 17, Heart attack; 18, Heart attack STYP; 19, Multiple Sclerosis normal control; 20, Multiple Sclerosis normal control STYP; Multiple Sclerosis; 22, Multiple Sclerosis STYP, 23 Sepsis; 24, Sepsis STYP; 25, Sepsis normal control; 26, Sepsis normal control STYP. The ANOVA analysis across treatments produced an F Statistic of 13,898 and a p-value of 2e−16***. STYP: serine, threonine, tyrosine phosphorylation. Note that many proteins were not detected in the ice cold plasma
Fig. 8
Fig. 8
STRING analysis of the top 2000 gene symbols from the endogenous peptides of normal human plasma. Network Statistics: number of nodes: 478; number of edges: 889; average node degree: 3.72; avg. local clustering coefficient: 0.415; expected number of edges, 654; PPI enrichment p value, ≪ 0.0001.  The image shown was cropped from the entire network for the purpose of graphical clarity

References

    1. Putnam F. The plasma proteins: structure function, and genetic control. 2. New York: Academic Press; 1975.
    1. Burtis CA, Ashwood ER, DE Bruns, editors. Tietz fundamentals of clinical chemistry. ‎Philadelphia: Saunders; 2001. p. 1091.
    1. Welinder KG. Generation of peptides suitable for sequence analysis by proteolytic cleavage in reversed-phase high-performance liquid chromatography solvents. Anal Biochem. 1988;174(1):54–64. doi: 10.1016/0003-2697(88)90518-0. - DOI - PubMed
    1. Fenn JB, et al. Electrospray ionization for mass spectrometry of large biomolecules. Science. 1989;246(4926):64–71. doi: 10.1126/science.2675315. - DOI - PubMed
    1. Hunt DF, et al. Protein sequencing by tandem mass spectrometry. Proc Natl Acad Sci USA. 1986;83(17):6233–6237. doi: 10.1073/pnas.83.17.6233. - DOI - PMC - PubMed

LinkOut - more resources