. 2018 Nov 8:6:35-56.
doi: 10.2147/HP.S173589. eCollection 2018.

Astrocyte HIF-2α supports learning in a passive avoidance paradigm under hypoxic stress

Affiliations

Astrocyte HIF-2α supports learning in a passive avoidance paradigm under hypoxic stress

Cindy V Leiton et al. Hypoxia (Auckl). .

Abstract

Background: The brain is extensively vascularized, useŝ20% of the body's oxygen, and is highly sensitive to changes in oxygen. While synaptic plasticity and memory are impaired in healthy individuals by exposure to mild hypoxia, aged individuals appear to be even more sensitive. Aging is associated with progressive failure in pulmonary and cardiovascular systems, exposing the aged to both chronic and superimposed acute hypoxia. The HIF proteins, the "master regulators" of the cellular response to hypoxia, are robustly expressed in neurons and astrocytes. Astrocytes support neurons and synaptic plasticity via complex metabolic and trophic mechanisms. The activity of HIF proteins in the brain is diminished with aging, and the increased exposure to chronic and acute hypoxia with aging combined with diminished HIF activity may impair synaptic plasticity.

Purpose: Herein, we test the hypothesis that astrocyte HIF supports synaptic plasticity and learning upon hypoxia.

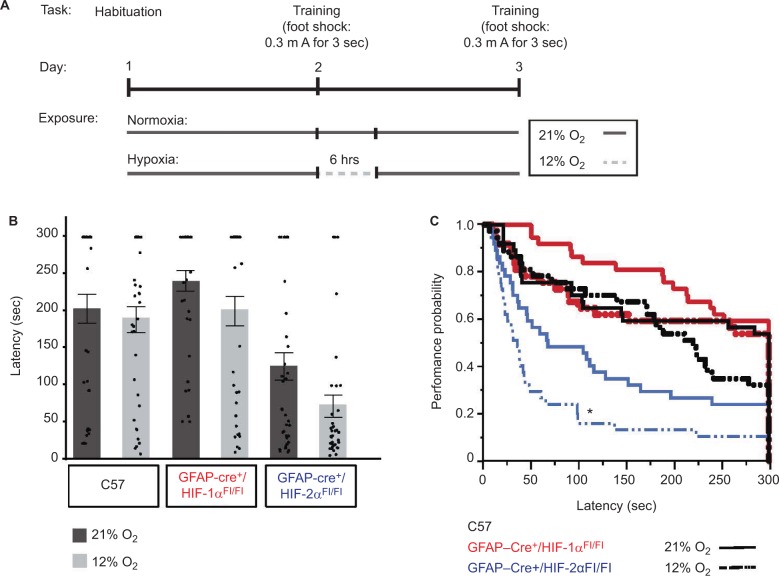
Materials and methods: An Astrocyte-specific HIF loss-of-function model was employed, where knock-out of HIF-1α or HIF-2α in GFAP expressing cells was accomplished by cre-mediated recombination. Animals were tested for behavioral (open field and rotarod), learning (passive avoidance paradigm), and electrophysiological (long term potentiation) responses to mild hypoxic challenge.

Results: In an astrocyte-specific HIF loss-of-function model followed by mild hypoxia, we identified that the depletion of HIF-2α resulted in an impaired passive avoidance learning performance. This was accompanied by an attenuated response to induction in long-term potentiation (LTP), suggesting that the hippocampal circuitry was perturbed upon hypoxic exposure following HIF-2α loss in astrocytes, and not due to hippocampal cell death. We investigated HIF-regulated trophic and metabolic target genes and found that they were not regulated by HIF-2α, suggesting that these specific targets may not be involved in mediating the phenotypes observed.

Conclusion: Together, these results point to a role for HIF-2α in the astrocyte's regulatory role in synaptic plasticity and learning under hypoxia and suggest that even mild, acute hypoxic challenges can impair cognitive performance in the aged population who harbor impaired HIF function.

Keywords: HIF; LTP; astrocyte; cognitive function; glia; hypoxia; learning; memory; tripartite synapse.


Conflict of interest statement

Disclosure CVL was partly supported by a postdoctoral fellowship awarded by the National Science Foundation’s workforce development program, the Alliance for Graduate Education in the Professoriate-Transformation grant (HRD-1311318), through the Stony Brook University Center for Inclusive Education, Stony Brook, NY, USA. The authors report no other conflicts of interest in this work.

Figures

Figure 1
Figure 1
Characterization of HIF-1α and HIF-2α knock-out in GFAP-expressing cells. Notes: (A) DNA recombination assays from brain, liver, and kidney tissues show organ specific, HIF-allele recombination of each genotype. HIF-1α Cre-mediated recombination generates 1-loxP allele of 270 bp. The nonrecombined 2-lox allele is 260 bp, and the WT allele is 240 bp. Product size for the HIF-2α-recombined 1-lox allele is 360 bp, that for the nonrecombined 2-lox allele is 460 bp, and that for the WT allele is 430 bp. Red arrows indicate the recombined bands that are only observed in B (brain) tissues from Cre-expressing animals. (B) Cre-recombinase (green) expression is visible only in Cre-expressing knock-out animals in tissue samples of the hippocampus. Scale bar =20 µm. GFAP = red, DAPI = blue. (C) Characterization of primary mouse cortical astrocytes isolated from neonatal cerebral cortices from either GFAP-Cre-negative or GFAP-Cre-positive HIF-1αFl/Fl or HIF-2αFl/Fl animals. Astrocytes were exposed to 21% or 0.1% O2 for 6 hours and lysed and assessed for the expression of HIF-1α, HIF-2α, Cre recombinase (Cre), GFAP, and p115 proteins. GFAP was detected as a marker for astrocytes, and p115, an endoplasmic reticulum-expressing protein, was used as a loading control. Quantitative analysis of HIF-1α and HIF-2α proteins was normalized to p115-loading control and plotted as a fold change relative to the respective Cre-negative control at 21% O2 (mean ± SE, n=6–8/group). *P<0.05. All statistical analyses were carried out in comparison to the respective GFAP-Cre- control at 21% O2. Abbreviations: AU, arbitrary units; B, brain; bp, base pairs; GFAP, glial fibrillary acidic protein; K, kidney; L, liver; WT, wild type.
Figure 2
Figure 2
HIF-1α and HIF-2α knock-out animals show similar somatic physiological characteristics to C57 animals. Notes: (A) Gross appearance of C57, GFAP-Cre+/HIF-1αFl/Fl, and GFAP-Cre+/HIF-2αFl/Fl males at the age of 3–6 months show no overt differences. (B) Body and organ morphology measurements for all genotypes: C57, GFAP-Cre-/HIF-1αFl/Fl, GFAP-Cre+/HIF-1αFl/Fl, GFAP-Cre-/HIF-2αFl/Fl, and GFAP-Cre+/HIF-2αFl/Fl. Body, brain, liver, kidney, spleen, heart, and lung weights are depicted in addition to hematocrit. *Compared to C57; #significance compared to GFAP-Cre-/HIF-αFl/Fl counterpart (n=8–24/group). Data are presented as mean ± SD. Abbreviation: GFAP, glial fibrillary acidic protein.
Figure 3
Figure 3
Open-field performance at baseline. Notes: Open-field performance at baseline (21% O2 – room air) for all genotypes as measured by (A) total path length (m), (B) speed (cm/s), (C) center middle (% time), and (D) outer zone (% time). *P<0.01 and **P<0.001 (compared to WT). Abbreviations: GFAP, glial fibrillary acidic protein; WT, wild type.
Figure 4
Figure 4
Rotarod performance at baseline. Notes: Rotarod performance was measured daily, for 3 consecutive days, with three trials per day. (A) Mean latency by group for all genotypes. (B) Mean speed by group (*P<0.05 and #P<0.01 in comparison to C57) for all genotypes. Slopes depicting change in latency by day and trial for (C) C57, (D) GFAP-Cre+/HIF-1αFl/Fl, and (E) GFAP-Cre+/HIF-2αFl/Fl. (F) Superimposed slopes of change in latency for all groups. No differences between genotype groups were identified (GFAP-Cre+/HIF-1αFl/Fl vs C57, P=0.80; GFAP-Cre+/HIF-2αFl/Fl vs C57, P=0.22; GFAP-Cre+/HIF-1αFl/Fl vs GFAP-Cre+/HIF-2αFl/Fl, P=0.31). Abbreviation: GFAP, glial fibrillary acidic protein.
Figure 5
Figure 5
Baseline learning performance on the PA learning paradigm. Notes: The PA test consists of a light and dark chamber. Animals are placed into the chamber in the light side but quickly move into the dark side due to habitual preference for the dark. (A) Schematic representation depicting the protocol, where on day 1, animals are allowed to roam freely in the dark and light sides to habituate. On training day (day 2), they were placed in the light side, and when they enter the dark side, they are given a foot shock. On testing day (day 3), testing is done where the time to enter the dark side is calculated as latency. Animals were exposed to normoxic conditions (21% O2) at all times. (B) Latency during the PA paradigm is plotted for the five groups. Differences in performance between GFAP-Cre-/HIF-1αFl/Fl, GFAP-Cre+/HIF-1αFl/Fl, GFAP-Cre-/HIF-2αFl/Fl, GFAP-Cre+/HIF-2αFl/Fl, and C57, all under air, are indicated as follows: *P<0.05 and **P<0.01. There was NS within-group differences in performance in GFAP-Cre-/HIF-1αFl/Fl vs GFAP-Cre+/HIF-1αFl/Fl, or GFAP-Cre-/HIF-2αFl/Fl vs GFAP-Cre+/HIF-2αFl/Fl. Abbreviations: GFAP, glial fibrillary acidic protein; NS, no significant; PA, passive avoidance.
Figure 6
Figure 6
HIF-2α knock-out in GFAP-expressing cells results in impaired learning. Notes: (A) Similar to the testing protocol described in Figure 5A, animals are habituated on day 1. On testing day (day 2), animals are given a foot shock when they enter the dark compartment and are immediately exposed to either air (21% O2) or hypoxia (12% O2) for 6 hours. A total of 24 hours after training (day 3), they are tested for the time to enter the dark side (latency). (B) Bar graphs and scatter plots depicting mean latency per group at 21% O2 (dark gray bars) vs 12% O2 (light gray bars). A ceiling latency of 300 seconds was enforced. The mean latency for C57 was at 21% O2 =202±119 and at 12% O2 =188±106, that for GFAP-Cre+/HIF-1αFl/Fl was at 21% O2 =240±85 and at 12% O2 =199±120, and that for GFAP-Cre+/HIF-2αFl/Fl at 21% O2 =124±113 and at 12% O2=71±90. (C) Cox proportional hazard analysis of mean latency for C57 (black), GFAP-Cre+/HIF-1αFl/Fl (red), and GFAP-Cre+/HIF-2αFl/Fl (blue) was 21% O2 (solid lines) vs 12% O2 (dashed lines) (N=37/group). Only the risk ratio comparison between 21% O2 and 12% O2 within the GFAP-Cre+/HIF-2αFl/Fl group (blue) showed statistical significance (*P=0.015). Abbreviation: GFAP, glial fibrillary acidic protein.
Figure 7
Figure 7
LTP is altered upon hypoxic exposure in GFAP-Cre+/HIF-2αFl/Fl mice. Notes: Hippocampal slices recovered from animals after exposure to 6 hours of either 21% (colored shape) or 12% O2 (empty shape). fEPSP slope is plotted as the percentage of mean fEPSP baseline (mean ± SD) for (A) C57 (triangle), (B) GFAP-Cre+/HIF-1αFl/Fl (square), (C) GFAP-Cre+/HIF-2αFl/Fl (circle), and (D) all. The mean LTP during the 50–60 minutes period after tetanus was compared within groups. Inset: representative traces from animals exposed to 21% O2 (left) or 6 hours of 12% O2 (right), recorded immediately before and after LTP induction. Scale bars: 2 mV, 10 ms. Hypoxia did not significantly change LTP in C57 mice (147±4% in 12% O2, n=10 slices, 10 mice, vs 151±6% in 21% O2, n=10 slices, 11 mice; P>0.06) or GFAP-Cre+/HIF-1αFl/Fl mice (137±7% in 12% O2, n=10 slices, 10 mice, exposure to 21% O2, vs 133±6% at 21% O2, n=11 slices, 11 mice, P=0.15). In GFAP-Cre+/HIF-2αFl/Fl mice, LTP is significantly reduced in slices from animals exposed to 6 hours of 12% O2 compared with slices from animals maintained in 21% O2 (146±8% in 12% O2, n=8 slices, eight mice, vs 193±10% at 21% O2, n=9 slices, nine mice, P<0.0001). Abbreviations: fEPSP, field excitatory postsynaptic potential; GFAP, glial fibrillary acidic protein; LTP, long-term potentiation.
Figure 8
Figure 8
Cell death in the hippocampus does not occur upon 12% O2 exposure. Notes: (A) Schematic representation depicting exposure to 21% O2 and 12% O2 for 6 hours, both followed by 18-hour recovery, and tissue collection time points at 6 and 24 hours. (B) Immunohistochemical detection of CC3 in postnatal day 8 pups injected with ethanol to induce widespread cell death in the hippocampus is marked by red arrows and serves as positive control tissues. A secondary antibody only control shows no background or nonspecific staining. (C) Animals exposed for 6 hours of 21% O2 or 12% O2 show no CC3 detection 18 hours after exposure, demonstrating that apoptosis was not induced. Tissues were also analyzed at 6 hours after the exposure and also showed no detectable CC3 staining (not shown). N=3 per condition. Images at 5× magnification, followed by insets indicated by dashed areas at 20× magnification. Scale bars =200 µm. Abbreviations: CC3, cleaved caspase-3; GFAP, glial fibrillary acidic protein; IHC, immunohistochemistry.
Figure 9
Figure 9
Astrocyte HIF-2α does not target genes involved in metabolism and EPO induction in vitro. Notes: Gene expression changes in HIF-1α- and/or HIF-2α-deficient astrocytes after chronic hypoxic challenge in vitro. (A and B) Astrocytes were transfected with control, HIF-1α, HIF-2α, or both HIF-1α and HIF-2α targeting siRNAs for knock-down. In (A), verification of knock-down by the assessment of HIF transcripts shows significantly decreased HIF proteins upon respective siRNA treatment. (C) Astrocytes isolated from GFAP-Cre-negative or -positive HIF-1αFl/Fl or HIF-2αFl/Fl neonatal brains, n=5–8/group. In (AC), astrocytes were exposed to either 21% O2 or 0.1% O2 for 6 hours. Mean ± SE are plotted for transcript fold changes in Glut-1, PDK-1, LDHA, MCT-4, and EPO relative to 18S. In (A and B), *P<0.05 relative to the control without silencing, #P<0.05 relative to HIF-1α silencing, and ^P<0.05 relative to HIF-2α silencing. In (C), *P<0.05 relative to Cre-/HIF-αFl/Fl of same genotype under the same exposure and #P<0.05 relative to GFAP-Cre+/HIF-1αFl/Fl under the same exposure. Abbreviations: AU, arbitrary units; EPO, erythropoietin; GFAP, glial fibrillary acidic protein; Glut-1, glucose transporter 1; LDHA, lactate dehydrogenase A; MCT-4, monocarboxylate transporter 4; PDK-1, pyruvate dehydrogenase kinase-1.

References

    1. Pittman RN. Regulation of Tissue Oxygenation. San Rafael, CA: Morgan & Claypool Life Sciences; 2011. - PubMed
    1. Bruce AS, Aloia MS, Ancoli-Israel S. Neuropsychological effects of hypoxia in medical disorders. In: Grant I, Adams KM, editors. Neuropsychological Assessment of Neuropsychiatric and Neuromedical Disorders. 3rd ed. Oxford, New York: Oxford University Press; 2009. pp. 336–349.
    1. Cannon JA, Moffitt P, Perez-Moreno AC, et al. Cognitive Impairment and Heart Failure: Systematic Review and Meta-Analysis. J Card Fail. 2017;23:464–475. - PubMed
    1. Yohannes AM, Chen W, Moga AM, Leroi I, Connolly MJ. Cognitive Impairment in Chronic Obstructive Pulmonary Disease and Chronic Heart Failure: A Systematic Review and Meta-analysis of Observational Studies. J Am Med Dir Assoc. 2017;18(5):451.e1–451.e11. - PubMed
    1. Schega L, Peter B, Törpel A, Mutschler H, Isermann B, Hamacher D. Effects of intermittent hypoxia on cognitive performance and quality of life in elderly adults: a pilot study. Gerontology. 2013;59(4):316–323. - PubMed