

Autism Spectrum Disorder: Incidence and Time Trends Over Two Decades in a Population-Based Birth Cohort
- PMID: 30519787
- PMCID: PMC6594832
- DOI: 10.1007/s10803-018-3834-0
Autism Spectrum Disorder: Incidence and Time Trends Over Two Decades in a Population-Based Birth Cohort
Abstract
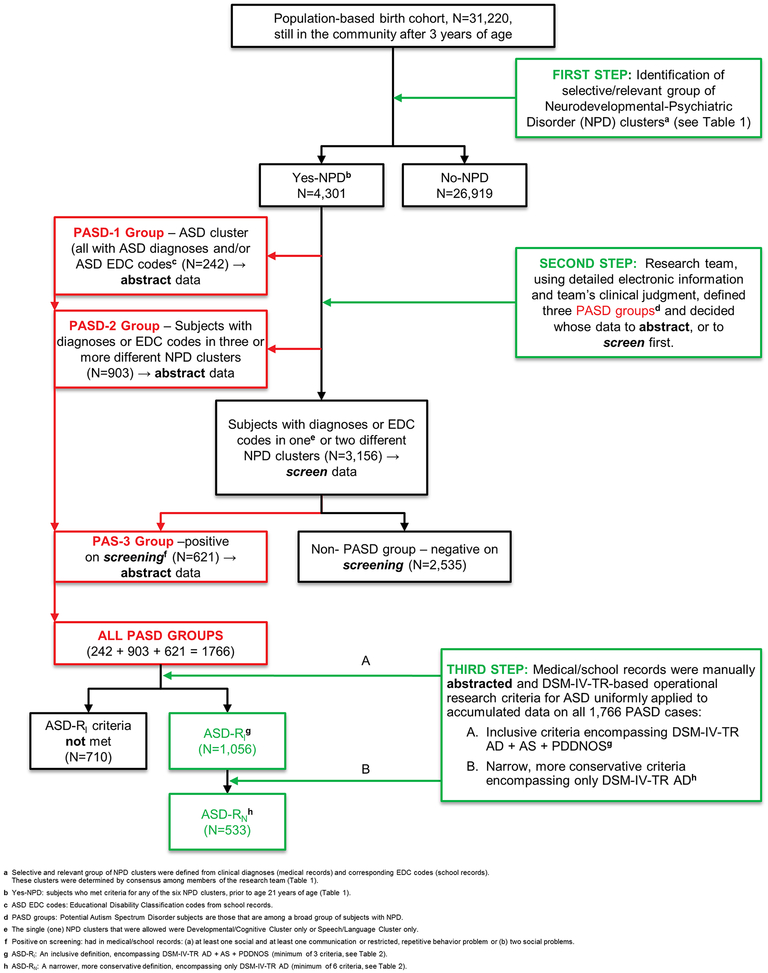
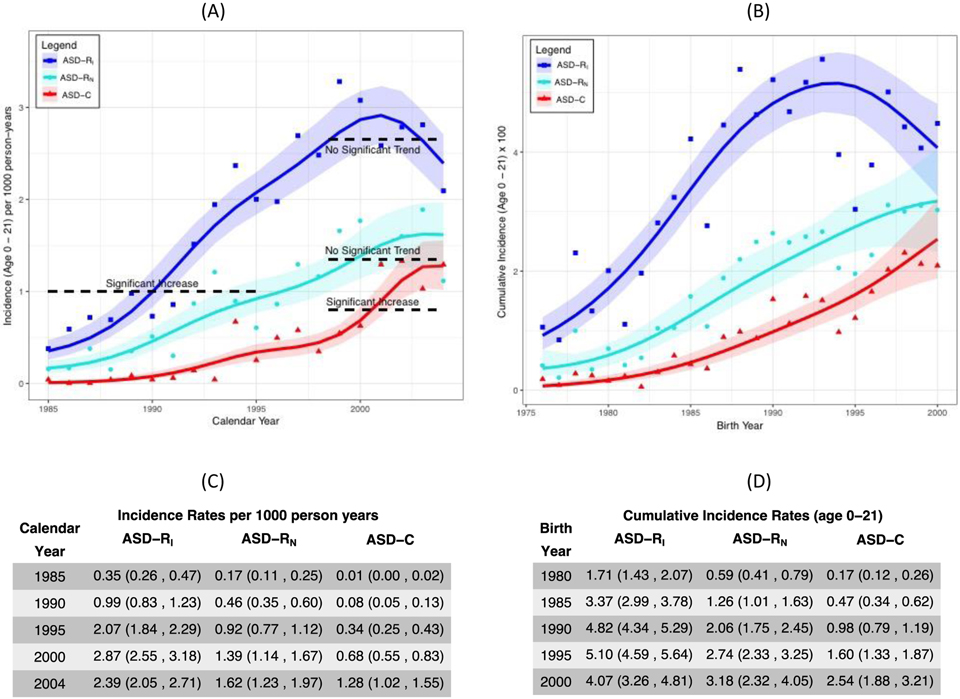
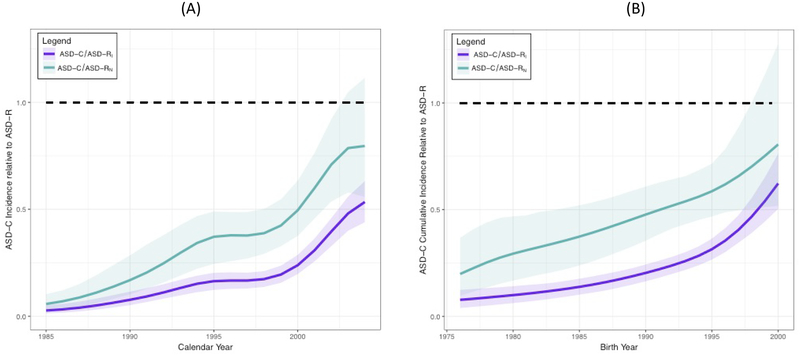
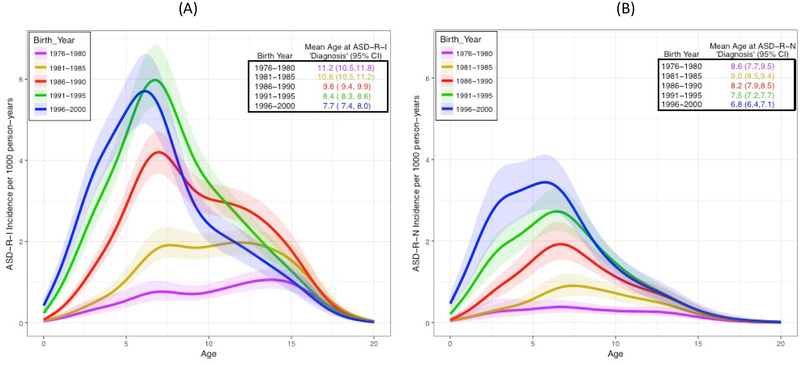
We retrospectively identified autism spectrum disorder (ASD) incident cases among 31,220 individuals in a population-based birth cohort based on signs and symptoms uniformly abstracted from medical and educational records. Inclusive and narrow research definitions of ASD (ASD-RI and ASD-RN, respectively) were explored, along with clinical diagnoses of ASD (ASD-C) obtained from the records. The incidence of ASD-RI, ASD-RN, and ASD-C increased significantly from 1985 to 1998, then ASD-RI and ASD-RN plateaued while the rate of ASD-C continued to increase during 1998-2004. The rising incidence of research-defined ASD may reflect improved recognition and documentation of ASD signs and symptoms. Although the frequency of threshold ASD symptoms stabilized, the rate of ASD-C continued to increase, narrowing the gap between clinical ascertainment and symptom documentation.
Keywords: Autism spectrum disorder; Epidemiology; Incidence; Time trends.
Conflict of interest statement
Figures
References
-
- American Psychiatric Association (2000). Diagnostic and Statistical Manual of Mental Disorders, 4th Edition, Text Revision (DSM-IV-TR). Washington, DC: American Psychiatric Publishing.
-
- American Psychiatric Association (2013). Diagnostic and Statistical Manual of Mental Disorders, Fifth Edition. VA: American Psychiatric Association.
-
- Atladottir HO, Gyllenberg D, Langridge A, Sandin S, Hansen SN, Leonard H, et al. (2015). The increasing prevalence of reported diagnoses of childhood psychiatric disorders: a descriptive multinational comparison. European Child and Adolescent Psychiatry, 24(2), 173–183. https://doi:10.1007/s00787-014-0553-8. - DOI - PubMed
-
- Baio J, Wiggins L, Christensen DL, Maenner MJ, Daniels J, Warren Z, et al. (2018). Prevalence of Autism Spectrum Disorder among Children Aged 8 Years - Autism and Developmental Disabilities Monitoring Network, 11 Sites, United States, 2014. MMWR Surveillence Summaries, 67(6), 1–23. https://doi:10.15585/mmwr.ss6706a1. - DOI - PMC - PubMed
-
- Baker JP (2013). Autism at 70--redrawing the boundaries. New England Journal of Medicine, 369(12), 1089–1091. https://doi:10.1056/NEJMp1306380. - DOI - PubMed
MeSH terms
Grants and funding
LinkOut - more resources
Full Text Sources
Medical
Miscellaneous
