. 2019 Mar;79(4):390-402.
doi: 10.1002/pros.23745. Epub 2018 Dec 5.

Ex vivo treatment of prostate tumor tissue recapitulates in vivo therapy response

Affiliations

Ex vivo treatment of prostate tumor tissue recapitulates in vivo therapy response

Wenhao Zhang et al. Prostate. 2019 Mar.

Abstract

Background: In vitro models of prostate cancer (PCa) are not always reliable to evaluate anticancer treatment efficacy. This limitation may be overcome by using viable tumor slice material. Here we report on the establishment of an optimized ex vivo method to culture tissue slices from patient-derived xenografts (PDX) of prostate cancer (PCa), to assess responses to PCa treatments.

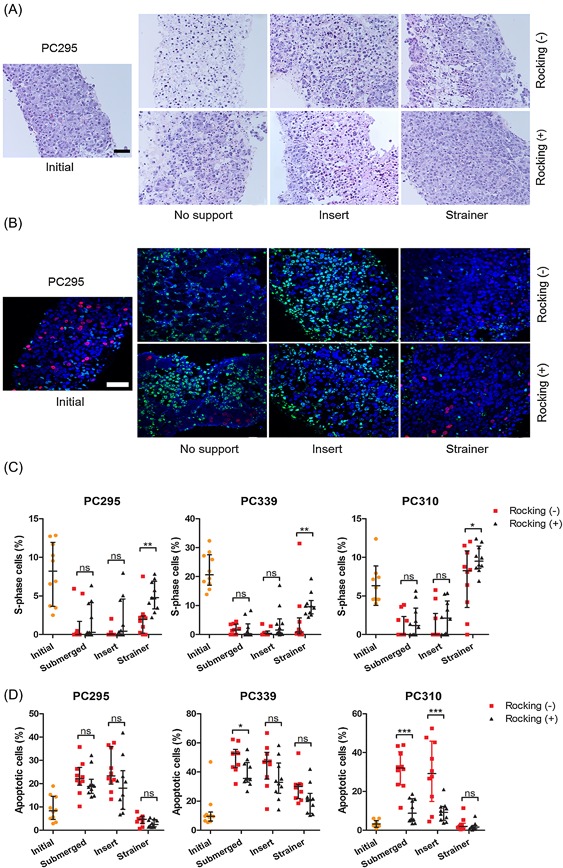
Methods: Three PDX models were used that are characterized by different androgen receptor (AR) expression and different homology directed DNA repair capacities, due to a breast cancer associated two (BRCA2) wild-type or mutated status. Tumors were removed from mice, sliced using a vibratome and cultured for a maximum of 6 days. To test the sensitivity to androgen antagonist, tumor slices from the AR-expressing and AR-negative PDX tumors were treated with the anti-androgen enzalutamide. For sensitivity to DNA repair intervention, tumors slices from BRCA2 wild-type and mutated PDXs were treated with the poly (ADP-ribose) polymerase-1 inhibitor olaparib. Treatment response in these tumor slices was determined by measuring slice morphology, cell proliferation, apoptosis, AR expression level, and secretion of prostate specific antigen (PSA).

Results: We compared various culture conditions (support materials, growth media, and use of a 3D smooth rocking platform) to define the optimal condition to maintain tissue viability and proliferative capacity up to least 6 days. Under optimized conditions, enzalutamide treatment significantly decreased proliferation, increased apoptosis, and reduced AR-expression and PSA secretion of AR-expressing tumor slices compared to AR-negative slices, that did not respond to the intervention. Olaparib treatment significantly increased cell death in BRCA2 mutated tumors slices as compared to slices from BRCA2 wild type tumors.

Conclusions: Ex vivo treatment of PCa PDX tumor slices with enzalutamide and olaparib recapitulates responses previously observed in vivo. The faithful retention of tissue structure and function in this ex vivo model offers an ideal opportunity for treatment efficacy screening, thereby reducing costs and numbers of experimental animals.

Keywords: enzalutamide; ex vivo culture; olaparib; prostate cancer; tissue slices.


Conflict of interest statement

We have nothing to disclose.

Figures

Figure 1
Figure 1
PDX tissue culture methodology. The tumor was removed from the mice and sliced with a Leica Vibratome into 300 µm tumor slices. Slices were either submerged in culture medium, on Cell Strainers or on Cell Culture inserts. Culture dishes were then placed on a Rocking Table or incubated without movement. Slices were harvested at various time points and EdU was added 2 h before fixation. Subsequently, fixed tissue was embedded in paraffin (FFPE). [Color figure can be viewed at wileyonlinelibrary.com]
Figure 2
Figure 2
Effect of filter support and 3D orbital movement on PCa tissue slice morphology and viability. A, Representative H&E images of PC295 tumor slice sections after 4 days of culturing under the different culture conditions, compared to an initial slice (day 0). Scale bar 50 µm. B, Representative EdU/TUNEL/DAPI images of PC295 tumor slice sections after 4 days of culturing under the different culture conditions, compared to an initial slice (day 0) (blue = DAPI, red = EdU, green = TUNEL). Represented H&E and EdU/TUNEL images of PC339 and PC310 tumor slices can be found in Figure S1. Scale bar 50 µm. C, Quantification of the fraction of EdU‐positive cells in the tissue slices. D, Quantification of the fraction of TUNEL positive cells in the tissue slices. For all graphs, 10 image fields were analyzed per tumor slice. Each point represents one image field, interquartile range, and median values are indicated (results from 1 representative tumor per graph). [Color figure can be viewed at wileyonlinelibrary.com]
Figure 3
Figure 3
Optimization of culture medium. A, Quantification of the fraction of EdU‐positive cells of PC295 and PC339 slices cultured up to 6 days in PGM and aDMEM/F12 K medium. B, Quantification of the fraction of EdU‐positive cells for PC295 and PC339 slices cultured up to 6 days in aDMEM/F12 K and aDMEM/F12 K supplemented with R1881. C, Quantification of the fraction of TUNEL‐positive cells for PC295 and PC339 slices cultured in aDMEM/F12 K and aDMEM/F12 K supplemented with R1881 at 6 days. For all graphs, 10 image fields were analyzed per tumor slice section. Each point represents one image field, average and SEM are indicated (three independent experiments for each tumor type). **P < 0.01, ***P < 0.001, ns, non‐significant. [Color figure can be viewed at wileyonlinelibrary.com]
Figure 4
Figure 4
Prostate characteristics during prolonged ex vivo culturing. A, Representative images of AR staining of PC295 tumor slice sections cultured in two media for different time points, compared to the stained section of the initial slice (day 0). B, Quantification of the AR staining. Four image fields were analyzed per tumor slice, each point represents one image field, average, and SEM are indicated (three independent experiments). C, Representative images of AR staining of PC295 tissue slice sections cultivated in aDMEM/F12 K and aDMEM/F12 K supplemented with R1881 for different time points, compared to the stained section of the initial slice (day 0). D, Quantification of the AR staining. Four image fields were analyzed per tumor slice, each point represents one image field, average, and SEM are indicated (three independent experiments). E, Normalized accumulated PSA concentrations of PC295 slices from day 1 to day 6 cultured in aDMEM/F12 K and aDMEM/F12 K supplemented with R1881. Line represent mean values and bars indicates SEM (three independent experiments). For all graphs scale bar 50 µm and *P < 0.05, **P < 0.01, ***P < 0.001, ns, non‐significant. [Color figure can be viewed at wileyonlinelibrary.com]
Figure 5
Figure 5
Response to ex vivo enzalutamide treatment. A, Quantification of the fraction of EdU‐positive cells for PC295 and PC339 slices at different time points. Scale bar 100 µm. B, Quantification of the fraction of TUNEL‐positive cells for PC295 and PC339 slices at different time points. Scale bar 100 µm. C, Representative images of AR staining for PC295 tissue slice sections at day 6 and quantification of the AR stainings. Scale bar 50 µm. D, Normalized accumulated PSA concentrations of PC295 and PC339 slices from day 1 to day 6 treated or not with Enzalutamide. Line represent mean values and bars indicates SEM. Ten image fields for EdU/TUNEL and four image fields for AR were analyzed per tumor slice section. Each point represents one image field, average, and SEM are indicated (four independent experiments for each tumor type). *P < 0.05, **P < 0.01, ***P < 0.001, ns, non‐significant. [Color figure can be viewed at wileyonlinelibrary.com]
Figure 6
Figure 6
Response to ex vivo olaparib treatment. A, Quantification of the fraction of EdU‐positive cells of PC295 and PC310 slices treated with olaparib for 6 days. B, Quantification of the fraction of TUNEL positive cells of PC295 and PC310 slices treated with olaparib for 6 days. C, Representative images of AR staining of PC295 and PC310 slices treated with olaparib for 6 days. Scale bar 50 µm. D, Normalized accumulated PSA concentrations of PC295 and PC310 slices from day 1 to day 6 treated or not with olaparib. Ten image fields for EdU/TUNEL and four image fields for AR were analyzed per tumor slice section. Each point represents one image field, average and SEM are indicated (three independent experiments for each tumor type). *P < 0.05, **P < 0.01, ***P < 0.001, ns, non‐significant. [Color figure can be viewed at wileyonlinelibrary.com]

References

    1. Torre LA, Bray F, Siegel RL, Ferlay J, Lortet‐Tieulent J, Jemal A. Global cancer statistics, 2012. CA Cancer J Clin. 2015;65:87–108. - PubMed
    1. Wilding JL, Bodmer WF. Cancer cell lines for drug discovery and development. Cancer Res. 2014;74:2377–2384. - PubMed
    1. Gerlach MM, Merz F, Wichmann G, et al. Slice cultures from head and neck squamous cell carcinoma: a novel test system for drug susceptibility and mechanisms of resistance. Br J Cancer. 2014;110:479–488. - PMC - PubMed
    1. Merz F, Gaunitz F, Dehghani F, et al. Organotypic slice cultures of human glioblastoma reveal different susceptibilities to treatments. Neuro Oncol. 2013;15:670–681. - PMC - PubMed
    1. Koerfer J, Kallendrusch S, Merz F, et al. Organotypic slice cultures of human gastric and esophagogastric junction cancer. Cancer Med. 2016;5:1444–1453. - PMC - PubMed

Publication types

MeSH terms