. 2019;30(1):56-65.
doi: 10.1080/09537104.2018.1543865. Epub 2018 Dec 6.

Investigation of the contribution of an underlying platelet defect in women with unexplained heavy menstrual bleeding

Affiliations

Investigation of the contribution of an underlying platelet defect in women with unexplained heavy menstrual bleeding

Gillian C Lowe et al. Platelets. 2019.

Abstract

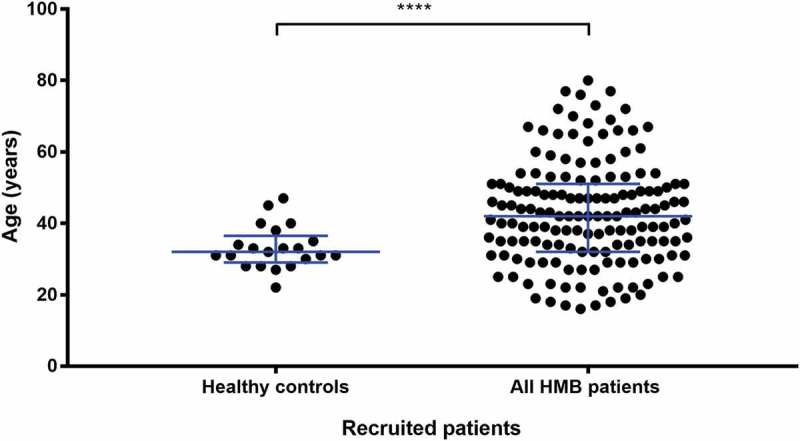
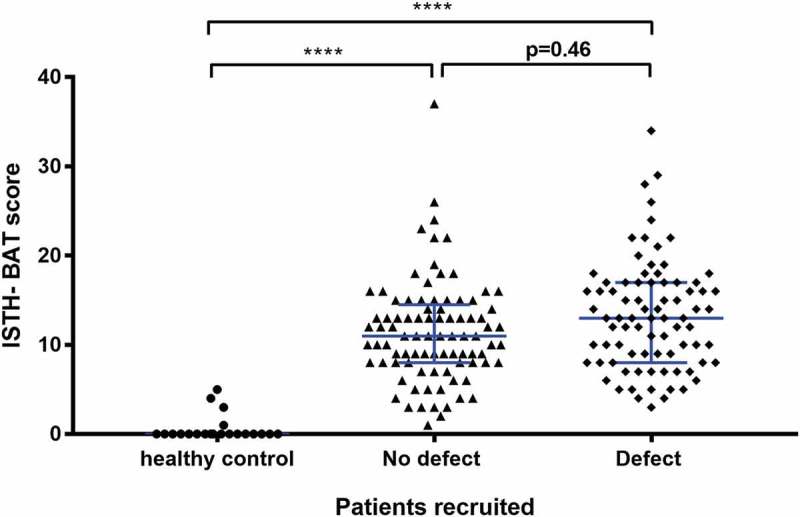
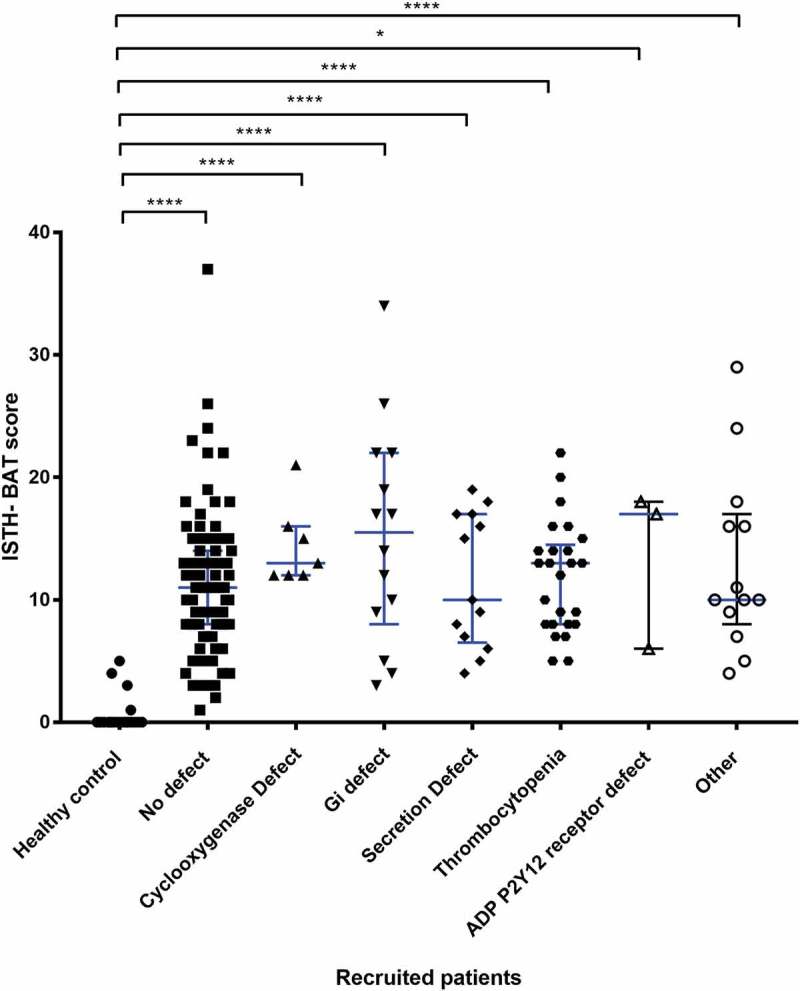
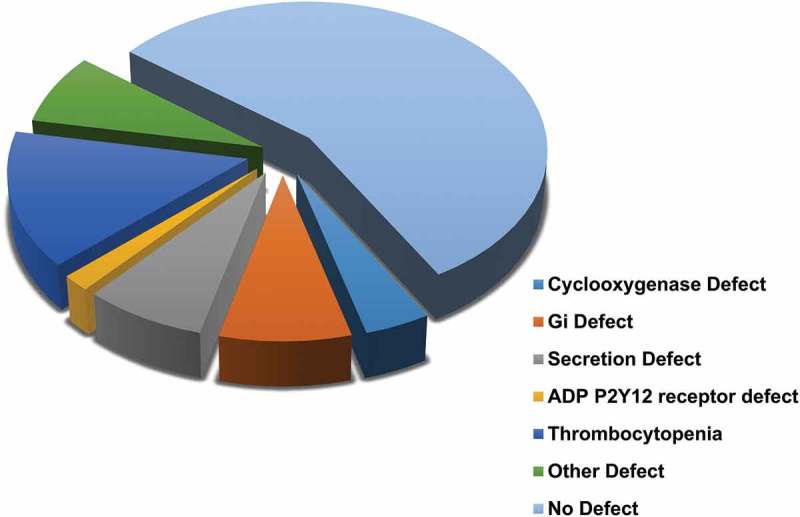
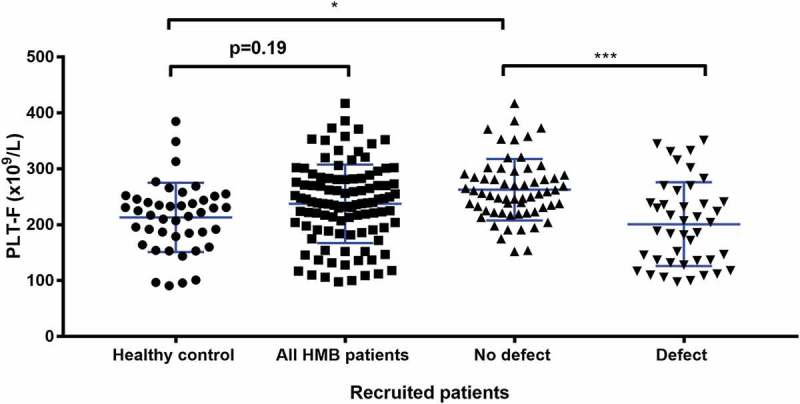
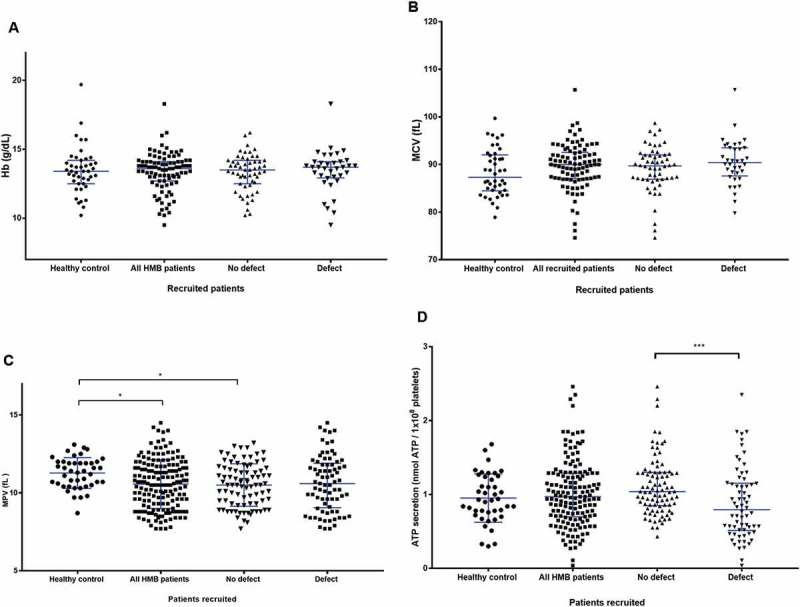
Heavy menstrual bleeding (HMB) is often undiagnosed in women and can cause discomfort and distress. A haemostatic cause for excessive bleeding is often not routinely investigated and can lead to hysterectomy at an early age. A prospective cohort study was carried out to determine whether certain patients with unexplained HMB have an underlying platelet function defect (PFD). The Genotyping and Phenotyping of Platelets (GAPP) study recruited 175 women with HMB and 44 unrelated volunteers from 25 Haemophilia Centres across the UK, and a tertiary gynaecology service. Bleeding history was assessed using the International Society on Thrombosis and Haemostasis Bleeding Assessment Tool (ISTH-BAT). Platelet count, platelet size, haemoglobin and mean corpuscular volume were measured in whole blood using the Sysmex XN-1000 Haematology Analyzer. Platelet function testing using lumiaggregometry and flow cytometry was performed in patients included in this study. A PFD was identified in 47% (82/175) of patients with HMB. Cutaneous bleeding was the most frequent additional bleeding symptom (89% in PFD and 83% with no PFD). Whole blood platelet count was significantly lower (P < 0.0001) between the PFD group and no PFD group. The prevalence of anaemia did not differ between patients and healthy volunteers. Clinical evaluation alone is insufficient to determine presence of an underlying PFD in patients with HMB. Platelet function tests may be considered and clinical guidelines may include them in their algorithms. An appropriate diagnosis and subsequent tailored management of HMB may prevent unnecessary surgery and help manage future haemostatic challenges.

Keywords: Aggregometry; bleeding; heavy menstrual bleeding; platelet function defects; platelet function tests; platelets.


Figures

Figure 1.
Figure 1.
Spread of ages for all recruited patients. A scatter dot plot showing the spread of ages of all recruited patients in this study. The patients age was available for 22 healthy controls and 154 HMB patients. Horizontal bars indicate median and interquartile range. Statistical analysis was performed using parametric unpaired t-test, statistically significant difference is denoted by **** P < 0.0001.
Figure 2.
Figure 2.
The relationship between presence of a platelet function defect detected by lumiaggregometry and the ISTH-BAT score. A scatter dot plot showing the spread of ISTH-BAT scores in the healthy controls (n = 22), no platelet defect (n = 89) and platelet defect (n = 82) groups. Horizontal bars indicate median and interquartile range. Statistical analysis was performed using the non-parametric Kruskal-Wallis test and Dunn’s adjustment for multiple comparisons, the mean rank of each column was compared with the mean rank of every other column. Statistically significant difference is denoted by **** = P < 0.0001. No statistical significance (P = 0.46) was seen between the no platelet defect and platelet defect group.
Figure 3.
Figure 3.
The relationship between the type of platelet defect identified by lumiaggregometry and the ISTH-BAT score. A scatter dot plot showing the spread of ISTH-BAT scores between the platelet defects identified on lumiaggregometry, healthy controls (n = 21), No defect (n = 88), defect (n = 75) of which; cyclooxygenase defect (n = 7), Gi receptor signalling defect (Gi defect) (n = 14), Secretion defect (n = 13), thrombocytopenia (n = 25), ADP receptor defect (n = 3) and other (n = 13). Horizontal bars indicate median and interquartile range. Statistical analysis was performed using non-parametric Kruskal-Wallis and Dunn’s multiple comparisons test, the mean rank of each column was compared with the mean rank of every other column. Statistically significant difference is denoted by * = P < 0.05, **** = P < 0.0001, no statistically significant difference (P > 0.05) was observed between the platelet defect subgroups.
Figure 4.
Figure 4.
The type of platelet defect identified in the HMB group as defined by lumiaggregometry.
Figure 5.
Figure 5.
Comparison of PLT-F between types of platelet defect groups identified by lumiaggregometry. A scatter dot plot showing the spread of PLT-F results between the recruited patients. Healthy controls (n = 43), all HMB patients (n = 103), No defect (n = 61), and defect (n = 42). Error bars represent mean ± 1 SD. Statistical analysis was performed using parametric ordinary one-way ANOVA with Tukey multiple comparisons test, the mean rank of each column was compared with the mean rank of every other column. Statistically significant difference is denoted by * = P ≤ 0.05, *** = P ≤ 0.001.
Figure 6.
Figure 6.
Other haematological and platelet function testing findings between the groups of patients in the study. (A) Comparison of haemoglobin between healthy volunteers and recruited patients with and without a platelet defect. A scatter dot plot showing the spread of Hb results between the recruits. Healthy controls (n = 43), all HMB patients (n = 92), no defect (n = 56), and defect (n = 36). Horizontal bars indicate median and interquartile range. Statistical analysis was performed using non-parametric Kruskal-Wallis and Dunn’s multiple comparisons test, the mean rank of each column was compared with the mean rank of every other column. Comparison between pairs of groups was not significant (P >0.05) for all data points. (B) Comparison of MCV parameters between the healthy control and recruited patients with and without a platelet defect. A scatter dot plot showing the spread of MCV results between the recruits. Healthy controls (n = 42), all recruited HMB patients (n = 92), No defect (n =56) and, defect (n = 36). Horizontal bars indicate median and interquartile range. Statistical analysis was performed using non-parametric Kruskal-Wallis and Dunn’s multiple comparisons test, the mean rank of each column was compared with the mean rank of every other column. Comparison between pairs of groups was not significant (P ≥ 0.05) for all data points. (C) Comparison of MPV parameters between types of platelet defects identifiedvia lumiaggregometry. A scatter dot plot showing the spread of MPV results between the recruits. Healthy controls (n = 43), all HMB patients (n = 162), No defect (n = 86), and defect (n = 76). Horizontal bars indicate median and interquartile range. Statistical analysis performed using the non-parametric Kruskal-Wallis test and Dunn’s adjustment for multiple comparisons, the mean rank of each column was compared with the mean rank of every othercolumn. Statistically significant difference is denoted by * = P ≤ 0.05. (D) Comparison of ATP-secretion between types of platelet defects identified by lumiaggregometry. Scatter dot plot showing the spread of ATP secretion results between the recruited patients. Healthy controls (n = 42), all HMB patients (n = 155), no defect (n = 89), and defect (n = 66). Horizontal bars indicate median and interquartile range. Statistical analysis was performed using non-parametric Kruskal-Wallis and Dunn’s multiple comparisons test, the mean rank of each column was compared with the mean rank of every other column. Statistically significant difference is denoted by *** = P ≤ 0.001.

References

    1. Quinn SD, Higham J.. Outcome measures for heavy menstrual bleeding. Women’s Health (London, England) 2016January;12(1):21–26. doi:10.2217/whe.15.85 - DOI - PMC - PubMed
    1. Wyatt KM, Dimmock PW, Walker TJ, O’Brien PM. Determination of total menstrual blood loss.Fertil Steril 2001;76(1):125–131. - PubMed
    1. Kirkwood-Wilson R, Bardapure J, Das S. Is heavy menstrual bleeding investigated and managed appropriately? J Obstet Gynaecol 2013April;33(3):282–284. doi:10.3109/01443615.2012.750287 - DOI - PubMed
    1. Peyvandi F, Garagiola I, Menegatti M. Gynecological and obstetrical manifestations of inherited bleeding disorders in women. J Thromb Haemostasis 2011;9:236–245. doi:10.1111/j.1538-7836.2011.04372.x - DOI - PubMed
    1. Munro MG, Critchley HO, Broder MS, Fraser IS. FIGO classification system (PALM-COEIN) for causes of abnormal uterine bleeding in nongravid women of reproductive age. Int J Gynaecol Obstet 2011April;113(1):3–13. doi:10.1016/j.ijgo.2010.11.011 - DOI - PubMed