. 2019 Apr 1;28(7):1136-1152.
doi: 10.1093/hmg/ddy419.

Hereditary spastic paraplegia: gain-of-function mechanisms revealed by new transgenic mouse

Affiliations

Hereditary spastic paraplegia: gain-of-function mechanisms revealed by new transgenic mouse

Liang Qiang et al. Hum Mol Genet. .

Abstract

Mutations of the SPAST gene, which encodes the microtubule-severing protein spastin, are the most common cause of hereditary spastic paraplegia (HSP). Haploinsufficiency is the prevalent opinion as to the mechanism of the disease, but gain-of-function toxicity of the mutant proteins is another possibility. Here, we report a new transgenic mouse (termed SPASTC448Y mouse) that is not haploinsufficient but expresses human spastin bearing the HSP pathogenic C448Y mutation. Expression of the mutant spastin was documented from fetus to adult, but gait defects reminiscent of HSP (not observed in spastin knockout mice) were adult onset, as is typical of human patients. Results of histological and tracer studies on the mouse are consistent with progressive dying back of corticospinal axons, which is characteristic of the disease. The C448Y-mutated spastin alters microtubule stability in a manner that is opposite to the expectations of haploinsufficiency. Neurons cultured from the mouse display deficits in organelle transport typical of axonal degenerative diseases, and these deficits were worsened by depletion of endogenous mouse spastin. These results on the SPASTC448Y mouse are consistent with a gain-of-function mechanism underlying HSP, with spastin haploinsufficiency exacerbating the toxicity of the mutant spastin proteins. These findings reveal the need for a different therapeutic approach than indicated by haploinsufficiency alone.


Figures

Figure 1
Figure 1
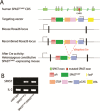
Generation of SPASTC448Y Rosa26 transgenic mouse model. (A) Represents a schematic of the strategy used to generate the Rosa26 knock-in SPASTC448Y mouse model. The numerals identify the human SPAST exons. pA = human growth hormone polyA signal, SPASTC448Y = human mutated SPAST CDS, STOP-neo = STOP neomycin resistance cassette, pCAG = strong fusion promoter of CMV immediate early enhancer and chicken α-actin promoter, DTA = Diphteria toxin A negative selection marker. (B) gDNA products from qPCR were run on 1% agarose gel to visualize the SPAST band among the three genotypes.
Figure 2
Figure 2
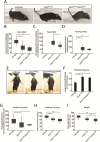
Gait impairment in SPASTC448Y mice assessed by behavioral assays. (A) Representative pictures of mice while performing the beam walk assay, highlighting a prominent defect in normal gripping of the beam (compare the red dashed circle in wild-type with the yellow dashed one) in SPASTC448Y/- and SPASTC448Y/SPASTC448Y mice compared to wild-type. (B) Percentage of SPASTC448Y/- and SPASTC448Y/SPASTC448Y mice showing a normal beam walk phenotype is significantly decreased compared to wild-type. (C) Age of disease onset in days for mice with consecutive beam walk scores of 2. No wild-type mice displayed consecutive scores of 2. (D) Onset ages for resting tremor. Only one wild-type mouse displayed a positive tremor. (E) Mice tested for the hindlimb clasping assay are shown. The dashed light blue triangles highlight differences in the hindlimb splayed angle. (F) Average hindlimb clasping score was evaluated in mice > 60 days of age. (G) Age of disease onset was also evaluated for mice with consecutive hindlimb clasping scores of 1. (H) The splayed hindlimb angle was quantified for the three groups, with a significantly decreased angle in both SPASTC448Y/- and SPASTC448Y/SPASTC448Y compared to wild-type. (I) Decreased body weight was observed in adult mice (>150 days). The number of mice used for the beam walk assay was n = 15 mice for wild-type, n = 21 mice for SPASTC448Y/- and n = 14 mice for SPASTC448Y/SPASTC448Y. The number of mice for the hindlimb clasping assay was n = 15 mice for wild-type, n = 22 mice for SPASTC448Y/- and n = 12 mice for SPASTC448Y/SPASTC448Y. The number of mice for the resting tremor assay was n = 13 mice for wild-type, n = 18 mice for SPASTC448Y/- and n = 15 mice for SPASTC448Y/SPASTC448Y. Data are represented as mean ± S.E.M. For statistical tests, one-way analysis of variance (ANOVA) with Tukey post hoc analysis was conducted. *P < 0.05, **P < 0.002, ***P < 0.001. For details on scoring system, see Results. For additional information related to this figure, see Supplementary Material, Table 1.
Figure 3
Figure 3
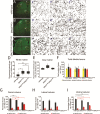
Changes in axon shape at the lumbar level of the spinal cord. (AC) Cross sections of the lumbar spinal cord stained for SMI312 show increased fluorescence intensity per 100 μm2 in the white matter. (D) Quantification shows increased white matter SMI312 fluorescence intensity in SPASTC448Y/- and SPASTC448Y/SPASTC448Y mice compared to wild-type. The average ± S.E.M. is 12.31 ± 1.31, 25.91 ± 2.43, and 29.54 ± 1.67 for wild-type, SPASTC448Y/-, and SPASTC448Y/SPASTC448Y, respectively. (E) No significant changes were observed in the grey matter. (F) No significant changes were observed in the total axon number per 100 μm2 in the dorsal column, lateral column and ventral column (a’–c”’). (G) Quantification of axons in the dorsal column shows that axon shape is significantly different among the groups, and a more irregular shape is found in both SPASTC448Y/- and SPASTC448Y/SPASTC448Y, with the percentage of irregular axons as 24% ± 3.51% in SPASTC448Y/- and 43% ± 3.48% in SPASTC448Y/SPASTC448Y compared to 12% ± 3.52% in wild-type. (H) No significant changes in axon shape were observed in the lateral column. (I) The percentage of irregular axons is also increased in the ventral column in both SPASTC448Y/- and SPASTC448Y/SPASTC448Y, quantified as 9.91% ± 2.42% in wild-type, 21.61% ± 6.22% in SPASTC448Y/- and 36.83% ± 2.36% in SPASTC448Y/SPASTC448Y. Scale bar = 200 μm for A–C, and scale bar = 100 μm for (a’–c”’). Histology was quantified in three mice for each genotype. Data are represented as mean ± S.E.M. For statistical tests, one-way ANOVA with Tukey post hoc analysis was conducted. *P < 0.05, **P < 0.002, ***P < 0.001.
Figure 4
Figure 4
Progressive loss of axons in the dorsal column of the spinal cord in both SPASTC448Y/- and SPASTC448Y/SPASTC448Y mice. Higher magnification toluidine blue-stained images of the dorsal columns at the lumbar level showing that compared to (A) wild-type, (B) SPASTC448Y/- and (C) SPASTC448Y/SPASTC448Y mice show decreased axon numbers. The total numbers of axons per 100 μm2 were quantified at both cervical and lumbar levels for the dorsal, lateral and ventral columns. (D) No significant differences in axon numbers among the three regions at the cervical level were observed. (E) Significantly reduced axon numbers were identified in the dorsal columns from the mutant animals (both SPASTC448Y/- and SPASTC448Y/SPASTC448Y) at the lumber levels. Data are represented as mean ± S.E.M. For statistical tests, one-way ANOVA with Tukey post hoc analysis was conducted. Scale bar = 20 μm. **P < 0.002, ***P < 0.001. For additional information related to this figure, see Supplementary Material, Table 2.
Figure 5
Figure 5
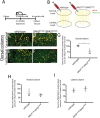
Anterograde tracing highlights degenerating axons in the spinal cord of SPASTC448Y/SPASTC448Y mice. (A) The schematic shows that mice 5 months old were used for the anterograde tracing studies. BDA dye was injected at the C1/2 level and then tissues were collected 4 weeks later. (B) The cartoon illustrates the injection approach for the analyses. (CF) Magnifications of the dorsal column at cervical and lumbar levels for both wild-type and SPASTC448Y/SPASTC448Y highlight decreased numbers of double-labeled axons in the SPASTC448Y/SPASTC448Y mice. Percentage of double-labeled axons was quantified as the ratio between the cervical and lumbar levels. (G) The quantification for the dorsal column shows only 56% ± 20% of double-labeled axons in SPASTC448Y/SPASTC448Y mice relative to control. (HI) Quantifications of the ventral (H) and lateral (I) columns do not show significant differences in double-labeled axons between wild-type and SPASTC448Y/SPASTC448Y. The histology was quantified in three mice for each genotype. Data are represented as mean ± S.E.M. For statistical analysis, Student’s t-test (two-tailed) was performed. Scale bar = 100 μm. *P < 0.05.
Figure 6
Figure 6
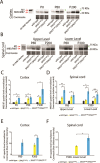
Evaluation of M1 and M85/M87 spastin isoform expression in the cortex and spinal cord. (AB) Representative western blots of lysates from the cortex (A) and spinal cord (B) from wild-type, SPASTC448Y/- and SPASTC448Y/SPASTC448Y mice at ages P0, P80 and P200. (C) Quantifications of spastin intensity were normalized with Coomassie staining and compared to wild-type. Data are represented as mean ± S.E.M., with wild-type animal values normalized to 1. (D) Quantifications of M85/M87 spastin expression in upper and lower spinal cord levels at P80 and at P200 for wild-type, SPASTC448Y/- and SPASTC448Y/SPASTC448Y mice. (E) M1 isoform is also detected in SPASTC448Y/- at P200 and in SPASTC448Y/SPASTC448Y at both P80 and P200, as highlighted by the green arrowheads in (A). Analyses were conducted by normalizing the M1 band intensity with Coomassie staining and expressed as mean ± S.E.M. Bar graph shows the quantifications of cortex lysates at P80 and at P200. (F) At P200, M1 is also detected in spinal cord tissues of SPASTC448Y/- and SPASTC448Y/SPASTC448Y. Western blot lysates were collected from three mice for each genotype for all ages. For statistical tests, one-way ANOVA with Tukey post hoc analysis was conducted. *P < 0.05, **P < 0.002. For additional information related to this figure, see Supplementary Material, Table 3.
Figure 7
Figure 7
Western blot analysis reveals changes in microtubule stability. (A) Representative western blots of upper and lower spinal cord immunoblotted for acetylated tubulin, detyrosinated tubulin and βIII-tubulin. (BD) All western blot analyses were normalized to GAPDH. (B) Analysis of βIII-tubulin revealed no significant changes in the expression level at upper and lower spinal cords. (C) Analysis for acetylated tubulin revealed a decrease in microtubule stability at the lower spinal cord for SPASTC448Y/- and SPASTC448Y/SPASTC448Y, with expression levels at 1 ± 0.1, 0.739 ± 0.006 and 0.565 ± 0.116 for wild-type, SPASTC448Y/- and SPASTC448Y/SPASTC448Y, respectively. (D) Detyrosinated tubulin also revealed a decrease in microtubule stability at the lower spinal cord for SPASTC448Y/- and SPASTC448Y/SPASTC448Y, with expression at 1 ± 0.01, 0.605 ± 0.020 and 0.358 ± 0.091 for wild-type, SPASTC448Y/- and SPASTC448Y/SPASTC448Y, respectively. Western blot lysates were collected from three mice for each genotype. For statistical tests, one-way ANOVA with Tukey post hoc analysis was conducted. *P < 0.05, **P < 0.002, ***P < 0.001.
Figure 8
Figure 8
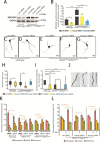
Functional analysis reveals morphological changes and lysosomal transport alterations in primary cortical neurons derived from SPASTC448Y mice. (A) Representative western blot on primary cortical neurons from wild-type and SPASTC448Y/SPASTC448Y P0 mice transfected with control (ctrl), mouse spastin or human spastin siRNA. (B) Quantifications of spastin expression in cell lysates with ctrl, mouse, or human siRNA were normalized to GAPDH and compared to wild-type. Data are represented as mean ± S.E.M., with wild-type ctrl siRNA taken as 1. (CG) Representative images show the morphology of primary cortical neurons after transfection of cells with ctrl, mouse or human spastin siRNA. (H) Quantifications of axonal length are shown as mean ± S.E.M. for wild-type or SPASTC448Y/SPASTC448Y with ctrl, mouse or human siRNA. (I) Primary branch numbers of the axon have been quantified as shown. (J) Representative kymographs showing retrograde, halted and stationary movements during lysosomal transport. (K) Quantification of lysosomal movement in cortical neurons from wild-type or SPASTC488Y mice. Neurons were transfected with ctrl, mouse spastin or human spastin siRNA and exposed to lysotracking dye for 5 h, after which they were imaged for 2 min. Percent of retrograde (red), halted (orange) and stationary (green) movement of lysosomes was quantified as mean ± S.E.M. (L) Quantifications of retrograde, halted, stationary lysosomal transport in SPASTC448Y/SPASTC448Y with ctrl, mouse or human siRNA after treatment with 20 μm TBCA for 24 h are expressed as percentage ± S.E.M. The total number of events for this experiment is n = 21 for the ctrl siRNA, n = 25 for the mouse spastin siRNA and n = 22 for the human spastin siRNA; while in the presence of TBCA, n = 23 for ctrl siRNA, n = 24 for mouse spastin siRNA and n = 26 for human spastin siRNA. Scale bar = 50 μm. For statistical tests, one-way ANOVA with Tukey post hoc analysis was conducted. *P < 0.05, **P < 0.002, ***P < 0.001. For additional information related to this figure, see Supplementary Material, Table 4.

References

    1. McDermott C., White K., Bushby K. and Shaw P. (2000) Hereditary spastic paraparesis: a review of new developments. J. Neurol. Neurosurg. Psychiatry, 69, 150–160. - PMC - PubMed
    1. Denton K.R., Xu C., Shah H. and Li X.J. (2016) Modeling axonal defects in hereditary spastic paraplegia with human pluripotent stem cells. Front. Biol. (Beijing), 11, 339–354. - PMC - PubMed
    1. Hazan J., Fonknechten N., Mavel D., Paternotte C., Samson D., Artiguenave F., Davoine C.S., Cruaud C., Durr A., Wincker P. et al. (1999) Spastin, a new AAA protein, is altered in the most frequent form of autosomal dominant spastic paraplegia. Nat. Genet., 23, 296–303. - PubMed
    1. Fonknechten N., Mavel D., Byrne P., Davoine C.S., Cruaud C., Bonsch D., Samson D., Coutinho P., Hutchinson M., McMonagle P. et al. (2000) Spectrum of SPG4 mutations in autosomal dominant spastic paraplegia. Hum. Mol. Genet., 9, 637–644. - PubMed
    1. Burger J., Fonknechten N., Hoeltzenbein M., Neumann L., Bratanoff E., Hazan J. and Reis A. (2000) Hereditary spastic paraplegia caused by mutations in the SPG4 gene. Eur. J. Hum. Genet., 8, 771–776. - PubMed

Publication types