. 2018 Dec 6;18(1):76.
doi: 10.1186/s12896-018-0485-3.

High-yield production of human Dicer by transfection of human HEK293-EBNA1 cells grown in suspension

Affiliations

High-yield production of human Dicer by transfection of human HEK293-EBNA1 cells grown in suspension

Jonathan Bouvette et al. BMC Biotechnol. .

Abstract

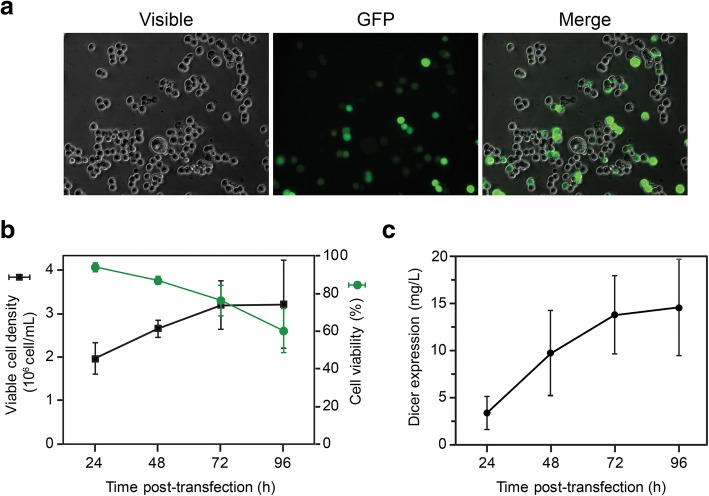
Background: Dicer is a 219-kDa protein that plays key roles in gene regulation, particularly as the ribonuclease III enzyme responsible for cleaving precursor miRNA substrates. Its enzymatic activity is highly regulated by protein factors, and this regulation can impact on the levels of miRNAs and modulate the behavior of a cell. To better understand the underlying mechanisms of regulation, detailed enzymatic and structural characterization of Dicer are needed. However, these types of studies generally require several milligrams of recombinant protein, and efficient preparation of such quantities of pure human Dicer remains a challenge. To prepare large quantities of human Dicer, we have optimized transfection in HEK293-6E cells grown in suspension and streamlined a purification procedure.

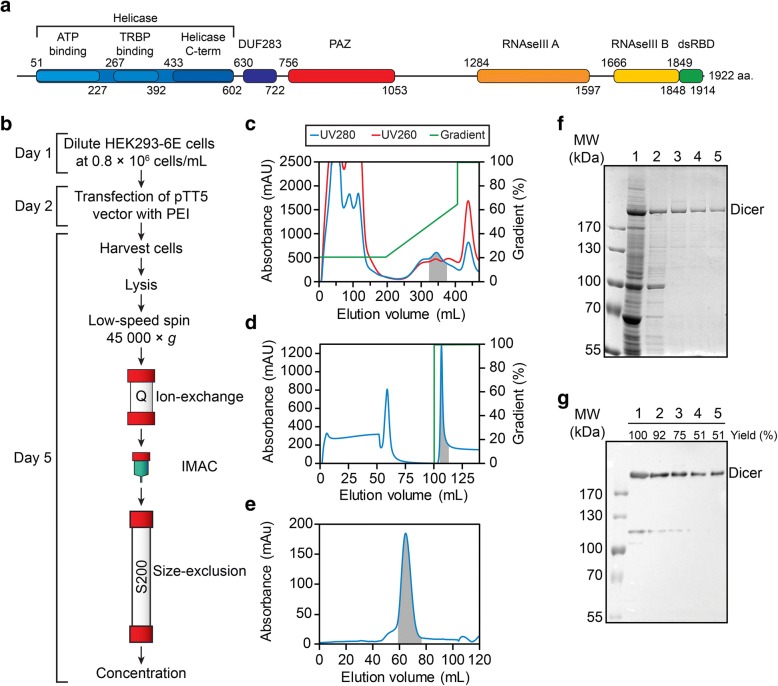
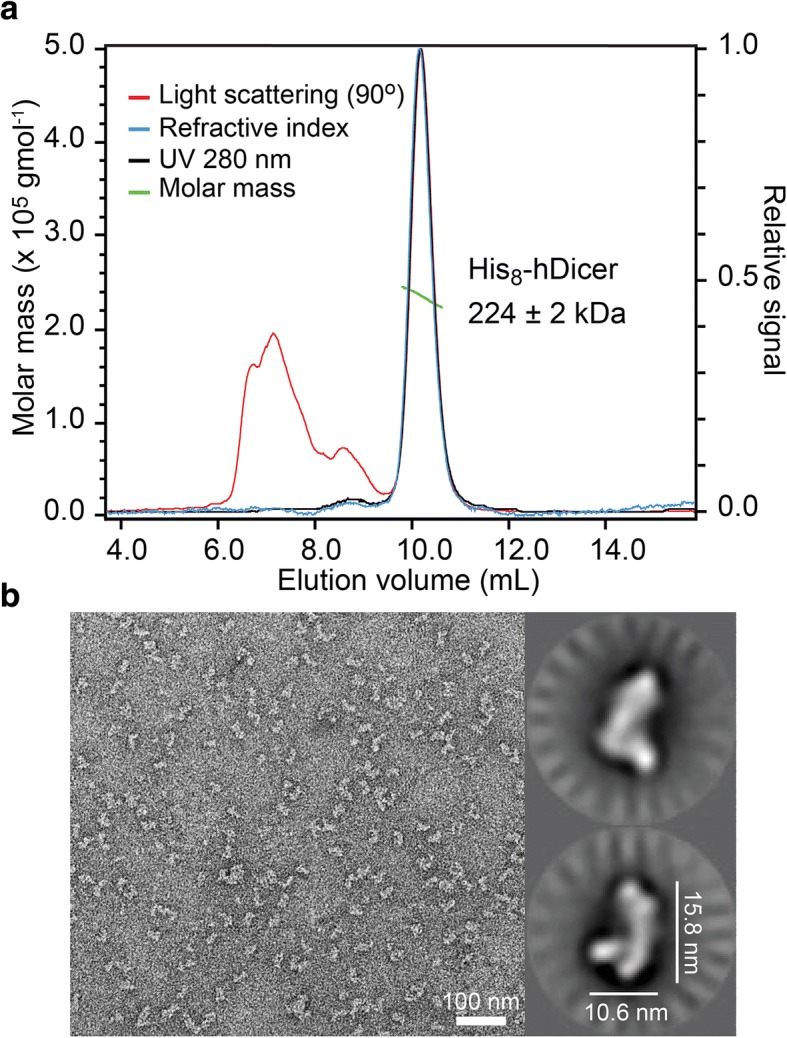
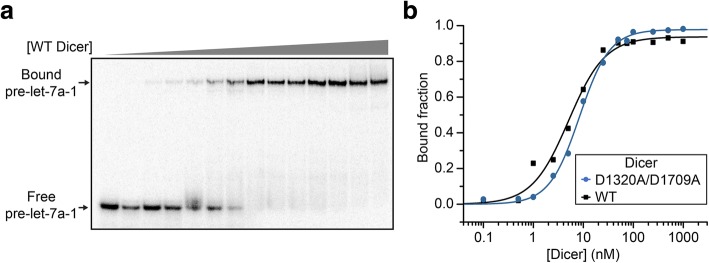
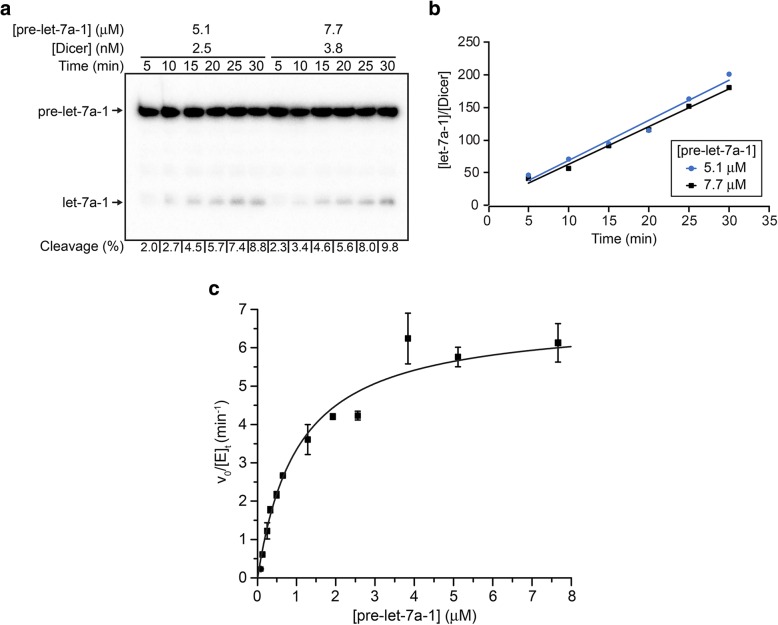
Results: Transfection conditions were first optimized to achieve expression levels between 10 and 18 mg of recombinant Dicer per liter of culture. A three-step purification protocol was then developed that yields 4-9 mg of purified Dicer per liter of culture in a single day. From SEC-MALS/RI analysis and negative stain TEM, we confirmed that the purified protein is monomerically pure ( ≥ 98%) and folds with the characteristic L-shape geometry. Using an electrophoretic mobility shift assay, a dissociation constant (Kd) of 5 nM was measured for Dicer binding to pre-let-7a-1, in agreement with previous reports. However, when probing the cleavage activity of Dicer for pre-let-7a-1, we measured kcat (7.2 ± 0.5 min- 1) and KM (1.2 ± 0.3 μM) values that are much higher than previously reported due to experimental conditions that better respect the steady-state assumption.

Conclusions: The expression and purification protocols described here provide high yields of monomerically pure and active human Dicer. Cleavage studies of a pre-let-7 substrate with this purified Dicer reveal higher kcat and KM values than previously reported and support the current view that conformational changes are associated with substrate binding. Large quantities of highly pure Dicer will be valuable for future biochemical, biophysical and structural investigations of this key protein of the miRNA pathway.

Keywords: Dicer binding; Dicer cleavage assay; Dicer expression; Dicer purification; Human HEK293-EBNA1 cells; Mammalian cell suspension culture; Pre-let-7; Pre-miRNA.


Conflict of interest statement

Ethics approval and consent to participate

Not applicable.

Consent for publication

Not applicable.

Competing interests

The authors declare that they have no competing interests.

Publisher’s Note

Springer Nature remains neutral with regard to jurisdictional claims in published maps and institutional affiliations.

Figures

Fig. 1
Fig. 1
Transfection of small suspension cultures with Dicer-expressing plasmid. 293-6E cells were transfected with PEI:pTT5-DNA complexes at a 2:1 mass ratio and monitored after transfection. (a) Transfection efficiency at 48 hpt. A total of 36 ± 7% of the cells are expressing GFP (n = 4). (b) Cell density and viability (n = 4). (c) Expression of cytoplasmic Dicer. Dicer quantification was derived from Western blot analysis using a standard curve of pure recombinant Dicer (n = 4). Transfections in (b) and (c) were performed in 20-mL cultures grown in 125-mL Erlenmeyer flasks and the results are means ± standard deviation values of replicates (n) from independent transfections experiments
Fig. 2
Fig. 2
Dicer expression and purification. (a) Domain architecture of Dicer. Domains were positioned using InterPro [56] and refined using available structural data [, –59]. (b) Flowchart of the Dicer expression and purification protocol. (Day 1) Cells are passaged at 0.8 × 106 cells/mL and incubated 24 h before transfection. (Day 2) The transfection mix is prepared and added to the cell culture, which is incubated for 72 h (37 °C, 5% CO2) with shaking (100 RPM). (Day 5) Cells are harvested by centrifugation at 200×g and rinsed 3 times in cold PBS. After lysis, the cytoplasmic fraction is clarified by centrifugation, filtered and loaded on a 60-mL Q Sepharose Fast Flow column for ion-exchange chromatography. Fractions containing Dicer are pooled and loaded directly on a 5-mL HisTrap HP column for purification by immobilized metal affinity chromatography (IMAC). The Dicer-containing fractions are loaded directly on a 120-mL Superdex 200 column for purification by size-exclusion, and the fractions containing homogeneous Dicer are concentrated and stored at − 80 °C. (c-e) Typical chromatograms from the (c) ion-exchange, (d) affinity and (e) size-exclusion purifications, showing the UV absorbance at 280 nM and 260 nM along with the gradient trace. The selected fractions are highlighted by the grey area. (f-g) SDS-PAGE summary of the purification viewed by (f) Coomassie stain and (g) Western blot. Each lane is loaded proportionally to reflect the yield at each step (Lane 1: clarified lysate; Lane 2: ion-exchange fraction pool; Lane 3: affinity fraction pool; Lane 4: size-exclusion fraction pool; and Lane 5: concentrated protein). Yields were quantified from Western blot analysis, with loaded quantities of Dicer being in the linear range of detection
Fig. 3
Fig. 3
Conformational characterization of purified Dicer. (a) SEC-MALS/RI analysis of purified WT Dicer stored in sucrose/DDM-free storage buffer. The relative signal of light scattering (red), refractive index (blue), and UV absorbance at 280 nm (black) are represented by solid lines. The molar mass distribution is shown with green dots. A small amount of aggregated protein can be seen mainly from the light scattering signal. Peak integration of the UV absorbance trace shows that the main peak contains ≥98% of the eluted protein. The molar mass calculated from MALS analysis was normalized against BSA to give an average molecular weight of 224 ± 2 kDa with a polydispersity index of 1.02 ± 0.01 over the entire eluted peak. (b) Negative stain TEM. Left panel Typical grid imaging of negatively-stained WT Dicer. Right panels Main 2D class averages of WT Dicer
Fig. 4
Fig. 4
Binding studies of Dicer to pre-let-7a-1. (a) Typical EMSA performed with 10 pM of 5′-[32P]-labeled pre-let-7a-1 and increasing concentrations of the D1320A/D1709A Dicer variant (0, 0.1, 0.5, 1, 2.5, 5, 10, 25, 50, 75, 100, 250, 500 and 1000 nM). (b) Typical binding curves of D1320A/D1709A Dicer and WT Dicer to pre-let-7a-1. The data shown here were fitted to the Hill equation to obtain Kd values of 5.1 ± 0.6 nM (WT Dicer) and 8.4 ± 0.4 nM (D1320A/D1709A Dicer) with Hill coefficient of 1.2 ± 0.1 and 1.4 ± 0.1, respectively. Averages from at least three independent experiments yield Kd values of 5 ± 1 nM (WT Dicer) and 9 ± 1 nM (D1320A/D1709A Dicer) with Hill coefficient of 1.3 ± 0.2 and 1.4 ± 0.3, respectively
Fig. 5
Fig. 5
Steady-state kinetics for cleavage of pre-let-7a-1 by Dicer. (a) Typical Dicer cleavage reaction of 5′-[32P]-labeled pre-let-7a-1 with Dicer analyzed by denaturing gel electrophoresis. Reactions were carried for 30 min in conditions that allowed less than 10% of total substrate cleavage. (b) Normalized product formation ([let-7a-1]/[Dicer]) as a function of time for cleavage data shown in (a). The turnover frequency, expressed as vo/[E]t, was calculated by linear regression of the slope (5.8 ± 0.3 min− 1 and 6.1 ± 0.5 min− 1 for pre-let-7a-1 substrate concentration of 5.1 μM and 7.7 μM, respectively). (c) Typical steady-state kinetic analysis showing the dependence of the turnover frequency on substrate concentration (0.08 to 7.68 μM). The data shown here were fitted to the Michealis-Menten equation to yield kcat of 6.8 ± 0.8 min− 1 and KM of 1.0 ± 0.2 μM. Averages from two independent experiments yield kcat of 7.2 ± 0.5 min− 1 and KM of 1.2 ± 0.3 μM

References

    1. Song MS, Rossi JJ. Molecular mechanisms of dicer: endonuclease and enzymatic activity. Biochem J. 2017;474(10):1603–1618. - PMC - PubMed
    1. Foulkes WD, Priest JR, Duchaine TF. DICER1: mutations, microRNAs and mechanisms. Nat Rev Cancer. 2014;14(10):662–672. - PubMed
    1. Kozomara A, Griffiths-Jones S. miRBase: annotating high confidence microRNAs using deep sequencing data. Nucleic Acids Res. 2014;42(Database issue):D68–D73. - PMC - PubMed
    1. Friedman RC, Farh KK, Burge CB, Bartel DP. Most mammalian mRNAs are conserved targets of microRNAs. Genome Res. 2009;19(1):92–105. - PMC - PubMed
    1. Cheloufi S, Dos Santos CO, Chong MM, Hannon GJ. A dicer-independent miRNA biogenesis pathway that requires ago catalysis. Nature. 2010;465(7298):584–589. - PMC - PubMed

Publication types

MeSH terms

Substances