. 2019 Jan 16;101(2):246-259.e6.
doi: 10.1016/j.neuron.2018.11.018. Epub 2018 Dec 3.

Mechanisms Underlying Microbial-Mediated Changes in Social Behavior in Mouse Models of Autism Spectrum Disorder

Affiliations

Mechanisms Underlying Microbial-Mediated Changes in Social Behavior in Mouse Models of Autism Spectrum Disorder

Martina Sgritta et al. Neuron. .

Abstract

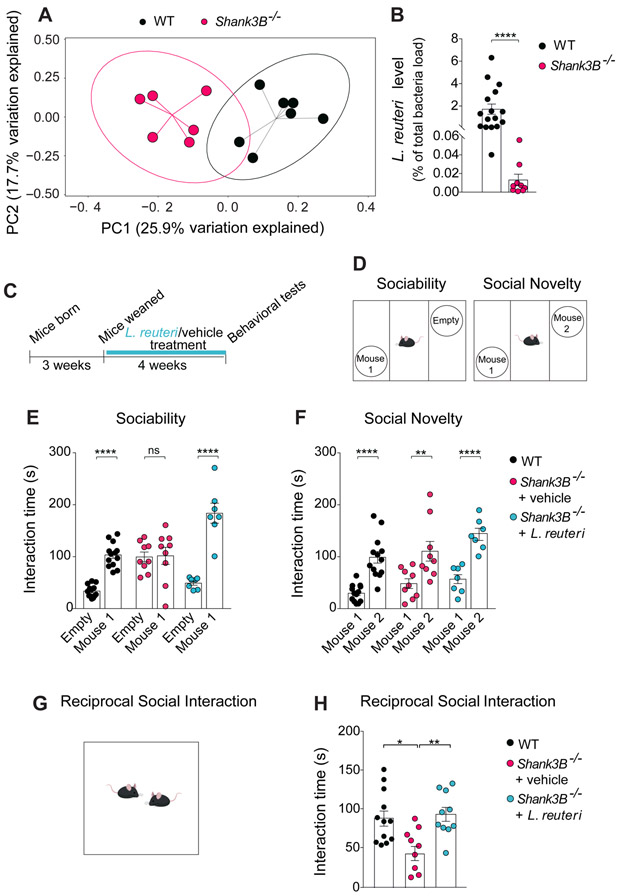
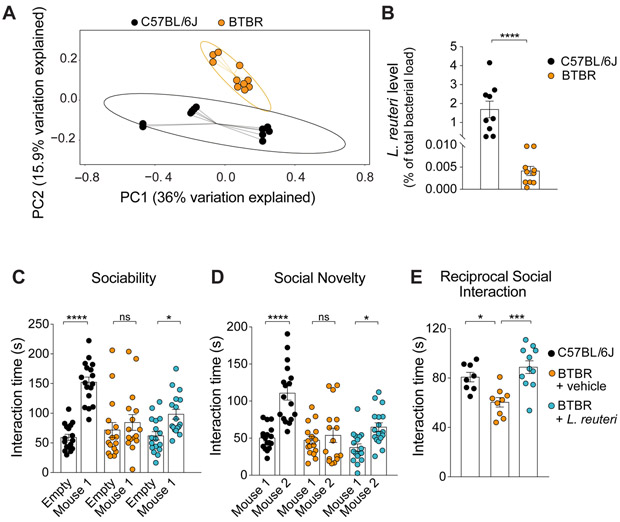
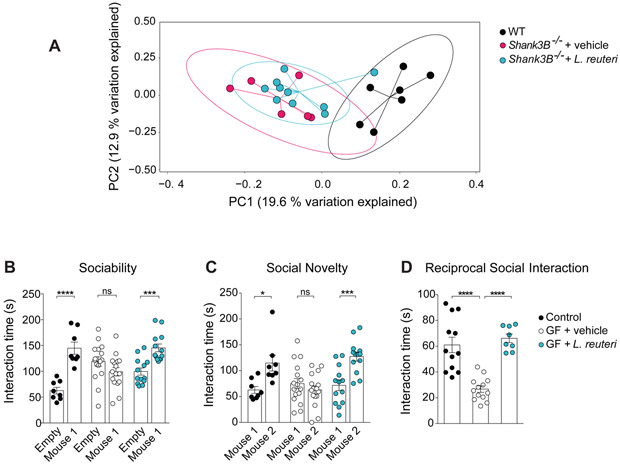
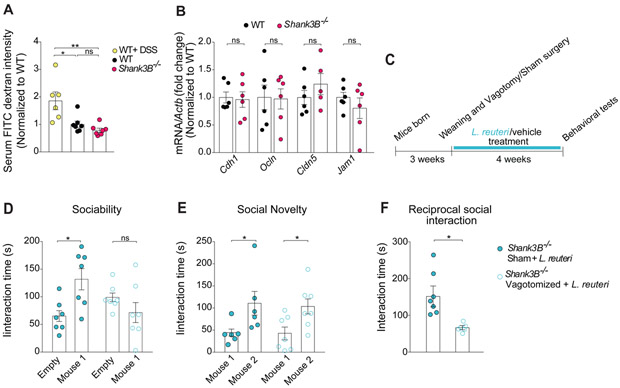
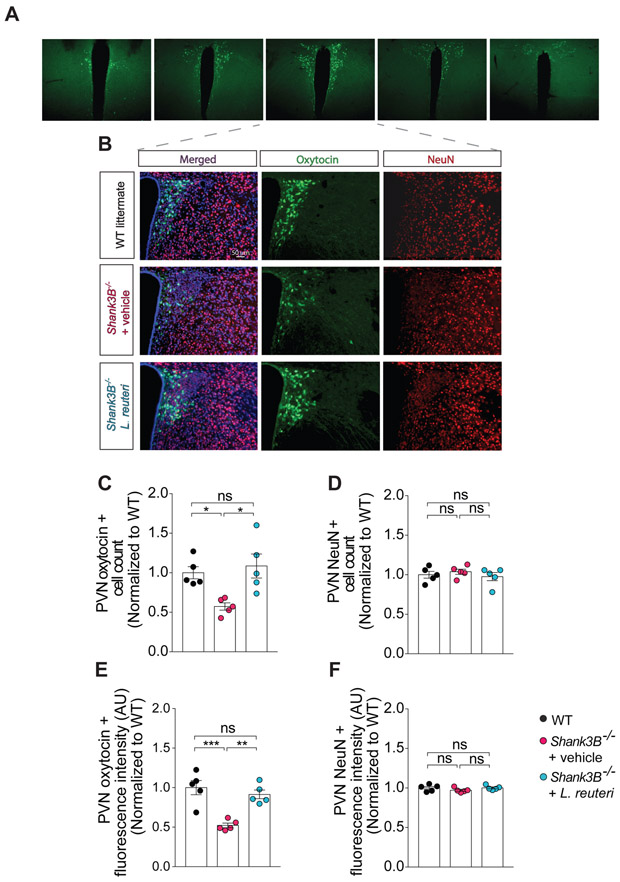
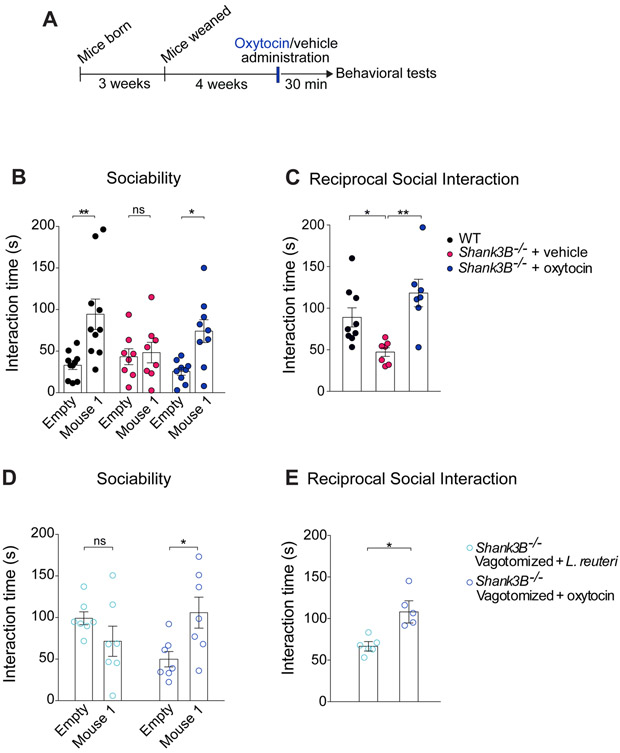
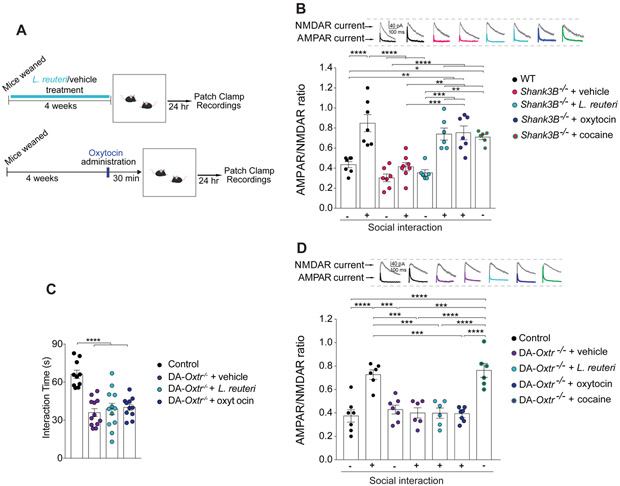
Currently, there are no medications that effectively treat the core symptoms of Autism Spectrum Disorder (ASD). We recently found that the bacterial species Lactobacillus (L.) reuteri reverses social deficits in maternal high-fat-diet offspring. However, whether the effect of L. reuteri on social behavior is generalizable to other ASD models and its mechanism(s) of action remains unknown. Here, we found that treatment with L. reuteri selectively rescues social deficits in genetic, environmental, and idiopathic ASD models. Interestingly, the effects of L. reuteri on social behavior are not mediated by restoring the composition of the host's gut microbiome, which is altered in all of these ASD models. Instead, L. reuteri acts in a vagus nerve-dependent manner and rescues social interaction-induced synaptic plasticity in the ventral tegmental area of ASD mice, but not in oxytocin receptor-deficient mice. Collectively, treatment with L. reuteri emerges as promising non-invasive microbial-based avenue to combat ASD-related social dysfunction.

Keywords: autism; dopamine; gut-microbiota-brain axis; microbiome; oxytocin; probiotic; social behavior; vagus nerve.


Figures

Figure 1.
Figure 1.. Shank3B−/− mice exhibit changes in their microbial composition, reduced L. reuteri levels, and social deficits that were rescued by treatment with L. reuteri.
(A) Principal coordinates analysis (PCoA) of unweighted UniFrac distances from the 16S rRNA gene sequencing data set shows that Shank3B−/− samples clustered separately from those of WT littermates (n = 6-7 per group; p < 0.01, R2 = 0.225; 8024 reads/sample). (B) qPCR analysis shows lower levels of L. reuteri in Shank3B−/− mice (as % of total bacteria, n = 9-16 per group; WT vs. Shank3B−/−: Mann-Whitney Test p < 0.0001). (c)Schematic of experimental design. (D)Schematic of the three-chamber task. (E-F) In Shank3B−/− mice, L reuteri rescued social behavior deficits in the three chamber test (E, Sociability, n = 7-13 per group; WT: t = 5.68, p < 0.0001; Shank3B−/− + vehicle: t = 0.14, p = 0.99; Shank3B−/− + L. reuteri: t = 8.066, p < 0.0001; two-way ANOVA F2,52 = 17.9, p < 0.0001; F, Social Novelty, n = 7-13 per group; WT: t = 5.01, p < 0.0001; Shank3B−/− + vehicle: t = 3.75, p < 0.01; Shank3B−/− + L. reuteri: t = 4.63, p < 0.0001; two-way ANOVA F2,52 = 0.52, p = 0.59). (G)Schematic of the reciprocal social interaction task. (H)L. reuteri rescued reciprocal social interaction deficits in Shank3B−/− mice (n = 9-12 pairs per group; WT vs. Shank3B−/− + vehicle: t = 3.03, p < 0.05; Shank3B−/− + vehicle vs. Shank3B−/− + L. reuteri: t = 3.20, p < 0.01; WT vs. Shank3B−/− + L. reuteri: t = 0.32, p > 0.99; one-way ANOVA F2,28 = 6.3, p = 0.0055). ns, not significant. Plots show mean ± SEM. See also Figure S1-S5, S15.
Figure 2.
Figure 2.. BTBR mice exhibit changes in microbial composition, reduced L. reuteri levels, and social deficits that were rescued by treatment with L. reuteri.
(A) PCoA of unweighted UniFrac distances from the 16S rRNA gene sequencing data set shows that BTBR samples clustered separately from C57BL/6J samples (n = 10-11 per group; p < 0.01, R2 = 0.164; 8024 reads/sample). (B) qPCR analysis shows lower levels of L. reuteri (as % of total bacteria, n = 9-10 per group; C57BL/6J vs. BTBR: Mann-Whitney Test p < 0.0001) in BTBR mice. (C-E) In BTBR mice, L. reuteri rescued social behavior deficits in the three chamber test (C, Sociability, n = 16-17 per group; C57BL/6J: t = 7.033, p < 0.0001; BTBR + vehicle: t = 0.93, p > 0.99; BTBR + L. reuteri: t = 2.75, p < 0.05; two-way ANOVA F2,94 = 9.54, p < 0.001; D, Social Novelty, n = 16-17 per group; C57BL/6J: t = 6.35, p < 0.0001; BTBR + vehicle: t = 0.67, p > 0.99; BTBR + L. reuteri: t = 2.87, p < 0.05; two-way ANOVA F2,94 = 7.935, p < 0.001) and the reciprocal social interaction test (E, n = 8-11 pairs per group; C57BL/6J vs. BTBR + vehicle: t = 3.03, p < 0.05; BTBR + vehicle vs. BTBR + L. reuteri: t = 4.57, p < 0.001; C57BL/6J vs. BTBR + L. reuteri: t = 1.25, p =0.67; one-way ANOVA F2,27 = 10.79, p < 0.001). ns, not significant. Plots show mean ± SEM. See also Figure S6, S7, S15.
Figure 3.
Figure 3.. L. reuteri does not change the microbial composition of Shank3B−/− mice and is sufficient to rescue social deficits in germ-free (GF) mice.
(A)PCoA of unweighted UniFrac distances from the 16S rRNA gene sequencing data set shows treatment with L. reuteri did not significantly alter the clustering of Shank3B−/− samples (n = 6-10 per group; p < 0.001; R2 = 0.215, 8024 reads/sample). (B-D) In GF mice, L. reuteri reversed social behavior deficits in the three-chamber test (B, Sociability, n = 8-16 per group; Controls: t = 5.44, p < 0.0001; GF + vehicle: t = 1.87, p = 0.20; GF + L. reuteri: t = 3.85, p < 0.001; two-way ANOVA F2,68 = 16.64, p < 0.0001; C, Social Novelty, n = 8-16 per group; Controls: t = 3.00, p < 0.05; GF + vehicle: t = 1.28, p = 0.61; GF + L. reuteri: t = 4.10, p < 0.001; two-way ANOVA F2,68 = 7.63, p = 0.0010) and the reciprocal social interaction test (D, n = 8-13 pairs per group; Controls vs. GF + vehicle: t = 5.89, p < 0.0001; Controls vs. GF + L. reuteri: t = 0.77, p > 0.99; GF + vehicle vs. GF + L. reuteri: t = 6.03, p < 0.0001; one-way ANOVA F2,30 = 24.87, p < 0.0001). ns, not significant. Plots show mean ± SEM. See also Figure S8.
Figure 4.
Figure 4.. Shank3B−/− mice show no alterations in intestinal permeability and L. reuteri fails to improve social behavior in vagotomized Shank3B−/− mice.
(A) Intestinal permeability assay by FITC intensity shows no difference between Shank3B−/− mice and WT littermates (n = 6-7 per group; WT + DSS vs. WT: t = 3.17, p < 0.05; WT+ DSS vs. Shank3B−/−: t = 3.95, p < 0.01; WT vs. Shank3B−/−: t = 0.81, p > 0.99; one-way ANOVA F2.17 = 8.6, p = 0.0026). (B) Expression of gut tight junction components was unaltered in Shank3B−/− mice, as determined by RT-qPCR (n = 5-6 per group; WT vs. Shank3B−/−: Cdh1 t = 0.17, p > 0.99; Ocln t = 0.13, p > 0.99, Cldn5 t = 1.03, p > 0.99; Jam1 t = 0.87, p > 0.99; one-way ANOVA F3,39 = 0.62, p = 0.60). (C) Schematic of the vagotomy experimental design. (D-F) In vagotomized Shank3B−/− mice, L. reuteri failed to reverse social behavior deficits in the three-chamber test (D, Sociability, n = 7 per group; Shank3B−/− Sham + L. reuteri: t = 3.22, p < 0.05; Shank3B−/− Vagotomized + L. reuteri: t = 1.33, p = 0.35; two-way ANOVA F1,24 = 10,4, p = 0.003; E, Social Novelty, n = 7 per group; Shank3B−/− Sham + L. reuteri: t = 2.56, p < 0.05; Shank3B−/− Vagotomized + L. reuteri: t = 2.60, p < 0.05; two-way ANOVA F1,22 = 0.028, p = 0.86) and reciprocal social interaction test (F, n = 6-7 pairs per group; Shank3B−/− Sham + L. reuteri vs. Shank3B−/− Vagotomized + L. reuteri: Mann-Whitney Test p < 0.01). DSS, dextran sodium sulfate; ns, not significant. Plots show mean ± SEM. See also Figure S9.
Figure 5.
Figure 5.. L. reuteri treatment corrects oxytocin levels in the PVN of the hypothalamus of Shank3B−/− mice.
(A) Representative images of oxytocin positive neurons at different antero-posterior levels of the PVN of control mice. (B) Oxytocin immunoreactivity in the PVN of WT and Shank3B−/− mice treated with either vehicle or L. reuteri. (C-F) Oxytocin positive cell number (C, n = 5 mice per group; WT vs. Shank3B−/− + vehicle: t = 2.96, p < 0.05; Shank3B−/− + vehicle vs. Shank3B−/− + L. reuteri: t = 3.64, p < 0,05; WT vs. Shank3B−/− + L. reuteri: t = 0.59, p > 0.99; one-way ANOVA F2,12 = 7.28, p = 0.0085) and oxytocin immunofluorescence intensity (E, n = 5 mice per group; WT vs. Shank3B−/− + vehicle: t = 5.38, p < 0.001; Shank3B−/− + vehicle vs. Shank3B−/− + L. reuteri: t = 4.41, p < 0.01; WT vs. Shank3B−/− + L. reuteri: t = 0.96, p = 0.0025; one-way ANOVA F2,12 = 16.49, p = 0.0004) are restored after L. reuteri treatment. The number (D, n = 5 mice per group, WT vs. Shank3B−/− + vehicle: t = 0.62, p > 0.99; Shank3B−/− + vehicle vs. Shank3B−/− + L. reuteri: t = 1.01, p = 0.99, WT vs. Shank3B−/− + L. reuteri: t = 0.38, p > 0.99; one-way ANOVA F2.12 = 0.52, p = 0.60) and the fluorescence intensity (F, n = 5 mice per group, WT vs. Shank3B−/− + vehicle: t = 1.34, p = 0.61; Shank3B−/− + vehicle vs. Shank3B−/− + L. reuteri: t = 1.42, p = 0.54; WT vs. Shank3B−/− + L. reuteri: t = 0.07, p > 0.99; one-way ANOVA F2,12 = 1.27, p = 0.31) of NeuN positive cells did not change between the groups. ns, not significant. Plots show mean ± SEM.
Figure 6.
Figure 6.. Oxytocin administration rescues social deficits in both Shank3B−/− and Shank3B−/− vagotomized mice.
(A) Schematic of experimental design. (B-C) In Shank3B−/− mice, oxytocin improved social behavior deficits in the three-chamber test (B, Sociability, n = 8-10 per group; WT: t = 3.84, p < 0.01; Shank3B−/− + vehicle: t = 0.28, p > 0.99; Shank3B−/− + oxytocin: t = 2.88, p < 0.05; two-way ANOVA F2,48 = 2.94, p = 0.06) and reciprocal social interaction test (C, n = 7-9 pairs per group; WT vs. Shank3B−/− + vehicle: t = 2.70, p < 0.05; Shank3B−/− + vehicle vs. Shank3B−/− + oxytocin: t = 4.02, p < 0.01; WT vs. Shank3B−/− + oxytocin: t = 1.45, p = 0.49; one-way ANOVA F2,19 = 0.0025). (D-E) In Shank3B−/− vagotomized mice, oxytocin also improved social behavior deficits in the three-chamber test (D, Sociability, n = 7 per group; Shank3B−/− Vagotomized + L. reuteri: t = 1.35, p = 0.33; Shank3B−/− Vagotomized + oxytocin: t = 2.76, p < 0.05, two-way ANOVA F1,24 = 8.46, p = 0.0077) and reciprocal social interaction test (E, n = 5-6 pairs per group; Shank3B−/− Vagotomized + L. reuteri vs. Shank3B−/− Vagotomized + oxytocin: Mann-Whitney Test p < 0.05). ns, not significant. Plots show mean ± SEM. See also Figure S10-S11.
Figure 7.
Figure 7.. L. reuteri rescues the impaired social interaction-induced synaptic plasticity in VTA DA neurons of Shank3B−/− mice, but not in mice lacking oxytocin receptors.
(A) Schematic of electrophysiology experiments. (B) AMPAR/NMDAR ratio in lateral VTA DA neurons recorded at baseline and 24 hours after reciprocal social interaction (n = 6-8; WT baseline vs. Shank3B−/− + vehicle baseline: t = 1.81, p > 0.99; WT baseline vs. WT social interaction: t = 5.70, p < 0.0001; WT baseline vs. Shank3B−/− + vehicle social interaction: t = 0.29, p > 0.99; WT baseline vs. Shank3B−/− + L. reuteri: t = 1.07, p > 0.99; WT baseline vs. Shank3B−/− + L. reuteri social interaction: t = 4.04, p < 0.01; WT baseline vs. Shank3B−/− + cocaine: t = 3.64, p < 0.05; WT baseline vs. Shank3B−/− + oxytocin social interaction: t = 4.29, p < 0.01; Shank3B−/− baseline + vehicle vs. WT social interaction: t = 7.51, p < 0.0001; Shank3B−/− + vehicle baseline vs. Shank3B−/− + vehicle social interaction: t = 1.58, p > 0.99; Shank3B−/− + vehicle baseline vs. Shank3B−/− + L. reuteri: t = 0.66, p > 0.99, Shank3B−/− + vehicle baseline vs. Shank3B−/− + L. reuteri social interaction: t = 5.78, p < 0.0001; Shank3B−/− + vehicle baseline vs. Shank3B−/− + cocaine: t = 5.38, p < 0.0001; Shank3B−/− + vehicle baseline vs. Shank3B−/− + oxytocin social interaction t = 6.1, p < 0.0001; WT social interaction vs. Shank3B−/− + vehicle social interaction: t = 6.18, p < 0.0001; WT social interaction vs. Shank3B−/− + L. reuteri: t = 6.55, p < 0.0001; WT social interaction vs. Shank3B−/− + L. reuteri social interaction: t = 1.43, p > 0.99; WT social interaction vs. Shank3B−/− + cocaine: t = 1.83, p > 0.99; WT social interaction vs. Shank3B−/− + oxytocin social interaction: t = 1.41, p > 0.99; Shank3B−/− + vehicle social interaction vs. Shank3B−/− + L. reuteri: t = 0.82, p > 0.99; Shank3B−/− + vehicle social interaction vs. Shank3B−/− + L. reuteri social interaction: t = 4.44, p < 0.01; Shank3B−/− + vehicle social interaction vs. Shank3B−/− + cocaine: t = 4.03, p < 0.01; Shank3B−/− + vehicle social interaction vs. Shank3B−/− + oxytocin social interaction: t = 4.72, p < 0.001; Shank3B−/− + L. reuteri vs. Shank3B−/− + L. reuteri social interaction: t = 4.93, p < 0.001; Shank3B−/− + L. reuteri vs. Shank3B−/− + cocaine: t = 4.55, p < 0.01; Shank3B−/− + L. reuteri vs. Shank3B−/− + oxytocin social interaction: t = 5.19, p < 0.001; Shank3B−/− + L. reuteri social interaction vs. Shank3B−/− + cocaine: t = 0.38, p > 0.99; Shank3B−/− + L. reuteri social interaction vs. Shank3B−/− + oxytocin social interaction t = 0.07, p > 0.99; Shank3B−/− + cocaine vs. Shank3B−/− + oxytocin social interaction t = 0.47, p > 0.99; one-way ANOVA F7,46 = 16.68, p < 0.0001). Representative AMPA and NMDA traces are shown above each group. (C) Reciprocal social interaction was impaired in DA-Oxtr−/− mice and neither L. reuteri or oxytocin reversed the social deficits in these mice (n = 10-12 pairs per group; Controls vs. DA-Oxtr−/− + vehicle: t = 6.095, p < 0.0001; Controls vs. DA-Oxtr−/− + L. reuteri: t = 5.517, p < 0.0001; Controls vs. DA-Oxtr−/− + oxytocin: t = 5.148, p < 0.0001; DA-Oxtr−/− + vehicle vs. DA-Oxtr−/− + L. reuteri: t = 0.6059, p > 0.99; DA-Oxtr−/− + vehicle vs. DA-Oxtr−/− + oxytocin: t = 0.8639, p > 0.99; DA-Oxtr−/− + L. reuteri vs. DA-Oxtr−/− + oxytocin: t = 0.2712, p > 0.99; one-way ANOVA F3,41 = 15.34, p < 0.0001). (D) AMPA/NMDA ratio of DA neurons in the lateral VTA at baseline and 24 hours after reciprocal social interaction (n = 6-7 per group; DA-Oxtr−/− + vehicle social interaction vs. DA-Oxtr−/− social interaction + L. reuteri: t = 0.02, p > 0.99; DA-Oxtr−/− + vehicle social interaction vs. Controls baseline: t = 0.40, p > 0.99; DA-Oxtr−/− + vehicle social interaction vs. DA-Oxtr−/− + cocaine: t = 5.47, p < 0.0001; DA-Oxtr−/− + vehicle social interaction vs. DA- Oxtr−/− + vehicle: t = 0.44, p > 0.99, DA-Oxtr−/− + vehicle social interaction vs. Controls social interaction: t = 4.92, p < 0.001; DA-Oxtr−/− + vehicle social interaction vs. DA-Oxtr−/− + oxytocin social interaction: t = 0.089, p > 0.99; DA-Oxtr−/− + L. reuteri social interaction vs. Controls baseline: t = 0.37, p > 0.99; DA-Oxtr−/− + L. reuteri social interaction vs. DA- Oxtr−/− + cocaine: t = 5.49, p < 0.0001; DA-Oxtr−/− + L. reuteri social interaction vs. DA-Oxtr−/− + vehicle: t = 0.47, p > 0.99; DA-Oxtr−/− + L. reuteri social interaction vs. Controls social interaction: t = 4.94, p < 0.001; Controls baseline vs. DA-Oxtr−/− + cocaine: t = 6.08, p < 0.0001; Controls baseline vs. DA-Oxtr−/− + vehicle: t = 0.88, p > 0.99; Controls baseline vs. Controls social interaction: t = 5.50, p < 0.0001; Controls baseline vs. DA-Oxtr−/− + oxytocin social interaction: t = 0.32, p > 0.99; DA-Oxtr−/− + cocaine vs. DA-Oxtr−/− + vehicle: t = 5.23, p < 0.001; DA-Oxtr−/− + cocaine vs. Controls social interaction: t = 0.55, p > 0.99; DA-Oxtr−/− + cocaine vs. DA-Oxtr−/− + oxytocin social interaction: t = 5.76, p < 0.0001; DA- Oxtr−/− + vehicle vs. Controls social interaction: t = 4.66, p < 0.001; DA-Oxtr−/− + vehicle vs. DA-Oxtr−/− + oxytocin social interaction: t = 0.55, p > 0.99; Controls social interaction vs. DA-Oxtr−/− + oxytocin social interaction t = 5.19, p < 0.001; one-way ANOVA F6,38 = 13.46, p < 0.0001). ns, not significant. Plots show mean ± SEM. See also Figure S12-S14.

Comment in

References

    1. American Psychiatric Association (2013). Diagnostic and statistical manual of mental disorders (DSM-5®) (American Psychiatric Pub; ).
    1. Arentsen T, Raith H, Qian Y, Forssberg H, and Heijtz RD (2015). Host microbiota modulates development of social preference in mice. Microbial ecology in health and disease 26, 29719. - PMC - PubMed
    1. Baio J, Wiggins L, Christensen DL, Maenner MJ, Daniels J, Warren Z, Kurzius-Spencer M, Zahorodny W, Robinson Rosenberg C, White T, et al. (2018). Prevalence of Autism Spectrum Disorder Among Children Aged 8 Years - Autism and Developmental Disabilities Monitoring Network, 11 Sites, United States, 2014 Morbidity and mortality weekly report Surveillance summaries (Washington, DC: : 2002) 67, 1–23. - PMC - PubMed
    1. Bariselli S, Tzanoulinou S, Glangetas C, Prévost-Solié C, Pucci L, Viguié J, Bezzi P, O'Connor EC, Georges F, and Lüscher C (2016). SHANK3 controls maturation of social reward circuits in the VTA. Nature neuroscience 19, 926. - PMC - PubMed
    1. Benjamini Y, Drai D, Elmer G, Kafkafi N, and Golani I (2001). Controlling the false discovery rate in behavior genetics research. Behavioural brain research 125, 279–284. - PubMed

Publication types

MeSH terms