. 2019 Mar;68(3):571-586.
doi: 10.2337/db18-0363. Epub 2018 Dec 6.

PDK4 Augments ER-Mitochondria Contact to Dampen Skeletal Muscle Insulin Signaling During Obesity

Affiliations

PDK4 Augments ER-Mitochondria Contact to Dampen Skeletal Muscle Insulin Signaling During Obesity

Themis Thoudam et al. Diabetes. 2019 Mar.

Abstract

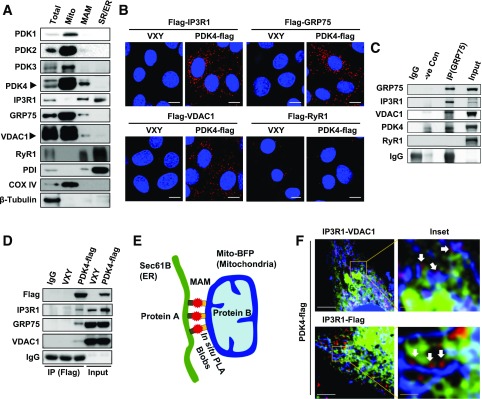
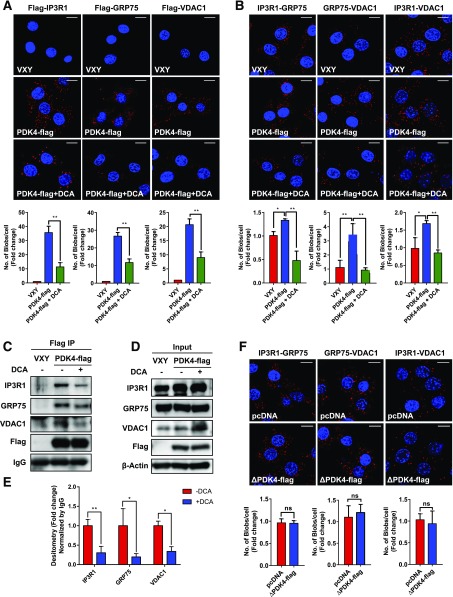
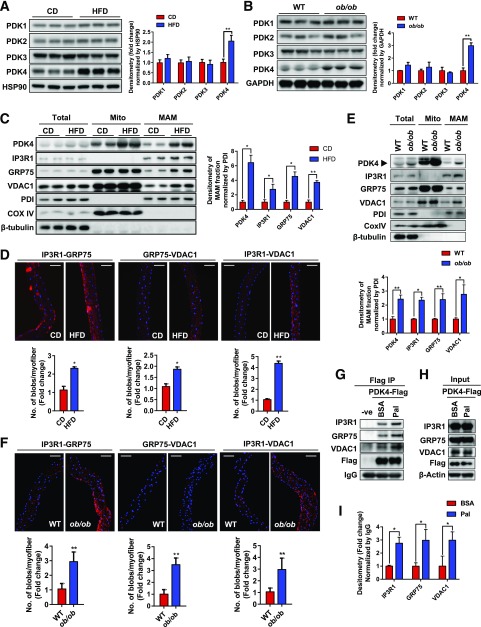
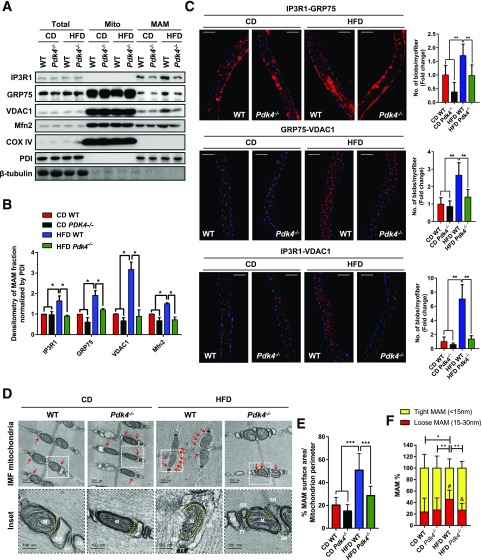
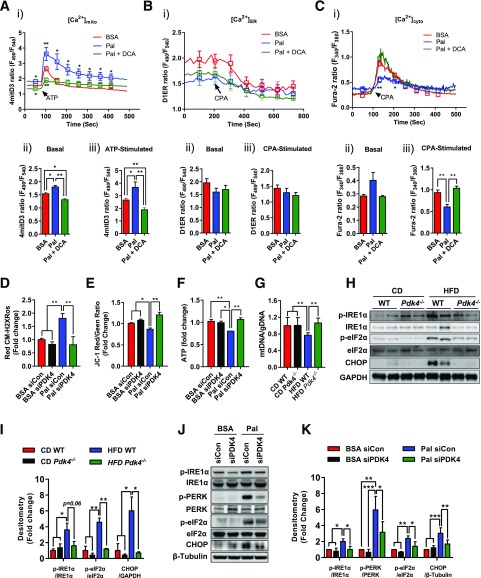
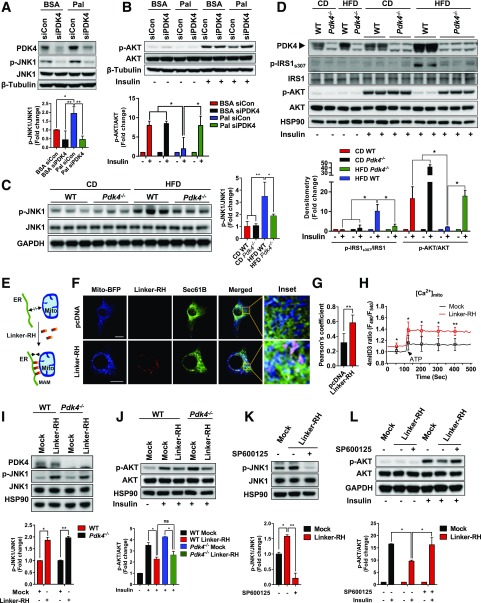
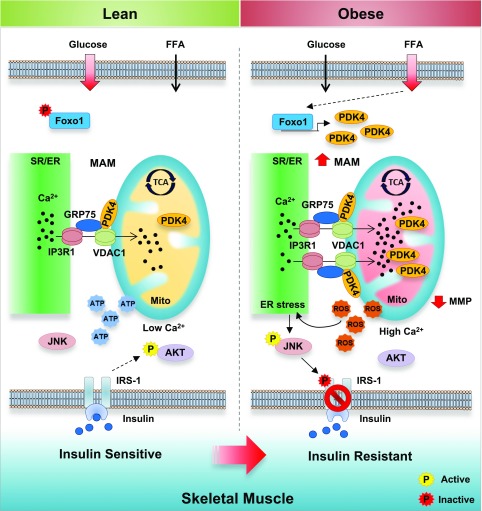
Mitochondria-associated endoplasmic reticulum membrane (MAM) is a structural link between mitochondria and endoplasmic reticulum (ER). MAM regulates Ca2+ transport from the ER to mitochondria via an IP3R1-GRP75-VDAC1 complex-dependent mechanism. Excessive MAM formation may cause mitochondrial Ca2+ overload and mitochondrial dysfunction. However, the exact implication of MAM formation in metabolic syndromes remains debatable. Here, we demonstrate that PDK4 interacts with and stabilizes the IP3R1-GRP75-VDAC1 complex at the MAM interface. Obesity-induced increase in PDK4 activity augments MAM formation and suppresses insulin signaling. Conversely, PDK4 inhibition dampens MAM formation and improves insulin signaling by preventing MAM-induced mitochondrial Ca2+ accumulation, mitochondrial dysfunction, and ER stress. Furthermore, Pdk4-/- mice exhibit reduced MAM formation and are protected against diet-induced skeletal muscle insulin resistance. Finally, forced formation and stabilization of MAMs with synthetic ER-mitochondria linker prevented the beneficial effects of PDK4 deficiency on insulin signaling. Overall, our findings demonstrate a critical mediatory role of PDK4 in the development of skeletal muscle insulin resistance via enhancement of MAM formation.


Figures

Figure 1
Figure 1
PDK4 resides and interacts with the IP3R1-GRP75-VDAC1 complex at the MAM interface. A: Immunoblot analysis of subcellular fractions isolated from gastrocnemius muscle in mice. Markers for MAM and SR/ER (protein disulfide isomerase [PDI]), mitochondria (cytochrome c oxidase [COX IV]), nucleus (proliferating cell nuclear antigen [PCNA]), and cytosol (β-tubulin). B: In situ PLA in VXY control and PDK4-flag C2C12 myoblasts (scale bars, 10 μm). C: Coimmunoprecipitation (IP) analysis in gastrocnemius muscle homogenate in mice. D: IP analysis in VXY- (control) and PDK4-flag–expressing C2C12 myotubes. E: Schematic illustration depicting detection of protein–protein interaction by in situ PLA at the MAM interface using ER-targeted Sec61B-GFP and mitochondria-targeted mito-BFP. F: Confocal microscope imaging of in situ PLA blobs at the MAM interface (indicated by white arrows) in PDK4-flag–expressing C2C12 myoblasts (scale bars, 5 μm; inset, yellow scale bars, 1 μm). -ve Con, negative control.
Figure 2
Figure 2
Inhibition of PDK4 kinase activity suppresses MAM formation. A and B: In situ PLA in VXY- and PDK4-flag–expressing C2C12 myoblasts ± 4 mmol/L DCA for 6 h (respective panels are quantified below). Scale bars, 20 μm; mean ± SD of n = 3 of >30 cells/experiment (*P < 0.05; **P < 0.01; one-way ANOVA). C: Coimmunoprecipitation (IP) analysis in VXY- and PDK4-flag–expressing C2C12 myotubes ± 4 mmol/L DCA for 6 h. D: Input controls of C. E: Quantification of C (mean ± SD of n = 3) (*P < 0.05, **P < 0.01, Student t test). F: In situ PLA in C2C12 myoblasts that were transfected with either pcDNA or ΔPDK4-flag (respective panels are quantified below). Scale bars, 20 μm; mean ± SD of n = 3 of >30 cells/experiment. ns, not significant.
Figure 3
Figure 3
Obesity enhances MAM formation in skeletal muscle. A: Immunoblot analysis of gastrocnemius muscle isolated from CD- and HFD-fed mice (left) and quantification (mean ± SD of n = 6/group; **P < 0.01, Student t test). B: Immunoblot analysis of gastrocnemius muscle isolated from WT and ob/ob mice (left) and quantification (mean ± SD of n = 3/group; **P < 0.01, Student t test) (right). C: Representative immunoblot analysis of subcellular fractions isolated from gastrocnemius muscle of CD- or HFD-fed mice (left) and quantification of MAM fractions (mean ± SD of n = 3/group; *P < 0.05; **P < 0.01, Student t test) (right). D: In situ PLA in isolated myofibers from CD- and HFD-fed mice (respective panels are quantified below). Scale bars, 100 μm; mean ± SD of ∼10–15 myofibers/sample (*P < 0.05, **P < 0.01, Student t test). E: Immunoblot analysis of subcellular fractions isolated from gastrocnemius muscle of WT and ob/ob mice (top) and quantification of MAM fractions (representative of gastrocnemius skeletal muscle pooled from n = 6 mice/group; mean ± SD of n = 3) (*P < 0.05, **P < 0.01, Student t test) (bottom). F: In situ PLA in isolated myofibers from WT and ob/ob mice (respective panels are quantified below). Scale bars, 100 μm; mean ± SD of ∼10–20 myofibers/sample (**P < 0.01, Student t test). G: Coimmunoprecipitation (IP) analysis in PDK4-flag–overexpressing C2C12 myotubes treated with 0.4 mmol/L palmitate (Pal)/BSA for 16 h. H: Input control of G. I: Quantification of G (mean ± SD of n = 3; *P < 0.05, Student t test). -ve, negative control.
Figure 4
Figure 4
Genetic ablation of PDK4 reduced MAM formation in skeletal muscle of mice with diet-induced obesity. A: Immunoblot analysis of subcellular fractions isolated from CD- or HFD-fed WT and Pdk4−/− mice. B: Quantification of proteins in MAM fraction of A (gastrocnemius muscle pooled from n = 6 mice/group, and two independent experiments were performed) (*P < 0.05, one-way ANOVA). C: In situ PLA in isolated myofibers from CD- or HFD-fed WT and Pdk4−/− mice (scale bars, 100 μm) (left) and quantification of in situ PLA blobs (mean ± SD of ∼10–20 myofibers/sample) (**P < 0.01, one-way ANOVA) (right). D: Representative TEM images showing the association of SR/ER and IMF in gastrocnemius muscle isolated from CD- or HFD-fed WT and Pdk4−/− mice (red arrows indicate the SR–mitochondria contact sites) (scale bars, 200 nm). Inset: yellow dotted line indicating the surface area of MAM (M, mitochondria; TT, T-tubule) (inset scale bars, 100 nm). E: Percentage of MAM surface area per mitochondrion perimeter in each microscopic field (n = 20/group; mean ± SD; ***P < 0.001, one-way ANOVA). F: Percentage of tight MAM (<15 nm) and loose MAM (15–30 nm) in total MAM surface area (n = 28–41/group; mean ± SD; *P < 0.05, **P < 0.01, #P < 0.05 control vs. WT HFD; &P < 0.05 WT HFD vs. Pdk4−/− HFD, one-way ANOVA).
Figure 5
Figure 5
PDK4 inhibition attenuates MAM-mediated Ca2+ transfer from ER to mitochondria, mitochondrial dysfunction, and ER stress. A: Mitochondrial Ca2+ flux was measured using 4mitD3 probe (Ai). Basal [Ca2+]mito (Aii) and [Ca2+]mito after stimulation with 500 nmol/L ATP (Aiii) in C2C12 myoblast treated with 50 μmol/L palmitate (Pal)/BSA and ± 4 mmol/L DCA for 16 h (n = 9–12/group; mean ± SD; *P < 0.05, **P < 0.01, one-way ANOVA). B: ER lumen Ca2+ was measured using D1ER (Bi). Basal [Ca2+]ER (Bii) and [Ca2+]ER after stimulation with 1 µmol/L CPA (Biii) in C2C12 myoblast treated with 50 μmol/L Pal/BSA and ± 4 mmol/L DCA for 16 h (n = 9–12/group; mean ± SD). C: Cytosolic Ca2+ measurement using Fura-2 dye (Ci). Basal [Ca2+]cyto (Cii) and [Ca2+]cyto after stimulation with 1 µmol/L CPA (Ciii) in C2C12 myoblast treated with 50 μmol/L Pal/BSA and ± 4 mmol/L DCA for 16 h (n = 9–12/group; mean ± SD; **P < 0.01, one-way ANOVA). D: Evaluation of mitochondrial ROS generation after 16-h incubation with 0.4 mmol/L Pal/BSA in control siRNA (siCon)/siPDK4-transfected C2C12 myotubes using CM-H2XRos normalized by MitoTracker green FM (n = 3; mean ± SD; **P < 0.01, one-way ANOVA). E: MMP in siCon/siPDK4-transfected C2C12 myotubes using JC-1 dye by FACS. Graph indicates the JC-1 Red and Green ratio (n = 3; mean ± SD; *P < 0.05, **P < 0.01, one-way ANOVA). F: Cellular ATP level was measured in siCon/siPDK4-transfected C2C12 myotubes by ATPlite luminescence assay (n = 3; mean ± SD; *P < 0.05, **P < 0.01, one-way ANOVA). G: Quantitative RT-PCR measurement of mtDNA (mitochondrial ND1) normalized by gDNA (nuclear Pecam1) in gastrocnemius muscle of CD- or HFD-fed WT and Pdk4−/− mice (n = 5/group; mean ± SD; **P < 0.01, one-way ANOVA). H: Representative immunoblot analysis of ER stress markers in gastrocnemius muscle tissue of CD- or HFD-fed WT and Pdk4−/− mice. I: Quantification of H (mean ± SD of n = 4 to 5/group; *P < 0.05, **P < 0.01, one-way ANOVA). J: Representative immunoblot analysis of ER stress markers in siCon/siPDK4-transfected C2C12 myotubes. K: Quantification of J (mean ± SD of n = 4; *P < 0.05, **P < 0.01, ***P < 0.001, one-way ANOVA). p-, phosphorylated; Sec, seconds.
Figure 6
Figure 6
PDK4 deficiency attenuates palmitate (Pal)–induced skeletal muscle IR via downregulation of MAM. A: Immunoblot analysis in control siRNA (siCon)/siPDK4-transfected C2C12 myotubes (top) and quantification (mean ± SD of n = 3; *P < 0.05, **P < 0.01, one-way ANOVA) (bottom). B: Immunoblot analysis in siCon/siPDK4-transfected C2C12 myotubes following 100 nmol/L insulin treatment for 10 min (top) and quantification (mean ± SD of n = 3; *P < 0.05, one-way ANOVA) (bottom). C: Immunoblot analysis in gastrocnemius muscle homogenate isolated from CD- or HFD-fed WT or Pdk4−/− mice (left) and quantification (mean ± SD of n = 3/group; *P < 0.05, **P < 0.01, one-way ANOVA) (right). D: Immunoblot analysis of insulin action in CD- or HFD-fed WT or Pdk4−/− mice (top) and quantification (mean ± SD of n = 3 to 4/group; *P < 0.05, one-way ANOVA) (bottom). E: Graphical representation of synthetic ER–mitochondria linker: linker-RFP HA (Linker-RH)–mediated MAM induction. F: Targeting of Linker-RH at MAM interface was examined in C2C12 myoblast using mito-BFP (mitochondria) and Sec61B (ER) by confocal microscopy (scale bars, 20 μm). G: Pearson coefficient for colocalization between mito-BFP (mitochondria) and Sec61B (ER) in pcDNA- or Linker-RH–transfected C2C12 myoblast (mean ± SD of n = 8; **P < 0.01, Student t test). H: Basal and stimulated (with 500 nmol/L ATP) mitochondrial Ca2+ flux was measured in mock or Linker-RH–transduced C2C12 myoblast using 4mitD3 probe (n = 9–12/group; mean ± SD; *P < 0.05, **P < 0.01, Student t test). I: Immunoblot analysis after mock or Linker-RH transduction in WT or Pdk4−/− primary myotubes (top) and quantification (mean ± SD of n = 3/group; *P < 0.05, **P < 0.01, Student t test) (bottom). J: AKT activation, following 10 min of 100 nmol/L insulin stimulation, was evaluated in mock or Linker-RH–transduced WT or Pdk4−/− primary myotubes (top). Bottom: quantification (mean ± SD of n = 3/group; *P < 0.05, Student t test). K: JNK phosphorylation was evaluated after mock or Linker-RH transduction in DMSO or 20 μmol/L SP600125 treated for 6 h in WT primary myotubes (top). Bottom: quantification (mean ± SD of n = 3; *P < 0.05, **P < 0.01, Student t test). L: Insulin-induced AKT activation was evaluated in mock or Linker-RH–transduced WT primary myotubes treated with DMSO or 20 μmol/L SP600125 for 6 h (top). Bottom: quantification (mean ± SD of n = 3; *P < 0.05, Student t test). Sec, seconds.
Figure 7
Figure 7
A graphical representation demonstrating the role of PDK4 in obesity-induced MAM formation and skeletal muscle IR. In skeletal muscle, PDK4 interacts with and stabilizes the IP3R1-GRP75-VDAC1 complex at the MAM interface. In physiological conditions, PDK4 is expressed at low levels, and moderate Ca2+ transfer from ER to mitochondria via the IP3R1-GRP75-VDAC1 complex formation stimulates mitochondrial ATP production. However, obesity- or free fatty acid (FFA)–induced overexpression of PDK4 via Foxo1 activation augments MAM formation and promotes mitochondrial Ca2+ accumulation, mitochondrial dysfunction, and ER stress. Subsequently, ER stress-mediated JNK activation leads to inhibition of the insulin signaling pathway.

References

    1. Arruda AP, Hotamisligil GS. Calcium homeostasis and organelle function in the pathogenesis of obesity and diabetes. Cell Metab 2015;22:381–397 - PMC - PubMed
    1. Szabadkai G, Bianchi K, Várnai P, et al. Chaperone-mediated coupling of endoplasmic reticulum and mitochondrial Ca2+ channels. J Cell Biol 2006;175:901–911 - PMC - PubMed
    1. Tubbs E, Theurey P, Vial G, et al. Mitochondria-associated endoplasmic reticulum membrane (MAM) integrity is required for insulin signaling and is implicated in hepatic insulin resistance. Diabetes 2014;63:3279–3294 - PubMed
    1. Arruda AP, Pers BM, Parlakgül G, Güney E, Inouye K, Hotamisligil GS. Chronic enrichment of hepatic endoplasmic reticulum-mitochondria contact leads to mitochondrial dysfunction in obesity. Nat Med 2014;20:1427–1435 - PMC - PubMed
    1. Rieusset J, Fauconnier J, Paillard M, et al. Disruption of calcium transfer from ER to mitochondria links alterations of mitochondria-associated ER membrane integrity to hepatic insulin resistance. Diabetologia 2016;59:614–623 - PubMed

Publication types

MeSH terms